Aleut 2 or more Vehicles in Household

COMPARE

Aleut
Race
Ancestry
AfghanAfricanAlaska NativeAlaskan AthabascanAlbanianAleutAlsatianAmericanApacheArabArapahoArgentineanArmenianAssyrian/Chaldean/SyriacAustralianAustrianBahamianBangladeshiBarbadianBasqueBelgianBelizeanBermudanBhutaneseBlackfeetBolivianBrazilianBritishBritish West IndianBulgarianBurmeseCajunCambodianCanadianCape VerdeanCarpatho RusynCelticCentral AmericanCentral American IndianCherokeeCheyenneChickasawChileanChineseChippewaChoctawColombianColvilleComancheCosta RicanCreeCreekCroatianCrowCubanCypriotCzechCzechoslovakianDanishDelawareDominicanDutchDutch West IndianEastern EuropeanEcuadorianEgyptianEnglishEstonianEthiopianEuropeanFijianFilipinoFinnishFrenchFrench American IndianFrench CanadianGermanGerman RussianGhanaianGreekGuamanian/ChamorroGuatemalanGuyaneseHaitianHmongHonduranHopiHoumaHungarianIcelanderIndian (Asian)IndonesianInupiatIranianIraqiIrishIroquoisIsraeliItalianJamaicanJapaneseJordanianKenyanKiowaKoreanLaotianLatvianLebaneseLiberianLithuanianLumbeeLuxembourgerMacedonianMalaysianMalteseMarshalleseMenomineeMexicanMexican American IndianMongolianMoroccanNative HawaiianNavajoNepaleseNew ZealanderNicaraguanNigerianNorthern EuropeanNorwegianOkinawanOsageOttawaPaiutePakistaniPalestinianPanamanianParaguayanPennsylvania GermanPeruvianPimaPolishPortuguesePotawatomiPuebloPuerto RicanPuget Sound SalishRomanianRussianSalvadoranSamoanScandinavianScotch-IrishScottishSeminoleSenegaleseSerbianShoshoneSierra LeoneanSiouxSlavicSlovakSloveneSomaliSouth AfricanSouth AmericanSouth American IndianSoviet UnionSpaniardSpanishSpanish AmericanSpanish American IndianSri LankanSubsaharan AfricanSudaneseSwedishSwissSyrianTaiwaneseThaiTlingit-HaidaTohono O'OdhamTonganTrinidadian and TobagonianTsimshianTurkishU.S. Virgin IslanderUgandanUkrainianUruguayanUteVenezuelanVietnameseWelshWest IndianYakamaYaquiYugoslavianYumanYup'ikZimbabwean
Immigration
NonimmigrantsImmigrantsAfghanistanAfricaAlbaniaArgentinaArmeniaAsiaAustraliaAustriaBahamasBangladeshBarbadosBelarusBelgiumBelizeBoliviaBosnia and HerzegovinaBrazilBulgariaBurma/MyanmarCabo VerdeCambodiaCameroonCanadaCaribbeanCentral AmericaChileChinaColombiaCongoCosta RicaCroatiaCubaCzechoslovakiaDenmarkDominicaDominican RepublicEastern AfricaEastern AsiaEastern EuropeEcuadorEgyptEl SalvadorEnglandEritreaEthiopiaEuropeFijiFranceGermanyGhanaGreeceGrenadaGuatemalaGuyanaHaitiHondurasHong KongHungaryIndiaIndonesiaIranIraqIrelandIsraelItalyJamaicaJapanJordanKazakhstanKenyaKoreaKuwaitLaosLatin AmericaLatviaLebanonLiberiaLithuaniaMalaysiaMexicoMicronesiaMiddle AfricaMoldovaMoroccoNepalNetherlandsNicaraguaNigeriaNorth AmericaNorth MacedoniaNorthern AfricaNorthern EuropeNorwayOceaniaPakistanPanamaPeruPhilippinesPolandPortugalRomaniaRussiaSaudi ArabiaScotlandSenegalSerbiaSierra LeoneSingaporeSomaliaSouth AfricaSouth AmericaSouth Central AsiaSouth Eastern AsiaSouthern EuropeSpainSri LankaSt. Vincent and the GrenadinesSudanSwedenSwitzerlandSyriaTaiwanThailandTrinidad and TobagoTurkeyUgandaUkraineUruguayUzbekistanVenezuelaVietnamWest IndiesWestern AfricaWestern AsiaWestern EuropeYemenZaireZimbabweAzores
Select to Compare
Race
Ancestry
AfghanAfricanAlaska NativeAlaskan AthabascanAlbanianAlsatianAmericanApacheArabArapahoArgentineanArmenianAssyrian/Chaldean/SyriacAustralianAustrianBahamianBangladeshiBarbadianBasqueBelgianBelizeanBermudanBhutaneseBlackfeetBolivianBrazilianBritishBritish West IndianBulgarianBurmeseCajunCambodianCanadianCape VerdeanCarpatho RusynCelticCentral AmericanCentral American IndianCherokeeCheyenneChickasawChileanChineseChippewaChoctawColombianColvilleComancheCosta RicanCreeCreekCroatianCrowCubanCypriotCzechCzechoslovakianDanishDelawareDominicanDutchDutch West IndianEastern EuropeanEcuadorianEgyptianEnglishEstonianEthiopianEuropeanFijianFilipinoFinnishFrenchFrench American IndianFrench CanadianGermanGerman RussianGhanaianGreekGuamanian/ChamorroGuatemalanGuyaneseHaitianHmongHonduranHopiHoumaHungarianIcelanderIndian (Asian)IndonesianInupiatIranianIraqiIrishIroquoisIsraeliItalianJamaicanJapaneseJordanianKenyanKiowaKoreanLaotianLatvianLebaneseLiberianLithuanianLumbeeLuxembourgerMacedonianMalaysianMalteseMarshalleseMenomineeMexicanMexican American IndianMongolianMoroccanNative HawaiianNavajoNepaleseNew ZealanderNicaraguanNigerianNorthern EuropeanNorwegianOkinawanOsageOttawaPaiutePakistaniPalestinianPanamanianParaguayanPennsylvania GermanPeruvianPimaPolishPortuguesePotawatomiPuebloPuerto RicanPuget Sound SalishRomanianRussianSalvadoranSamoanScandinavianScotch-IrishScottishSeminoleSenegaleseSerbianShoshoneSierra LeoneanSiouxSlavicSlovakSloveneSomaliSouth AfricanSouth AmericanSouth American IndianSoviet UnionSpaniardSpanishSpanish AmericanSpanish American IndianSri LankanSubsaharan AfricanSudaneseSwedishSwissSyrianTaiwaneseThaiTlingit-HaidaTohono O'OdhamTonganTrinidadian and TobagonianTsimshianTurkishU.S. Virgin IslanderUgandanUkrainianUruguayanUteVenezuelanVietnameseWelshWest IndianYakamaYaquiYugoslavianYumanYup'ikZimbabwean
Immigration
NonimmigrantsImmigrantsAfghanistanAfricaAlbaniaArgentinaArmeniaAsiaAustraliaAustriaBahamasBangladeshBarbadosBelarusBelgiumBelizeBoliviaBosnia and HerzegovinaBrazilBulgariaBurma/MyanmarCabo VerdeCambodiaCameroonCanadaCaribbeanCentral AmericaChileChinaColombiaCongoCosta RicaCroatiaCubaCzechoslovakiaDenmarkDominicaDominican RepublicEastern AfricaEastern AsiaEastern EuropeEcuadorEgyptEl SalvadorEnglandEritreaEthiopiaEuropeFijiFranceGermanyGhanaGreeceGrenadaGuatemalaGuyanaHaitiHondurasHong KongHungaryIndiaIndonesiaIranIraqIrelandIsraelItalyJamaicaJapanJordanKazakhstanKenyaKoreaKuwaitLaosLatin AmericaLatviaLebanonLiberiaLithuaniaMalaysiaMexicoMicronesiaMiddle AfricaMoldovaMoroccoNepalNetherlandsNicaraguaNigeriaNorth AmericaNorth MacedoniaNorthern AfricaNorthern EuropeNorwayOceaniaPakistanPanamaPeruPhilippinesPolandPortugalRomaniaRussiaSaudi ArabiaScotlandSenegalSerbiaSierra LeoneSingaporeSomaliaSouth AfricaSouth AmericaSouth Central AsiaSouth Eastern AsiaSouthern EuropeSpainSri LankaSt. Vincent and the GrenadinesSudanSwedenSwitzerlandSyriaTaiwanThailandTrinidad and TobagoTurkeyUgandaUkraineUruguayUzbekistanVenezuelaVietnamWest IndiesWestern AfricaWestern AsiaWestern EuropeYemenZaireZimbabweAzores
2 or more Vehicles in Household
Income
Poverty
Unemployment
Labor Participation
Family Structure
Vehicle Availability
Education Level
Disability

Aleut 2 or more Vehicles in Household
Tragic

54.1%
2+ VEHICLES AVAILABLE
9.3/ 100
METRIC RATING
215th/ 347
METRIC RANK

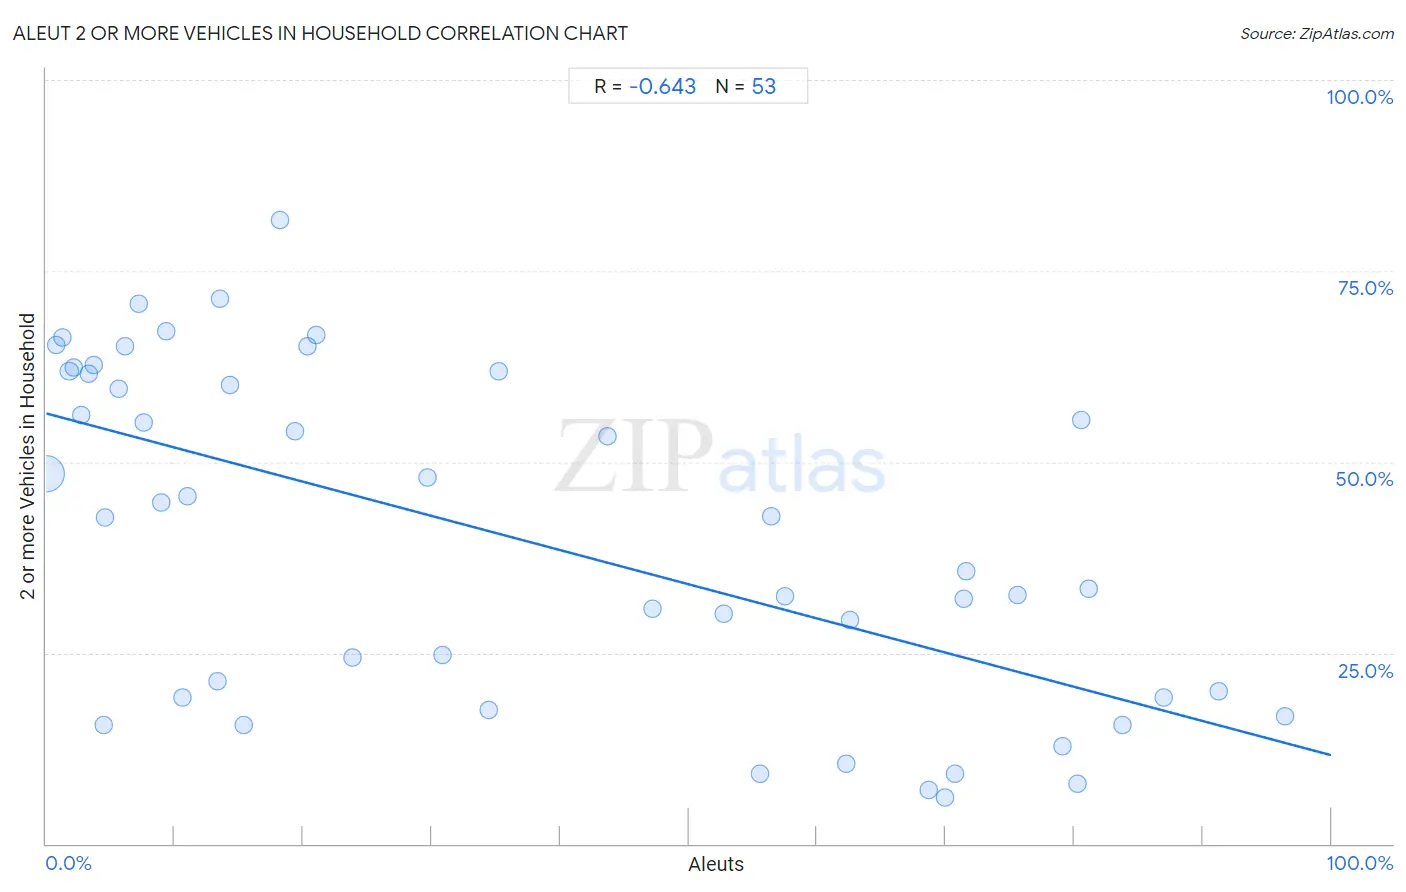
Aleut 2 or more Vehicles in Household Correlation Chart

The statistical analysis conducted on geographies consisting of 61,767,595 people shows a significant negative correlation between the proportion of Aleuts and percentage of households with 2 or more vehicles available in the United States with a correlation coefficient (R) of -0.643 and weighted average of 54.1%. On average, for every 1% (one percent) increase in Aleuts within a typical geography, there is a decrease of 0.45% in percentage of households with 2 or more vehicles available.
Aleut 2 or more Vehicles in Household
It is essential to understand that the correlation between the percentage of Aleuts and percentage of households with 2 or more vehicles available does not imply a direct cause-and-effect relationship. It remains uncertain whether the presence of Aleuts influences an upward or downward trend in the level of percentage of households with 2 or more vehicles available within an area, or if Aleuts simply ended up residing in those areas with higher or lower levels of percentage of households with 2 or more vehicles available due to other factors.

Demographics Similar to Aleuts by 2 or more Vehicles in Household

In terms of 2 or more vehicles in household, the demographic groups most similar to Aleuts are Immigrants from Western Asia (54.1%, a difference of 0.0%), Immigrants from Czechoslovakia (54.1%, a difference of 0.010%), Guatemalan (54.1%, a difference of 0.030%), Immigrants from Chile (54.2%, a difference of 0.20%), and Immigrants from Hungary (54.2%, a difference of 0.22%).
DemographicsRating | Rank2 or more Vehicles in Household
Egyptians
12.0
/100
|
#208
Poor
54.3%
Immigrants from Bulgaria
12.0
/100
|
#209
Poor
54.3%
Immigrants from Saudi Arabia
11.3
/100
|
#210
Poor
54.2%
Immigrants from Hungary
11.3
/100
|
#211
Poor
54.2%
Immigrants from Chile
11.1
/100
|
#212
Poor
54.2%
Guatemalans
9.6
/100
|
#213
Tragic
54.1%
Immigrants from Czechoslovakia
9.4
/100
|
#214
Tragic
54.1%
Aleuts
9.3
/100
|
#215
Tragic
54.1%
Immigrants from Western Asia
9.3
/100
|
#216
Tragic
54.1%
Immigrants from Burma/Myanmar
7.1
/100
|
#217
Tragic
53.9%
Immigrants from Argentina
6.8
/100
|
#218
Tragic
53.9%
South American Indians
6.5
/100
|
#219
Tragic
53.9%
Taiwanese
6.3
/100
|
#220
Tragic
53.9%
Immigrants from Singapore
6.3
/100
|
#221
Tragic
53.9%
Kiowa
6.2
/100
|
#222
Tragic
53.9%

Aleut 2 or more Vehicles in Household Correlation Summary

MeasurementAleut Data2 or more Vehicles in Household Data
Minimum0.022%6.1%
Maximum96.4%81.6%
Range96.4%75.6%
Mean36.3%40.1%
Median23.9%42.7%
Interquartile 25% (IQ1)7.4%19.2%
Interquartile 75% (IQ3)69.3%61.7%
Interquartile Range (IQR)61.9%42.5%
Standard Deviation (Sample)31.2%21.7%
Standard Deviation (Population)30.9%21.5%

Correlation Details

Aleut PercentileSample Size2 or more Vehicles in Household
[
0.0%
-
0.5%
]
0.022%
60,514,89548.4%
[
0.5%
-
1.0%
]
0.74%
352,55165.3%
[
1.0%
-
1.5%
]
1.22%
191,60666.4%
[
1.5%
-
2.0%
]
1.80%
473,43661.9%
[
2.0%
-
2.5%
]
2.12%
88,75662.4%
[
2.5%
-
3.0%
]
2.72%
48,90656.1%
[
3.0%
-
3.5%
]
3.27%
15,54761.6%
[
3.5%
-
4.0%
]
3.68%
19,41962.7%
[
4.0%
-
4.5%
]
4.43%
36115.5%
[
4.5%
-
5.0%
]
4.59%
15,23542.7%
[
5.5%
-
6.0%
]
5.65%
2,77759.5%
[
6.0%
-
6.5%
]
6.17%
3,58065.2%
[
7.0%
-
7.5%
]
7.17%
96370.7%
[
7.5%
-
8.0%
]
7.61%
10,35155.2%
[
8.5%
-
9.0%
]
8.98%
40144.7%
[
9.0%
-
9.5%
]
9.38%
12,61867.1%
[
10.5%
-
11.0%
]
10.62%
22619.1%
[
11.0%
-
11.5%
]
11.00%
20945.6%
[
13.0%
-
13.5%
]
13.29%
14321.3%
[
13.5%
-
14.0%
]
13.51%
3771.4%
[
14.0%
-
14.5%
]
14.35%
23060.0%
[
15.0%
-
15.5%
]
15.32%
49615.6%
[
18.0%
-
18.5%
]
18.16%
4,68081.6%
[
19.0%
-
19.5%
]
19.32%
38354.0%
[
20.0%
-
20.5%
]
20.33%
12365.2%
[
21.0%
-
21.5%
]
21.05%
83666.7%
[
23.5%
-
24.0%
]
23.87%
24324.4%
[
29.5%
-
30.0%
]
29.65%
45248.0%
[
30.5%
-
31.0%
]
30.80%
23724.8%
[
34.0%
-
34.5%
]
34.47%
23517.4%
[
35.0%
-
35.5%
]
35.19%
10861.9%
[
43.5%
-
44.0%
]
43.69%
2,34453.4%
[
47.0%
-
47.5%
]
47.17%
10630.8%
[
52.5%
-
53.0%
]
52.71%
2,21630.2%
[
55.5%
-
56.0%
]
55.56%
549.1%
[
56.0%
-
56.5%
]
56.41%
7842.9%
[
57.0%
-
57.5%
]
57.45%
9432.4%
[
62.0%
-
62.5%
]
62.24%
9810.5%
[
62.5%
-
63.0%
]
62.58%
31029.3%
[
68.5%
-
69.0%
]
68.70%
1157.0%
[
69.5%
-
70.0%
]
69.90%
2066.1%
[
70.5%
-
71.0%
]
70.69%
589.1%
[
71.0%
-
71.5%
]
71.43%
12632.1%
[
71.5%
-
72.0%
]
71.58%
9535.7%
[
75.5%
-
76.0%
]
75.56%
9032.5%
[
79.0%
-
79.5%
]
79.08%
69812.8%
[
80.0%
-
80.5%
]
80.23%
1727.9%
[
80.5%
-
81.0%
]
80.56%
14455.6%
[
81.0%
-
81.5%
]
81.18%
17033.3%
[
83.5%
-
84.0%
]
83.80%
14215.6%
[
86.5%
-
87.0%
]
86.96%
6919.2%
[
91.0%
-
91.5%
]
91.23%
11420.0%
[
96.0%
-
96.5%
]
96.43%
5616.7%