Immigrants from Burma/Myanmar vs Bahamian Unemployment Among Women with Children Ages 6 to 17 years
COMPARE
Immigrants from Burma/Myanmar
Bahamian
Unemployment Among Women with Children Ages 6 to 17 years
Unemployment Among Women with Children Ages 6 to 17 years Comparison
Immigrants from Burma/Myanmar
Bahamians
7.5%
UNEMPLOYMENT AMONG WOMEN WITH CHILDREN AGES 6 TO 17 YEARS
100.0/ 100
METRIC RATING
16th/ 347
METRIC RANK
10.4%
UNEMPLOYMENT AMONG WOMEN WITH CHILDREN AGES 6 TO 17 YEARS
0.0/ 100
METRIC RATING
315th/ 347
METRIC RANK
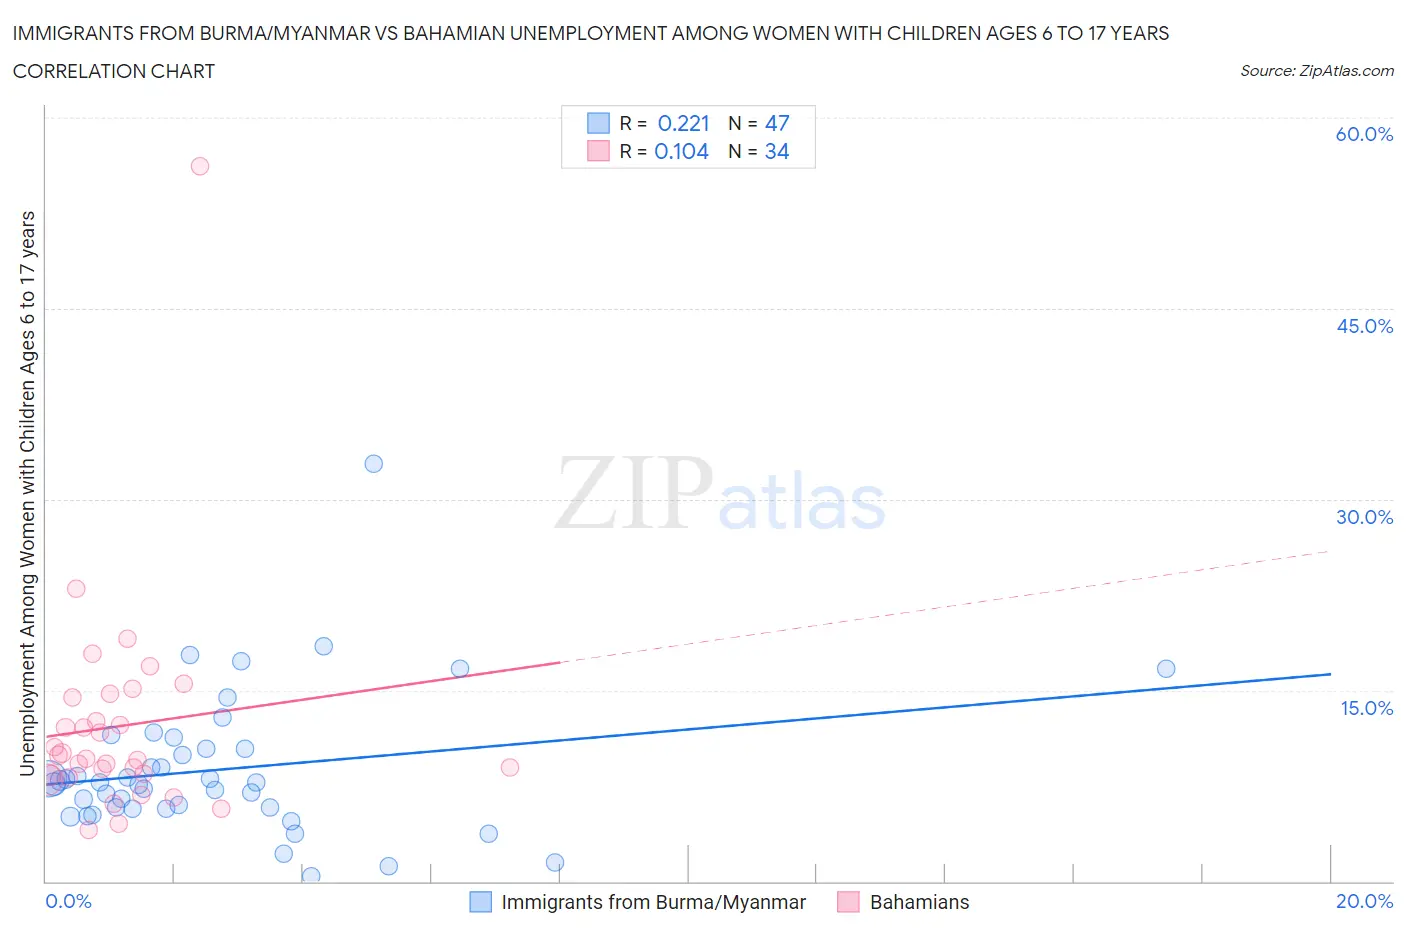
Immigrants from Burma/Myanmar vs Bahamian Unemployment Among Women with Children Ages 6 to 17 years Correlation Chart
The statistical analysis conducted on geographies consisting of 144,257,995 people shows a weak positive correlation between the proportion of Immigrants from Burma/Myanmar and unemployment rate among women with children between the ages 6 and 17 in the United States with a correlation coefficient (R) of 0.221 and weighted average of 7.5%. Similarly, the statistical analysis conducted on geographies consisting of 97,201,604 people shows a poor positive correlation between the proportion of Bahamians and unemployment rate among women with children between the ages 6 and 17 in the United States with a correlation coefficient (R) of 0.104 and weighted average of 10.4%, a difference of 38.7%.
Unemployment Among Women with Children Ages 6 to 17 years Correlation Summary
| Measurement | Immigrants from Burma/Myanmar | Bahamian |
| Minimum | 0.40% | 4.0% |
| Maximum | 32.8% | 56.2% |
| Range | 32.4% | 52.2% |
| Mean | 8.8% | 12.2% |
| Median | 7.8% | 9.7% |
| Interquartile 25% (IQ1) | 5.7% | 8.3% |
| Interquartile 75% (IQ3) | 10.4% | 14.5% |
| Interquartile Range (IQR) | 4.7% | 6.2% |
| Standard Deviation (Sample) | 5.6% | 8.9% |
| Standard Deviation (Population) | 5.5% | 8.7% |
Similar Demographics by Unemployment Among Women with Children Ages 6 to 17 years
Demographics Similar to Immigrants from Burma/Myanmar by Unemployment Among Women with Children Ages 6 to 17 years
In terms of unemployment among women with children ages 6 to 17 years, the demographic groups most similar to Immigrants from Burma/Myanmar are Cambodian (7.5%, a difference of 0.18%), Puget Sound Salish (7.5%, a difference of 0.36%), Afghan (7.6%, a difference of 0.84%), Filipino (7.6%, a difference of 0.86%), and Sudanese (7.4%, a difference of 1.4%).
| Demographics | Rating | Rank | Unemployment Among Women with Children Ages 6 to 17 years |
| Assyrians/Chaldeans/Syriacs | 100.0 /100 | #9 | Exceptional 7.2% |
| Immigrants | Fiji | 100.0 /100 | #10 | Exceptional 7.3% |
| Immigrants | Taiwan | 100.0 /100 | #11 | Exceptional 7.3% |
| Bangladeshis | 100.0 /100 | #12 | Exceptional 7.4% |
| Indonesians | 100.0 /100 | #13 | Exceptional 7.4% |
| Sudanese | 100.0 /100 | #14 | Exceptional 7.4% |
| Puget Sound Salish | 100.0 /100 | #15 | Exceptional 7.5% |
| Immigrants | Burma/Myanmar | 100.0 /100 | #16 | Exceptional 7.5% |
| Cambodians | 100.0 /100 | #17 | Exceptional 7.5% |
| Afghans | 100.0 /100 | #18 | Exceptional 7.6% |
| Filipinos | 100.0 /100 | #19 | Exceptional 7.6% |
| Immigrants | Singapore | 100.0 /100 | #20 | Exceptional 7.7% |
| Immigrants | India | 100.0 /100 | #21 | Exceptional 7.7% |
| Immigrants | China | 100.0 /100 | #22 | Exceptional 7.7% |
| Immigrants | Indonesia | 100.0 /100 | #23 | Exceptional 7.7% |
Demographics Similar to Bahamians by Unemployment Among Women with Children Ages 6 to 17 years
In terms of unemployment among women with children ages 6 to 17 years, the demographic groups most similar to Bahamians are Immigrants from Cabo Verde (10.4%, a difference of 0.030%), American (10.4%, a difference of 0.080%), African (10.4%, a difference of 0.26%), Immigrants from Dominica (10.5%, a difference of 0.75%), and Bermudan (10.5%, a difference of 0.87%).
| Demographics | Rating | Rank | Unemployment Among Women with Children Ages 6 to 17 years |
| Dutch West Indians | 0.0 /100 | #308 | Tragic 10.2% |
| French Canadians | 0.0 /100 | #309 | Tragic 10.3% |
| Alaska Natives | 0.0 /100 | #310 | Tragic 10.3% |
| Immigrants | Liberia | 0.0 /100 | #311 | Tragic 10.3% |
| Africans | 0.0 /100 | #312 | Tragic 10.4% |
| Americans | 0.0 /100 | #313 | Tragic 10.4% |
| Immigrants | Cabo Verde | 0.0 /100 | #314 | Tragic 10.4% |
| Bahamians | 0.0 /100 | #315 | Tragic 10.4% |
| Immigrants | Dominica | 0.0 /100 | #316 | Tragic 10.5% |
| Bermudans | 0.0 /100 | #317 | Tragic 10.5% |
| Delaware | 0.0 /100 | #318 | Tragic 10.5% |
| Immigrants | Uganda | 0.0 /100 | #319 | Tragic 10.7% |
| Apache | 0.0 /100 | #320 | Tragic 10.7% |
| Tohono O'odham | 0.0 /100 | #321 | Tragic 10.7% |
| Cree | 0.0 /100 | #322 | Tragic 10.8% |