Immigrants from Afghanistan vs Ute Wage/Income Gap
COMPARE
Immigrants from Afghanistan
Ute
Wage/Income Gap
Wage/Income Gap Comparison
Immigrants from Afghanistan
Ute
24.4%
WAGE/INCOME GAP
95.9/ 100
METRIC RATING
117th/ 347
METRIC RANK
27.8%
WAGE/INCOME GAP
0.8/ 100
METRIC RATING
271st/ 347
METRIC RANK
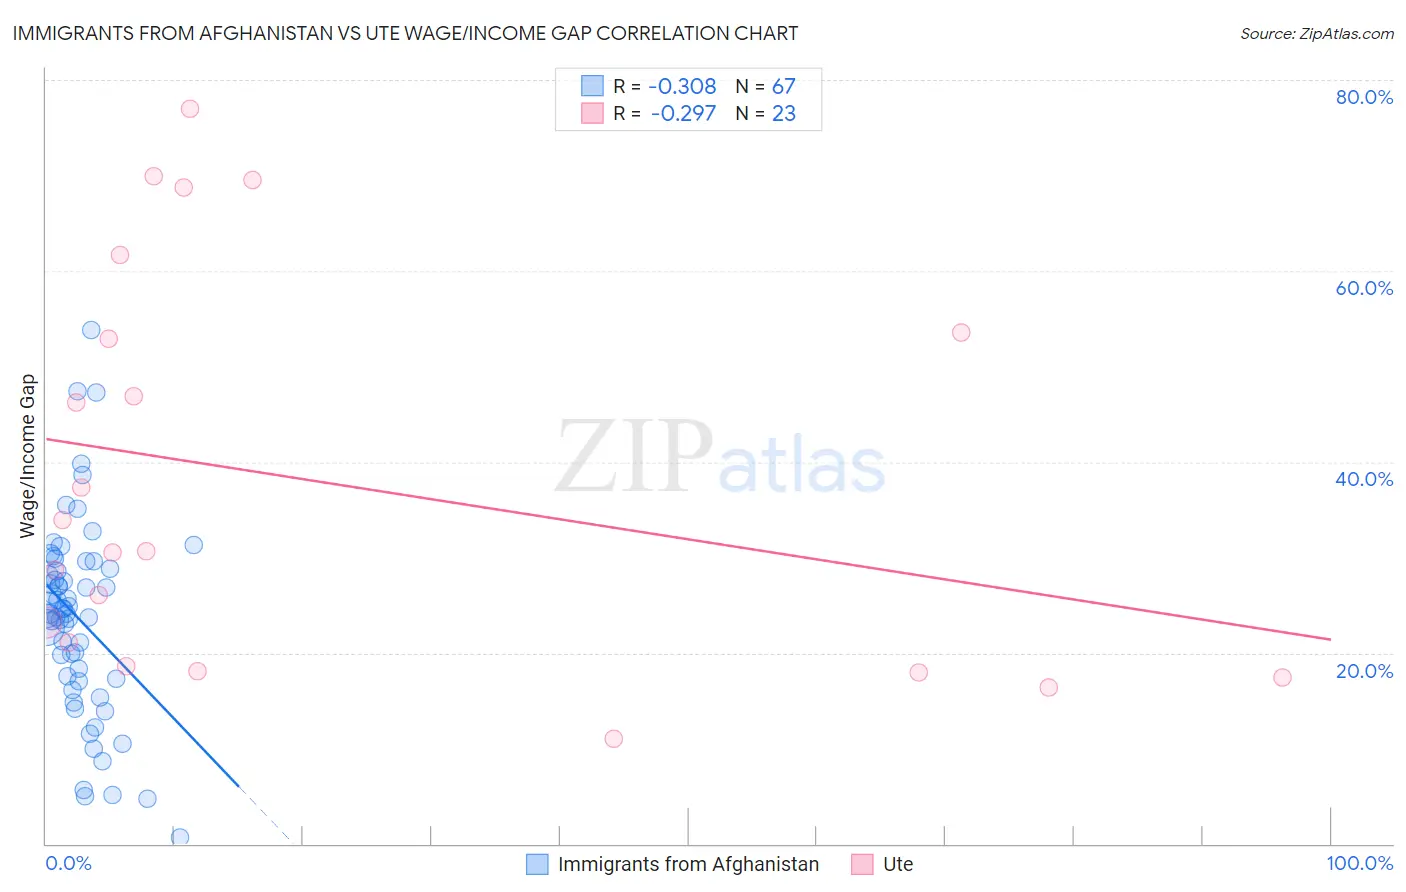
Immigrants from Afghanistan vs Ute Wage/Income Gap Correlation Chart
The statistical analysis conducted on geographies consisting of 147,636,341 people shows a mild negative correlation between the proportion of Immigrants from Afghanistan and wage/income gap percentage in the United States with a correlation coefficient (R) of -0.308 and weighted average of 24.4%. Similarly, the statistical analysis conducted on geographies consisting of 55,649,950 people shows a weak negative correlation between the proportion of Ute and wage/income gap percentage in the United States with a correlation coefficient (R) of -0.297 and weighted average of 27.8%, a difference of 13.6%.
Wage/Income Gap Correlation Summary
| Measurement | Immigrants from Afghanistan | Ute |
| Minimum | 0.66% | 11.0% |
| Maximum | 53.8% | 77.0% |
| Range | 53.1% | 66.0% |
| Mean | 23.6% | 38.1% |
| Median | 24.1% | 30.6% |
| Interquartile 25% (IQ1) | 17.3% | 18.6% |
| Interquartile 75% (IQ3) | 28.8% | 53.5% |
| Interquartile Range (IQR) | 11.5% | 34.9% |
| Standard Deviation (Sample) | 10.1% | 20.6% |
| Standard Deviation (Population) | 10.1% | 20.1% |
Similar Demographics by Wage/Income Gap
Demographics Similar to Immigrants from Afghanistan by Wage/Income Gap
In terms of wage/income gap, the demographic groups most similar to Immigrants from Afghanistan are Immigrants from Micronesia (24.4%, a difference of 0.030%), Kenyan (24.5%, a difference of 0.050%), Alaska Native (24.4%, a difference of 0.060%), Cree (24.5%, a difference of 0.13%), and Immigrants from Kenya (24.4%, a difference of 0.23%).
| Demographics | Rating | Rank | Wage/Income Gap |
| Immigrants | Morocco | 98.1 /100 | #110 | Exceptional 24.1% |
| Soviet Union | 97.6 /100 | #111 | Exceptional 24.2% |
| Immigrants | Colombia | 97.0 /100 | #112 | Exceptional 24.3% |
| Sioux | 96.9 /100 | #113 | Exceptional 24.3% |
| Panamanians | 96.5 /100 | #114 | Exceptional 24.4% |
| Immigrants | Kenya | 96.4 /100 | #115 | Exceptional 24.4% |
| Alaska Natives | 96.0 /100 | #116 | Exceptional 24.4% |
| Immigrants | Afghanistan | 95.9 /100 | #117 | Exceptional 24.4% |
| Immigrants | Micronesia | 95.8 /100 | #118 | Exceptional 24.4% |
| Kenyans | 95.8 /100 | #119 | Exceptional 24.5% |
| Cree | 95.6 /100 | #120 | Exceptional 24.5% |
| Immigrants | Thailand | 94.9 /100 | #121 | Exceptional 24.5% |
| Apache | 94.8 /100 | #122 | Exceptional 24.5% |
| Natives/Alaskans | 94.6 /100 | #123 | Exceptional 24.6% |
| Immigrants | South America | 93.9 /100 | #124 | Exceptional 24.6% |
Demographics Similar to Ute by Wage/Income Gap
In terms of wage/income gap, the demographic groups most similar to Ute are Immigrants from Korea (27.8%, a difference of 0.070%), Immigrants from Western Europe (27.8%, a difference of 0.080%), Bulgarian (27.8%, a difference of 0.18%), Potawatomi (27.7%, a difference of 0.20%), and New Zealander (27.7%, a difference of 0.21%).
| Demographics | Rating | Rank | Wage/Income Gap |
| Immigrants | Switzerland | 1.0 /100 | #264 | Tragic 27.7% |
| Serbians | 1.0 /100 | #265 | Tragic 27.7% |
| Hmong | 1.0 /100 | #266 | Tragic 27.7% |
| Turks | 1.0 /100 | #267 | Tragic 27.7% |
| New Zealanders | 1.0 /100 | #268 | Tragic 27.7% |
| Potawatomi | 0.9 /100 | #269 | Tragic 27.7% |
| Immigrants | Western Europe | 0.9 /100 | #270 | Tragic 27.8% |
| Ute | 0.8 /100 | #271 | Tragic 27.8% |
| Immigrants | Korea | 0.8 /100 | #272 | Tragic 27.8% |
| Bulgarians | 0.7 /100 | #273 | Tragic 27.8% |
| Americans | 0.7 /100 | #274 | Tragic 27.8% |
| Immigrants | Japan | 0.7 /100 | #275 | Tragic 27.9% |
| Lebanese | 0.7 /100 | #276 | Tragic 27.9% |
| Latvians | 0.7 /100 | #277 | Tragic 27.9% |
| Immigrants | England | 0.6 /100 | #278 | Tragic 27.9% |