Cajun vs Immigrants from Oceania 3 or more Vehicles in Household

COMPARE

Cajun
Race
Ancestry
AfghanAfricanAlaska NativeAlaskan AthabascanAlbanianAleutAlsatianAmericanApacheArabArapahoArgentineanArmenianAssyrian/Chaldean/SyriacAustralianAustrianBahamianBangladeshiBarbadianBasqueBelgianBelizeanBermudanBhutaneseBlackfeetBolivianBrazilianBritishBritish West IndianBulgarianBurmeseCajunCambodianCanadianCape VerdeanCarpatho RusynCelticCentral AmericanCentral American IndianCherokeeCheyenneChickasawChileanChineseChippewaChoctawColombianColvilleComancheCosta RicanCreeCreekCroatianCrowCubanCypriotCzechCzechoslovakianDanishDelawareDominicanDutchDutch West IndianEastern EuropeanEcuadorianEgyptianEnglishEstonianEthiopianEuropeanFijianFilipinoFinnishFrenchFrench American IndianFrench CanadianGermanGerman RussianGhanaianGreekGuamanian/ChamorroGuatemalanGuyaneseHaitianHmongHonduranHopiHoumaHungarianIcelanderIndian (Asian)IndonesianInupiatIranianIraqiIrishIroquoisIsraeliItalianJamaicanJapaneseJordanianKenyanKiowaKoreanLaotianLatvianLebaneseLiberianLithuanianLumbeeLuxembourgerMacedonianMalaysianMalteseMarshalleseMenomineeMexicanMexican American IndianMongolianMoroccanNative HawaiianNavajoNepaleseNew ZealanderNicaraguanNigerianNorthern EuropeanNorwegianOkinawanOsageOttawaPaiutePakistaniPalestinianPanamanianParaguayanPennsylvania GermanPeruvianPimaPolishPortuguesePotawatomiPuebloPuerto RicanPuget Sound SalishRomanianRussianSalvadoranSamoanScandinavianScotch-IrishScottishSeminoleSenegaleseSerbianShoshoneSierra LeoneanSiouxSlavicSlovakSloveneSomaliSouth AfricanSouth AmericanSouth American IndianSoviet UnionSpaniardSpanishSpanish AmericanSpanish American IndianSri LankanSubsaharan AfricanSudaneseSwedishSwissSyrianTaiwaneseThaiTlingit-HaidaTohono O'OdhamTonganTrinidadian and TobagonianTsimshianTurkishU.S. Virgin IslanderUgandanUkrainianUruguayanUteVenezuelanVietnameseWelshWest IndianYakamaYaquiYugoslavianYumanYup'ikZimbabwean
Immigration
NonimmigrantsImmigrantsAfghanistanAfricaAlbaniaArgentinaArmeniaAsiaAustraliaAustriaBahamasBangladeshBarbadosBelarusBelgiumBelizeBoliviaBosnia and HerzegovinaBrazilBulgariaBurma/MyanmarCabo VerdeCambodiaCameroonCanadaCaribbeanCentral AmericaChileChinaColombiaCongoCosta RicaCroatiaCubaCzechoslovakiaDenmarkDominicaDominican RepublicEastern AfricaEastern AsiaEastern EuropeEcuadorEgyptEl SalvadorEnglandEritreaEthiopiaEuropeFijiFranceGermanyGhanaGreeceGrenadaGuatemalaGuyanaHaitiHondurasHong KongHungaryIndiaIndonesiaIranIraqIrelandIsraelItalyJamaicaJapanJordanKazakhstanKenyaKoreaKuwaitLaosLatin AmericaLatviaLebanonLiberiaLithuaniaMalaysiaMexicoMicronesiaMiddle AfricaMoldovaMoroccoNepalNetherlandsNicaraguaNigeriaNorth AmericaNorth MacedoniaNorthern AfricaNorthern EuropeNorwayPakistanPanamaPeruPhilippinesPolandPortugalRomaniaRussiaSaudi ArabiaScotlandSenegalSerbiaSierra LeoneSingaporeSomaliaSouth AfricaSouth AmericaSouth Central AsiaSouth Eastern AsiaSouthern EuropeSpainSri LankaSt. Vincent and the GrenadinesSudanSwedenSwitzerlandSyriaTaiwanThailandTrinidad and TobagoTurkeyUgandaUkraineUruguayUzbekistanVenezuelaVietnamWest IndiesWestern AfricaWestern AsiaWestern EuropeYemenZaireZimbabweAzores
Immigrants from Oceania
Race
Ancestry
AfghanAfricanAlaska NativeAlaskan AthabascanAlbanianAleutAlsatianAmericanApacheArabArapahoArgentineanArmenianAssyrian/Chaldean/SyriacAustralianAustrianBahamianBangladeshiBarbadianBasqueBelgianBelizeanBermudanBhutaneseBlackfeetBolivianBrazilianBritishBritish West IndianBulgarianBurmeseCambodianCanadianCape VerdeanCarpatho RusynCelticCentral AmericanCentral American IndianCherokeeCheyenneChickasawChileanChineseChippewaChoctawColombianColvilleComancheCosta RicanCreeCreekCroatianCrowCubanCypriotCzechCzechoslovakianDanishDelawareDominicanDutchDutch West IndianEastern EuropeanEcuadorianEgyptianEnglishEstonianEthiopianEuropeanFijianFilipinoFinnishFrenchFrench American IndianFrench CanadianGermanGerman RussianGhanaianGreekGuamanian/ChamorroGuatemalanGuyaneseHaitianHmongHonduranHopiHoumaHungarianIcelanderIndian (Asian)IndonesianInupiatIranianIraqiIrishIroquoisIsraeliItalianJamaicanJapaneseJordanianKenyanKiowaKoreanLaotianLatvianLebaneseLiberianLithuanianLumbeeLuxembourgerMacedonianMalaysianMalteseMarshalleseMenomineeMexicanMexican American IndianMongolianMoroccanNative HawaiianNavajoNepaleseNew ZealanderNicaraguanNigerianNorthern EuropeanNorwegianOkinawanOsageOttawaPaiutePakistaniPalestinianPanamanianParaguayanPennsylvania GermanPeruvianPimaPolishPortuguesePotawatomiPuebloPuerto RicanPuget Sound SalishRomanianRussianSalvadoranSamoanScandinavianScotch-IrishScottishSeminoleSenegaleseSerbianShoshoneSierra LeoneanSiouxSlavicSlovakSloveneSomaliSouth AfricanSouth AmericanSouth American IndianSoviet UnionSpaniardSpanishSpanish AmericanSpanish American IndianSri LankanSubsaharan AfricanSudaneseSwedishSwissSyrianTaiwaneseThaiTlingit-HaidaTohono O'OdhamTonganTrinidadian and TobagonianTsimshianTurkishU.S. Virgin IslanderUgandanUkrainianUruguayanUteVenezuelanVietnameseWelshWest IndianYakamaYaquiYugoslavianYumanYup'ikZimbabwean
Immigration
NonimmigrantsImmigrantsAfghanistanAfricaAlbaniaArgentinaArmeniaAsiaAustraliaAustriaBahamasBangladeshBarbadosBelarusBelgiumBelizeBoliviaBosnia and HerzegovinaBrazilBulgariaBurma/MyanmarCabo VerdeCambodiaCameroonCanadaCaribbeanCentral AmericaChileChinaColombiaCongoCosta RicaCroatiaCubaCzechoslovakiaDenmarkDominicaDominican RepublicEastern AfricaEastern AsiaEastern EuropeEcuadorEgyptEl SalvadorEnglandEritreaEthiopiaEuropeFijiFranceGermanyGhanaGreeceGrenadaGuatemalaGuyanaHaitiHondurasHong KongHungaryIndiaIndonesiaIranIraqIrelandIsraelItalyJamaicaJapanJordanKazakhstanKenyaKoreaKuwaitLaosLatin AmericaLatviaLebanonLiberiaLithuaniaMalaysiaMexicoMicronesiaMiddle AfricaMoldovaMoroccoNepalNetherlandsNicaraguaNigeriaNorth AmericaNorth MacedoniaNorthern AfricaNorthern EuropeNorwayOceaniaPakistanPanamaPeruPhilippinesPolandPortugalRomaniaRussiaSaudi ArabiaScotlandSenegalSerbiaSierra LeoneSingaporeSomaliaSouth AfricaSouth AmericaSouth Central AsiaSouth Eastern AsiaSouthern EuropeSpainSri LankaSt. Vincent and the GrenadinesSudanSwedenSwitzerlandSyriaTaiwanThailandTrinidad and TobagoTurkeyUgandaUkraineUruguayUzbekistanVenezuelaVietnamWest IndiesWestern AfricaWestern AsiaWestern EuropeYemenZaireZimbabweAzores
3 or more Vehicles in Household
Income
Poverty
Unemployment
Labor Participation
Family Structure
Vehicle Availability
Education Level
Disability

3 or more Vehicles in Household Comparison

Cajuns

Immigrants from Oceania

Fair
Exceptional
19.3%
3 OR MORE VEHICLES IN HOUSEHOLD
36.0/ 100
METRIC RATING
183rd/ 347
METRIC RANK
21.8%
3 OR MORE VEHICLES IN HOUSEHOLD
99.8/ 100
METRIC RATING
74th/ 347
METRIC RANK

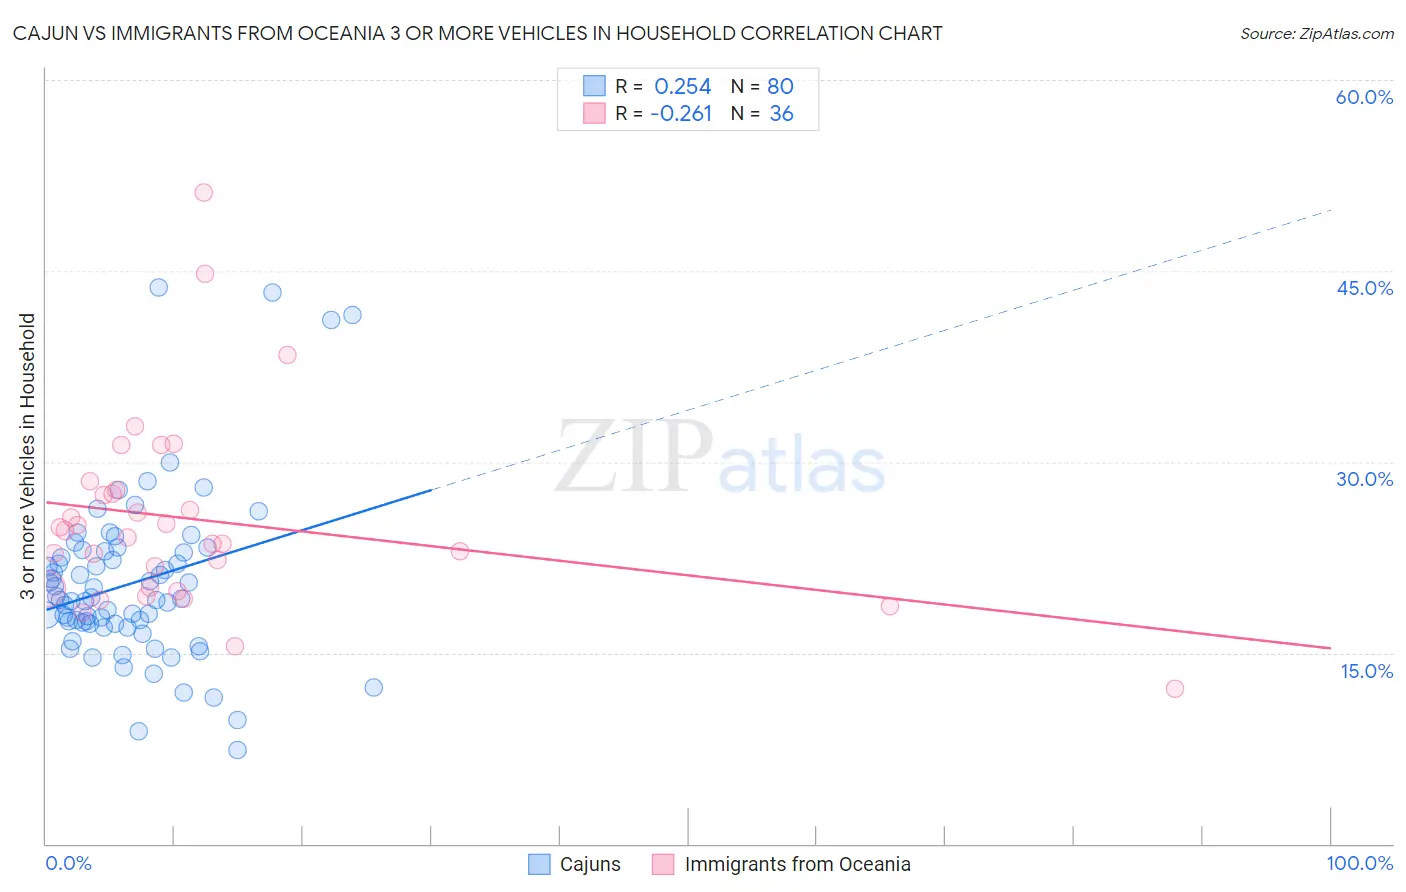
Cajun vs Immigrants from Oceania 3 or more Vehicles in Household Correlation Chart

The statistical analysis conducted on geographies consisting of 149,681,438 people shows a weak positive correlation between the proportion of Cajuns and percentage of households with 3 or more vehicles available in the United States with a correlation coefficient (R) of 0.254 and weighted average of 19.3%. Similarly, the statistical analysis conducted on geographies consisting of 305,272,843 people shows a weak negative correlation between the proportion of Immigrants from Oceania and percentage of households with 3 or more vehicles available in the United States with a correlation coefficient (R) of -0.261 and weighted average of 21.8%, a difference of 13.0%.
Cajun vs Immigrants from Oceania 3 or more Vehicles in Household

3 or more Vehicles in Household Correlation Summary

MeasurementCajunImmigrants from Oceania
Minimum7.4%12.2%
Maximum43.7%51.2%
Range36.2%39.0%
Mean20.5%25.4%
Median19.2%24.3%
Interquartile 25% (IQ1)17.2%20.1%
Interquartile 75% (IQ3)22.9%27.6%
Interquartile Range (IQR)5.7%7.6%
Standard Deviation (Sample)6.7%7.6%
Standard Deviation (Population)6.7%7.5%

Similar Demographics by 3 or more Vehicles in Household

Demographics Similar to Cajuns by 3 or more Vehicles in Household

In terms of 3 or more vehicles in household, the demographic groups most similar to Cajuns are Latvian (19.3%, a difference of 0.020%), Cuban (19.3%, a difference of 0.050%), Romanian (19.3%, a difference of 0.090%), South African (19.3%, a difference of 0.13%), and Immigrants from South Central Asia (19.3%, a difference of 0.24%).
DemographicsRating | Rank3 or more Vehicles in Household
Iroquois
46.0
/100
|
#176
Average
19.4%
Immigrants | Peru
41.1
/100
|
#177
Average
19.4%
Immigrants | Syria
40.3
/100
|
#178
Average
19.4%
Immigrants | South Central Asia
38.9
/100
|
#179
Fair
19.3%
South Africans
37.5
/100
|
#180
Fair
19.3%
Romanians
37.1
/100
|
#181
Fair
19.3%
Cubans
36.6
/100
|
#182
Fair
19.3%
Cajuns
36.0
/100
|
#183
Fair
19.3%
Latvians
35.7
/100
|
#184
Fair
19.3%
Immigrants | Sri Lanka
30.7
/100
|
#185
Fair
19.2%
Immigrants | Sweden
29.0
/100
|
#186
Fair
19.2%
Immigrants | Hong Kong
28.3
/100
|
#187
Fair
19.2%
Immigrants | Kuwait
26.1
/100
|
#188
Fair
19.1%
Indians (Asian)
26.0
/100
|
#189
Fair
19.1%
Immigrants | Zimbabwe
25.5
/100
|
#190
Fair
19.1%

Demographics Similar to Immigrants from Oceania by 3 or more Vehicles in Household

In terms of 3 or more vehicles in household, the demographic groups most similar to Immigrants from Oceania are Salvadoran (21.8%, a difference of 0.020%), Japanese (21.8%, a difference of 0.10%), Portuguese (21.8%, a difference of 0.11%), Nonimmigrants (21.8%, a difference of 0.15%), and Irish (21.8%, a difference of 0.22%).
DemographicsRating | Rank3 or more Vehicles in Household
Alaskan Athabascans
99.9
/100
|
#67
Exceptional
21.9%
British
99.9
/100
|
#68
Exceptional
21.9%
Creek
99.9
/100
|
#69
Exceptional
21.9%
Bangladeshis
99.8
/100
|
#70
Exceptional
21.9%
Potawatomi
99.8
/100
|
#71
Exceptional
21.9%
Portuguese
99.8
/100
|
#72
Exceptional
21.8%
Salvadorans
99.8
/100
|
#73
Exceptional
21.8%
Immigrants | Oceania
99.8
/100
|
#74
Exceptional
21.8%
Japanese
99.8
/100
|
#75
Exceptional
21.8%
Immigrants | Nonimmigrants
99.8
/100
|
#76
Exceptional
21.8%
Irish
99.8
/100
|
#77
Exceptional
21.8%
Czechoslovakians
99.8
/100
|
#78
Exceptional
21.7%
Assyrians/Chaldeans/Syriacs
99.8
/100
|
#79
Exceptional
21.7%
Afghans
99.7
/100
|
#80
Exceptional
21.7%
Celtics
99.7
/100
|
#81
Exceptional
21.7%