Guatemalan vs Somali 3 or more Vehicles in Household

COMPARE

Guatemalan
Race
Ancestry
AfghanAfricanAlaska NativeAlaskan AthabascanAlbanianAleutAlsatianAmericanApacheArabArapahoArgentineanArmenianAssyrian/Chaldean/SyriacAustralianAustrianBahamianBangladeshiBarbadianBasqueBelgianBelizeanBermudanBhutaneseBlackfeetBolivianBrazilianBritishBritish West IndianBulgarianBurmeseCajunCambodianCanadianCape VerdeanCarpatho RusynCelticCentral AmericanCentral American IndianCherokeeCheyenneChickasawChileanChineseChippewaChoctawColombianColvilleComancheCosta RicanCreeCreekCroatianCrowCubanCypriotCzechCzechoslovakianDanishDelawareDominicanDutchDutch West IndianEastern EuropeanEcuadorianEgyptianEnglishEstonianEthiopianEuropeanFijianFilipinoFinnishFrenchFrench American IndianFrench CanadianGermanGerman RussianGhanaianGreekGuamanian/ChamorroGuatemalanGuyaneseHaitianHmongHonduranHopiHoumaHungarianIcelanderIndian (Asian)IndonesianInupiatIranianIraqiIrishIroquoisIsraeliItalianJamaicanJapaneseJordanianKenyanKiowaKoreanLaotianLatvianLebaneseLiberianLithuanianLumbeeLuxembourgerMacedonianMalaysianMalteseMarshalleseMenomineeMexicanMexican American IndianMongolianMoroccanNative HawaiianNavajoNepaleseNew ZealanderNicaraguanNigerianNorthern EuropeanNorwegianOkinawanOsageOttawaPaiutePakistaniPalestinianPanamanianParaguayanPennsylvania GermanPeruvianPimaPolishPortuguesePotawatomiPuebloPuerto RicanPuget Sound SalishRomanianRussianSalvadoranSamoanScandinavianScotch-IrishScottishSeminoleSenegaleseSerbianShoshoneSierra LeoneanSiouxSlavicSlovakSloveneSouth AfricanSouth AmericanSouth American IndianSoviet UnionSpaniardSpanishSpanish AmericanSpanish American IndianSri LankanSubsaharan AfricanSudaneseSwedishSwissSyrianTaiwaneseThaiTlingit-HaidaTohono O'OdhamTonganTrinidadian and TobagonianTsimshianTurkishU.S. Virgin IslanderUgandanUkrainianUruguayanUteVenezuelanVietnameseWelshWest IndianYakamaYaquiYugoslavianYumanYup'ikZimbabwean
Immigration
NonimmigrantsImmigrantsAfghanistanAfricaAlbaniaArgentinaArmeniaAsiaAustraliaAustriaBahamasBangladeshBarbadosBelarusBelgiumBelizeBoliviaBosnia and HerzegovinaBrazilBulgariaBurma/MyanmarCabo VerdeCambodiaCameroonCanadaCaribbeanCentral AmericaChileChinaColombiaCongoCosta RicaCroatiaCubaCzechoslovakiaDenmarkDominicaDominican RepublicEastern AfricaEastern AsiaEastern EuropeEcuadorEgyptEl SalvadorEnglandEritreaEthiopiaEuropeFijiFranceGermanyGhanaGreeceGrenadaGuatemalaGuyanaHaitiHondurasHong KongHungaryIndiaIndonesiaIranIraqIrelandIsraelItalyJamaicaJapanJordanKazakhstanKenyaKoreaKuwaitLaosLatin AmericaLatviaLebanonLiberiaLithuaniaMalaysiaMexicoMicronesiaMiddle AfricaMoldovaMoroccoNepalNetherlandsNicaraguaNigeriaNorth AmericaNorth MacedoniaNorthern AfricaNorthern EuropeNorwayOceaniaPakistanPanamaPeruPhilippinesPolandPortugalRomaniaRussiaSaudi ArabiaScotlandSenegalSerbiaSierra LeoneSingaporeSomaliaSouth AfricaSouth AmericaSouth Central AsiaSouth Eastern AsiaSouthern EuropeSpainSri LankaSt. Vincent and the GrenadinesSudanSwedenSwitzerlandSyriaTaiwanThailandTrinidad and TobagoTurkeyUgandaUkraineUruguayUzbekistanVenezuelaVietnamWest IndiesWestern AfricaWestern AsiaWestern EuropeYemenZaireZimbabweAzores
Somali
Race
Ancestry
AfghanAfricanAlaska NativeAlaskan AthabascanAlbanianAleutAlsatianAmericanApacheArabArapahoArgentineanArmenianAssyrian/Chaldean/SyriacAustralianAustrianBahamianBangladeshiBarbadianBasqueBelgianBelizeanBermudanBhutaneseBlackfeetBolivianBrazilianBritishBritish West IndianBulgarianBurmeseCajunCambodianCanadianCape VerdeanCarpatho RusynCelticCentral AmericanCentral American IndianCherokeeCheyenneChickasawChileanChineseChippewaChoctawColombianColvilleComancheCosta RicanCreeCreekCroatianCrowCubanCypriotCzechCzechoslovakianDanishDelawareDominicanDutchDutch West IndianEastern EuropeanEcuadorianEgyptianEnglishEstonianEthiopianEuropeanFijianFilipinoFinnishFrenchFrench American IndianFrench CanadianGermanGerman RussianGhanaianGreekGuamanian/ChamorroGuyaneseHaitianHmongHonduranHopiHoumaHungarianIcelanderIndian (Asian)IndonesianInupiatIranianIraqiIrishIroquoisIsraeliItalianJamaicanJapaneseJordanianKenyanKiowaKoreanLaotianLatvianLebaneseLiberianLithuanianLumbeeLuxembourgerMacedonianMalaysianMalteseMarshalleseMenomineeMexicanMexican American IndianMongolianMoroccanNative HawaiianNavajoNepaleseNew ZealanderNicaraguanNigerianNorthern EuropeanNorwegianOkinawanOsageOttawaPaiutePakistaniPalestinianPanamanianParaguayanPennsylvania GermanPeruvianPimaPolishPortuguesePotawatomiPuebloPuerto RicanPuget Sound SalishRomanianRussianSalvadoranSamoanScandinavianScotch-IrishScottishSeminoleSenegaleseSerbianShoshoneSierra LeoneanSiouxSlavicSlovakSloveneSomaliSouth AfricanSouth AmericanSouth American IndianSoviet UnionSpaniardSpanishSpanish AmericanSpanish American IndianSri LankanSubsaharan AfricanSudaneseSwedishSwissSyrianTaiwaneseThaiTlingit-HaidaTohono O'OdhamTonganTrinidadian and TobagonianTsimshianTurkishU.S. Virgin IslanderUgandanUkrainianUruguayanUteVenezuelanVietnameseWelshWest IndianYakamaYaquiYugoslavianYumanYup'ikZimbabwean
Immigration
NonimmigrantsImmigrantsAfghanistanAfricaAlbaniaArgentinaArmeniaAsiaAustraliaAustriaBahamasBangladeshBarbadosBelarusBelgiumBelizeBoliviaBosnia and HerzegovinaBrazilBulgariaBurma/MyanmarCabo VerdeCambodiaCameroonCanadaCaribbeanCentral AmericaChileChinaColombiaCongoCosta RicaCroatiaCubaCzechoslovakiaDenmarkDominicaDominican RepublicEastern AfricaEastern AsiaEastern EuropeEcuadorEgyptEl SalvadorEnglandEritreaEthiopiaEuropeFijiFranceGermanyGhanaGreeceGrenadaGuatemalaGuyanaHaitiHondurasHong KongHungaryIndiaIndonesiaIranIraqIrelandIsraelItalyJamaicaJapanJordanKazakhstanKenyaKoreaKuwaitLaosLatin AmericaLatviaLebanonLiberiaLithuaniaMalaysiaMexicoMicronesiaMiddle AfricaMoldovaMoroccoNepalNetherlandsNicaraguaNigeriaNorth AmericaNorth MacedoniaNorthern AfricaNorthern EuropeNorwayOceaniaPakistanPanamaPeruPhilippinesPolandPortugalRomaniaRussiaSaudi ArabiaScotlandSenegalSerbiaSierra LeoneSingaporeSomaliaSouth AfricaSouth AmericaSouth Central AsiaSouth Eastern AsiaSouthern EuropeSpainSri LankaSt. Vincent and the GrenadinesSudanSwedenSwitzerlandSyriaTaiwanThailandTrinidad and TobagoTurkeyUgandaUkraineUruguayUzbekistanVenezuelaVietnamWest IndiesWestern AfricaWestern AsiaWestern EuropeYemenZaireZimbabweAzores
3 or more Vehicles in Household
Income
Poverty
Unemployment
Labor Participation
Family Structure
Vehicle Availability
Education Level
Disability

3 or more Vehicles in Household Comparison

Guatemalans

Somalis

Excellent
Tragic
20.1%
3 OR MORE VEHICLES IN HOUSEHOLD
82.6/ 100
METRIC RATING
148th/ 347
METRIC RANK
16.2%
3 OR MORE VEHICLES IN HOUSEHOLD
0.0/ 100
METRIC RATING
306th/ 347
METRIC RANK

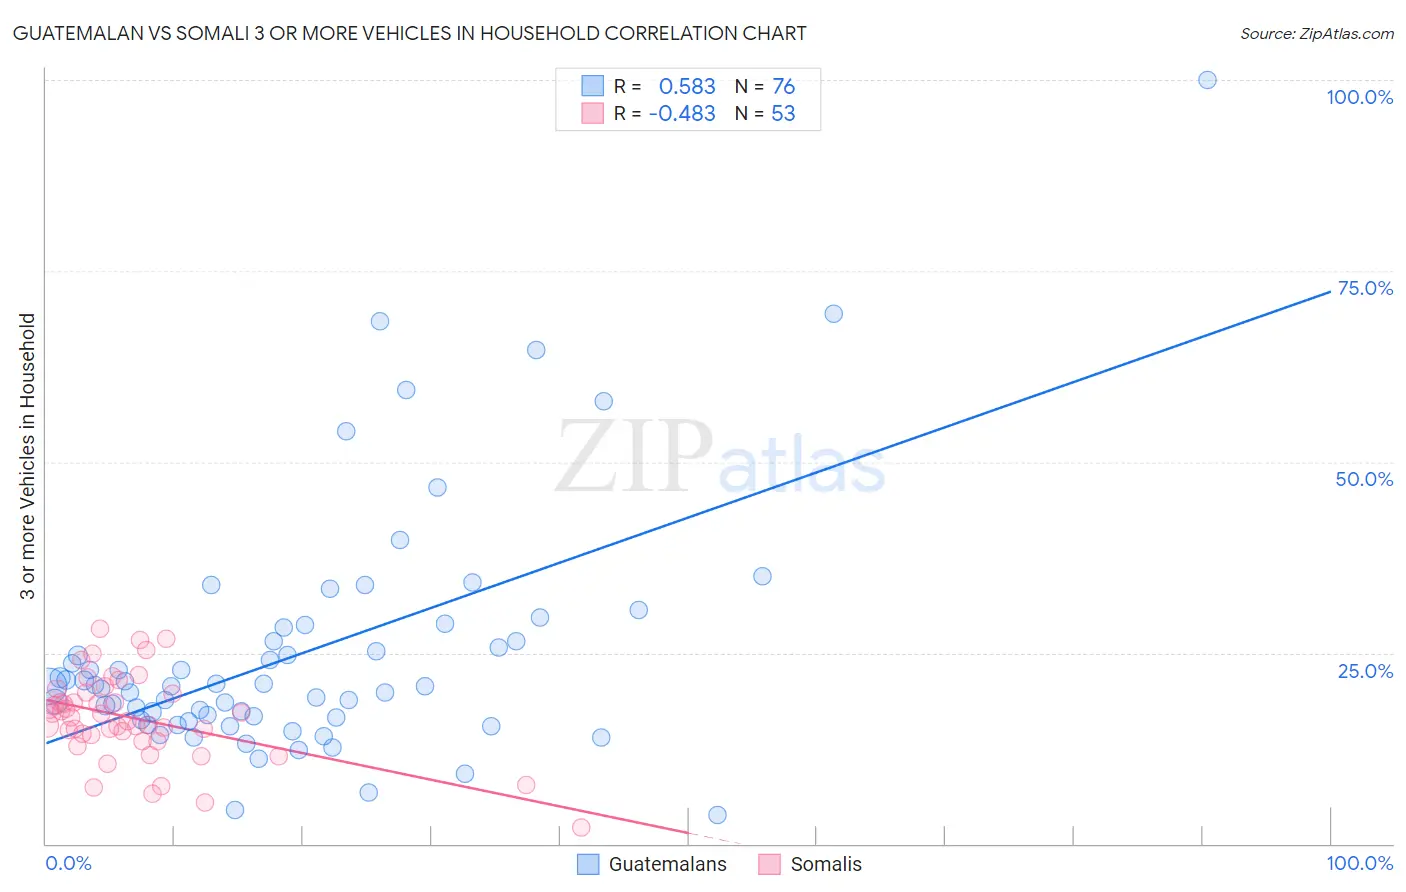
Guatemalan vs Somali 3 or more Vehicles in Household Correlation Chart

The statistical analysis conducted on geographies consisting of 409,244,641 people shows a substantial positive correlation between the proportion of Guatemalans and percentage of households with 3 or more vehicles available in the United States with a correlation coefficient (R) of 0.583 and weighted average of 20.1%. Similarly, the statistical analysis conducted on geographies consisting of 99,282,686 people shows a moderate negative correlation between the proportion of Somalis and percentage of households with 3 or more vehicles available in the United States with a correlation coefficient (R) of -0.483 and weighted average of 16.2%, a difference of 24.0%.
Guatemalan vs Somali 3 or more Vehicles in Household

3 or more Vehicles in Household Correlation Summary

MeasurementGuatemalanSomali
Minimum3.8%2.2%
Maximum100.0%28.2%
Range96.2%26.0%
Mean25.1%16.5%
Median20.6%16.5%
Interquartile 25% (IQ1)16.3%13.9%
Interquartile 75% (IQ3)27.4%19.8%
Interquartile Range (IQR)11.1%5.9%
Standard Deviation (Sample)16.1%5.5%
Standard Deviation (Population)16.0%5.5%

Similar Demographics by 3 or more Vehicles in Household

Demographics Similar to Guatemalans by 3 or more Vehicles in Household

In terms of 3 or more vehicles in household, the demographic groups most similar to Guatemalans are Slovak (20.1%, a difference of 0.060%), Australian (20.1%, a difference of 0.14%), Palestinian (20.1%, a difference of 0.18%), Iranian (20.1%, a difference of 0.19%), and Immigrants from Iran (20.0%, a difference of 0.20%).
DemographicsRating | Rank3 or more Vehicles in Household
Ottawa
84.9
/100
|
#141
Excellent
20.1%
Jordanians
84.4
/100
|
#142
Excellent
20.1%
Lithuanians
84.4
/100
|
#143
Excellent
20.1%
Iranians
84.0
/100
|
#144
Excellent
20.1%
Palestinians
83.9
/100
|
#145
Excellent
20.1%
Australians
83.6
/100
|
#146
Excellent
20.1%
Slovaks
83.0
/100
|
#147
Excellent
20.1%
Guatemalans
82.6
/100
|
#148
Excellent
20.1%
Immigrants | Iran
80.9
/100
|
#149
Excellent
20.0%
Immigrants | Immigrants
80.8
/100
|
#150
Excellent
20.0%
Taiwanese
80.6
/100
|
#151
Excellent
20.0%
Lebanese
79.8
/100
|
#152
Good
20.0%
Yuman
75.6
/100
|
#153
Good
19.9%
Immigrants | Jordan
75.0
/100
|
#154
Good
19.9%
Tlingit-Haida
73.4
/100
|
#155
Good
19.9%

Demographics Similar to Somalis by 3 or more Vehicles in Household

In terms of 3 or more vehicles in household, the demographic groups most similar to Somalis are Immigrants from Ghana (16.2%, a difference of 0.15%), Houma (16.1%, a difference of 0.74%), Immigrants from Morocco (16.3%, a difference of 0.82%), Ghanaian (16.4%, a difference of 1.1%), and Immigrants from Serbia (16.4%, a difference of 1.6%).
DemographicsRating | Rank3 or more Vehicles in Household
Immigrants | South America
0.1
/100
|
#299
Tragic
16.7%
Cypriots
0.0
/100
|
#300
Tragic
16.6%
Paraguayans
0.0
/100
|
#301
Tragic
16.6%
Immigrants | Greece
0.0
/100
|
#302
Tragic
16.5%
Immigrants | Serbia
0.0
/100
|
#303
Tragic
16.4%
Ghanaians
0.0
/100
|
#304
Tragic
16.4%
Immigrants | Morocco
0.0
/100
|
#305
Tragic
16.3%
Somalis
0.0
/100
|
#306
Tragic
16.2%
Immigrants | Ghana
0.0
/100
|
#307
Tragic
16.2%
Houma
0.0
/100
|
#308
Tragic
16.1%
Immigrants | Somalia
0.0
/100
|
#309
Tragic
15.9%
Moroccans
0.0
/100
|
#310
Tragic
15.9%
Albanians
0.0
/100
|
#311
Tragic
15.8%
Puerto Ricans
0.0
/100
|
#312
Tragic
15.6%
Immigrants | Israel
0.0
/100
|
#313
Tragic
15.6%