Creek vs Immigrants from Chile 3 or more Vehicles in Household

COMPARE

Creek
Race
Ancestry
AfghanAfricanAlaska NativeAlaskan AthabascanAlbanianAleutAlsatianAmericanApacheArabArapahoArgentineanArmenianAssyrian/Chaldean/SyriacAustralianAustrianBahamianBangladeshiBarbadianBasqueBelgianBelizeanBermudanBhutaneseBlackfeetBolivianBrazilianBritishBritish West IndianBulgarianBurmeseCajunCambodianCanadianCape VerdeanCarpatho RusynCelticCentral AmericanCentral American IndianCherokeeCheyenneChickasawChileanChineseChippewaChoctawColombianColvilleComancheCosta RicanCreeCreekCroatianCrowCubanCypriotCzechCzechoslovakianDanishDelawareDominicanDutchDutch West IndianEastern EuropeanEcuadorianEgyptianEnglishEstonianEthiopianEuropeanFijianFilipinoFinnishFrenchFrench American IndianFrench CanadianGermanGerman RussianGhanaianGreekGuamanian/ChamorroGuatemalanGuyaneseHaitianHmongHonduranHopiHoumaHungarianIcelanderIndian (Asian)IndonesianInupiatIranianIraqiIrishIroquoisIsraeliItalianJamaicanJapaneseJordanianKenyanKiowaKoreanLaotianLatvianLebaneseLiberianLithuanianLumbeeLuxembourgerMacedonianMalaysianMalteseMarshalleseMenomineeMexicanMexican American IndianMongolianMoroccanNative HawaiianNavajoNepaleseNew ZealanderNicaraguanNigerianNorthern EuropeanNorwegianOkinawanOsageOttawaPaiutePakistaniPalestinianPanamanianParaguayanPennsylvania GermanPeruvianPimaPolishPortuguesePotawatomiPuebloPuerto RicanPuget Sound SalishRomanianRussianSalvadoranSamoanScandinavianScotch-IrishScottishSeminoleSenegaleseSerbianShoshoneSierra LeoneanSiouxSlavicSlovakSloveneSomaliSouth AfricanSouth AmericanSouth American IndianSoviet UnionSpaniardSpanishSpanish AmericanSpanish American IndianSri LankanSubsaharan AfricanSudaneseSwedishSwissSyrianTaiwaneseThaiTlingit-HaidaTohono O'OdhamTonganTrinidadian and TobagonianTsimshianTurkishU.S. Virgin IslanderUgandanUkrainianUruguayanUteVenezuelanVietnameseWelshWest IndianYakamaYaquiYugoslavianYumanYup'ikZimbabwean
Immigration
NonimmigrantsImmigrantsAfghanistanAfricaAlbaniaArgentinaArmeniaAsiaAustraliaAustriaBahamasBangladeshBarbadosBelarusBelgiumBelizeBoliviaBosnia and HerzegovinaBrazilBulgariaBurma/MyanmarCabo VerdeCambodiaCameroonCanadaCaribbeanCentral AmericaChinaColombiaCongoCosta RicaCroatiaCubaCzechoslovakiaDenmarkDominicaDominican RepublicEastern AfricaEastern AsiaEastern EuropeEcuadorEgyptEl SalvadorEnglandEritreaEthiopiaEuropeFijiFranceGermanyGhanaGreeceGrenadaGuatemalaGuyanaHaitiHondurasHong KongHungaryIndiaIndonesiaIranIraqIrelandIsraelItalyJamaicaJapanJordanKazakhstanKenyaKoreaKuwaitLaosLatin AmericaLatviaLebanonLiberiaLithuaniaMalaysiaMexicoMicronesiaMiddle AfricaMoldovaMoroccoNepalNetherlandsNicaraguaNigeriaNorth AmericaNorth MacedoniaNorthern AfricaNorthern EuropeNorwayOceaniaPakistanPanamaPeruPhilippinesPolandPortugalRomaniaRussiaSaudi ArabiaScotlandSenegalSerbiaSierra LeoneSingaporeSomaliaSouth AfricaSouth AmericaSouth Central AsiaSouth Eastern AsiaSouthern EuropeSpainSri LankaSt. Vincent and the GrenadinesSudanSwedenSwitzerlandSyriaTaiwanThailandTrinidad and TobagoTurkeyUgandaUkraineUruguayUzbekistanVenezuelaVietnamWest IndiesWestern AfricaWestern AsiaWestern EuropeYemenZaireZimbabweAzores
Immigrants from Chile
Race
Ancestry
AfghanAfricanAlaska NativeAlaskan AthabascanAlbanianAleutAlsatianAmericanApacheArabArapahoArgentineanArmenianAssyrian/Chaldean/SyriacAustralianAustrianBahamianBangladeshiBarbadianBasqueBelgianBelizeanBermudanBhutaneseBlackfeetBolivianBrazilianBritishBritish West IndianBulgarianBurmeseCajunCambodianCanadianCape VerdeanCarpatho RusynCelticCentral AmericanCentral American IndianCherokeeCheyenneChickasawChileanChineseChippewaChoctawColombianColvilleComancheCosta RicanCreeCroatianCrowCubanCypriotCzechCzechoslovakianDanishDelawareDominicanDutchDutch West IndianEastern EuropeanEcuadorianEgyptianEnglishEstonianEthiopianEuropeanFijianFilipinoFinnishFrenchFrench American IndianFrench CanadianGermanGerman RussianGhanaianGreekGuamanian/ChamorroGuatemalanGuyaneseHaitianHmongHonduranHopiHoumaHungarianIcelanderIndian (Asian)IndonesianInupiatIranianIraqiIrishIroquoisIsraeliItalianJamaicanJapaneseJordanianKenyanKiowaKoreanLaotianLatvianLebaneseLiberianLithuanianLumbeeLuxembourgerMacedonianMalaysianMalteseMarshalleseMenomineeMexicanMexican American IndianMongolianMoroccanNative HawaiianNavajoNepaleseNew ZealanderNicaraguanNigerianNorthern EuropeanNorwegianOkinawanOsageOttawaPaiutePakistaniPalestinianPanamanianParaguayanPennsylvania GermanPeruvianPimaPolishPortuguesePotawatomiPuebloPuerto RicanPuget Sound SalishRomanianRussianSalvadoranSamoanScandinavianScotch-IrishScottishSeminoleSenegaleseSerbianShoshoneSierra LeoneanSiouxSlavicSlovakSloveneSomaliSouth AfricanSouth AmericanSouth American IndianSoviet UnionSpaniardSpanishSpanish AmericanSpanish American IndianSri LankanSubsaharan AfricanSudaneseSwedishSwissSyrianTaiwaneseThaiTlingit-HaidaTohono O'OdhamTonganTrinidadian and TobagonianTsimshianTurkishU.S. Virgin IslanderUgandanUkrainianUruguayanUteVenezuelanVietnameseWelshWest IndianYakamaYaquiYugoslavianYumanYup'ikZimbabwean
Immigration
NonimmigrantsImmigrantsAfghanistanAfricaAlbaniaArgentinaArmeniaAsiaAustraliaAustriaBahamasBangladeshBarbadosBelarusBelgiumBelizeBoliviaBosnia and HerzegovinaBrazilBulgariaBurma/MyanmarCabo VerdeCambodiaCameroonCanadaCaribbeanCentral AmericaChileChinaColombiaCongoCosta RicaCroatiaCubaCzechoslovakiaDenmarkDominicaDominican RepublicEastern AfricaEastern AsiaEastern EuropeEcuadorEgyptEl SalvadorEnglandEritreaEthiopiaEuropeFijiFranceGermanyGhanaGreeceGrenadaGuatemalaGuyanaHaitiHondurasHong KongHungaryIndiaIndonesiaIranIraqIrelandIsraelItalyJamaicaJapanJordanKazakhstanKenyaKoreaKuwaitLaosLatin AmericaLatviaLebanonLiberiaLithuaniaMalaysiaMexicoMicronesiaMiddle AfricaMoldovaMoroccoNepalNetherlandsNicaraguaNigeriaNorth AmericaNorth MacedoniaNorthern AfricaNorthern EuropeNorwayOceaniaPakistanPanamaPeruPhilippinesPolandPortugalRomaniaRussiaSaudi ArabiaScotlandSenegalSerbiaSierra LeoneSingaporeSomaliaSouth AfricaSouth AmericaSouth Central AsiaSouth Eastern AsiaSouthern EuropeSpainSri LankaSt. Vincent and the GrenadinesSudanSwedenSwitzerlandSyriaTaiwanThailandTrinidad and TobagoTurkeyUgandaUkraineUruguayUzbekistanVenezuelaVietnamWest IndiesWestern AfricaWestern AsiaWestern EuropeYemenZaireZimbabweAzores
3 or more Vehicles in Household
Income
Poverty
Unemployment
Labor Participation
Family Structure
Vehicle Availability
Education Level
Disability

3 or more Vehicles in Household Comparison

Creek

Immigrants from Chile

Exceptional
Poor
21.9%
3 OR MORE VEHICLES IN HOUSEHOLD
99.9/ 100
METRIC RATING
69th/ 347
METRIC RANK
18.8%
3 OR MORE VEHICLES IN HOUSEHOLD
13.6/ 100
METRIC RATING
207th/ 347
METRIC RANK

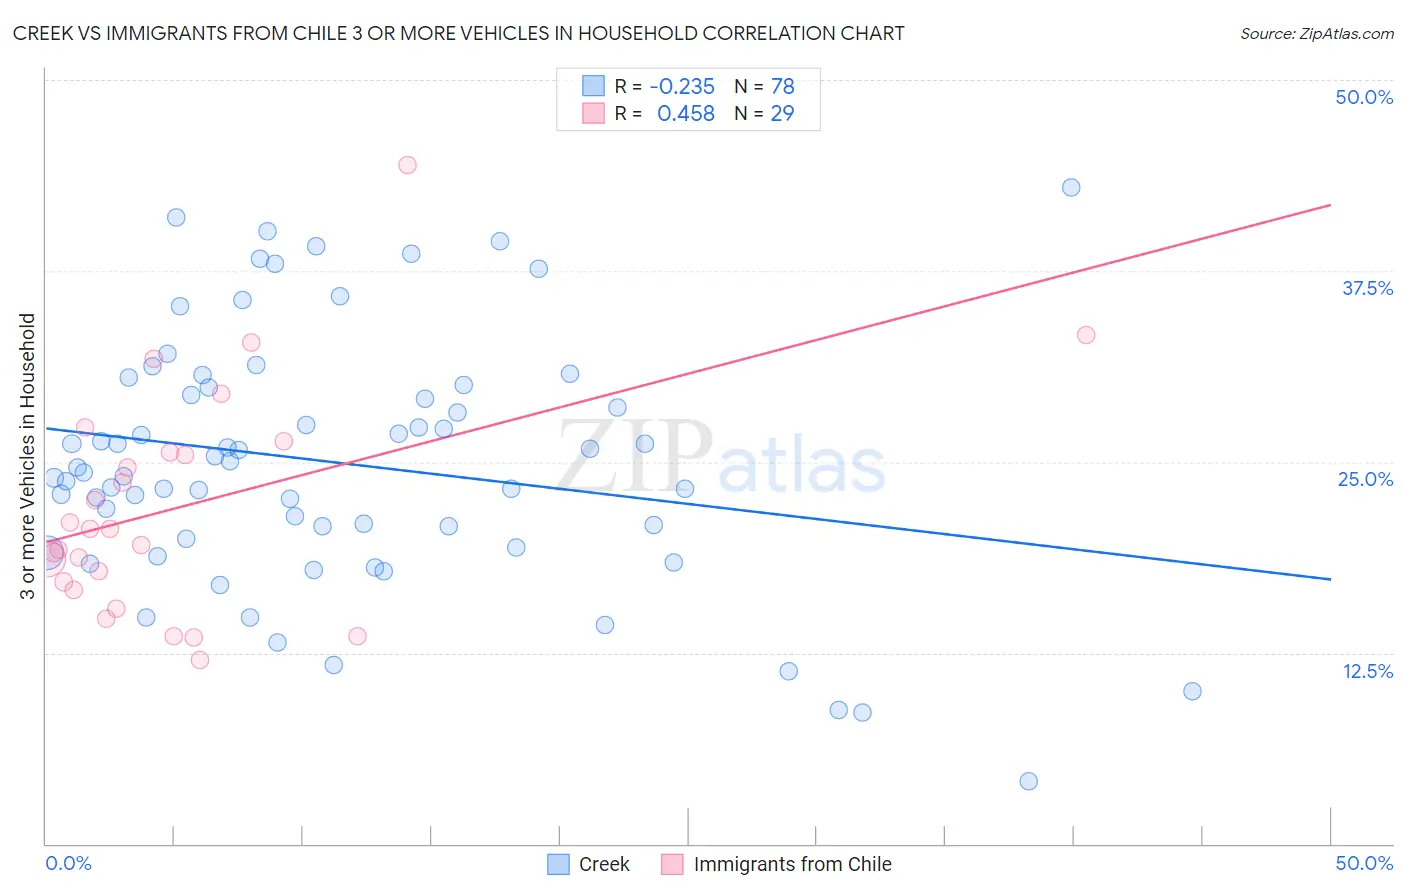
Creek vs Immigrants from Chile 3 or more Vehicles in Household Correlation Chart

The statistical analysis conducted on geographies consisting of 178,435,403 people shows a weak negative correlation between the proportion of Creek and percentage of households with 3 or more vehicles available in the United States with a correlation coefficient (R) of -0.235 and weighted average of 21.9%. Similarly, the statistical analysis conducted on geographies consisting of 218,586,627 people shows a moderate positive correlation between the proportion of Immigrants from Chile and percentage of households with 3 or more vehicles available in the United States with a correlation coefficient (R) of 0.458 and weighted average of 18.8%, a difference of 16.4%.
Creek vs Immigrants from Chile 3 or more Vehicles in Household

3 or more Vehicles in Household Correlation Summary

MeasurementCreekImmigrants from Chile
Minimum4.1%12.0%
Maximum43.0%44.4%
Range38.9%32.4%
Mean24.9%22.0%
Median24.5%20.6%
Interquartile 25% (IQ1)20.0%16.9%
Interquartile 75% (IQ3)29.9%26.0%
Interquartile Range (IQR)9.9%9.1%
Standard Deviation (Sample)8.2%7.3%
Standard Deviation (Population)8.2%7.2%

Similar Demographics by 3 or more Vehicles in Household

Demographics Similar to Creek by 3 or more Vehicles in Household

In terms of 3 or more vehicles in household, the demographic groups most similar to Creek are British (21.9%, a difference of 0.030%), Alaskan Athabascan (21.9%, a difference of 0.18%), Bangladeshi (21.9%, a difference of 0.19%), Potawatomi (21.9%, a difference of 0.20%), and Portuguese (21.8%, a difference of 0.38%).
DemographicsRating | Rank3 or more Vehicles in Household
Fijians
99.9
/100
|
#62
Exceptional
22.2%
Chickasaw
99.9
/100
|
#63
Exceptional
22.2%
Immigrants | Taiwan
99.9
/100
|
#64
Exceptional
22.1%
Pima
99.9
/100
|
#65
Exceptional
22.0%
Northern Europeans
99.9
/100
|
#66
Exceptional
22.0%
Alaskan Athabascans
99.9
/100
|
#67
Exceptional
21.9%
British
99.9
/100
|
#68
Exceptional
21.9%
Creek
99.9
/100
|
#69
Exceptional
21.9%
Bangladeshis
99.8
/100
|
#70
Exceptional
21.9%
Potawatomi
99.8
/100
|
#71
Exceptional
21.9%
Portuguese
99.8
/100
|
#72
Exceptional
21.8%
Salvadorans
99.8
/100
|
#73
Exceptional
21.8%
Immigrants | Oceania
99.8
/100
|
#74
Exceptional
21.8%
Japanese
99.8
/100
|
#75
Exceptional
21.8%
Immigrants | Nonimmigrants
99.8
/100
|
#76
Exceptional
21.8%

Demographics Similar to Immigrants from Chile by 3 or more Vehicles in Household

In terms of 3 or more vehicles in household, the demographic groups most similar to Immigrants from Chile are Immigrants from Burma/Myanmar (18.8%, a difference of 0.010%), Immigrants from Egypt (18.8%, a difference of 0.020%), Immigrants from Eastern Asia (18.8%, a difference of 0.080%), Russian (18.8%, a difference of 0.090%), and Bulgarian (18.8%, a difference of 0.10%).
DemographicsRating | Rank3 or more Vehicles in Household
Argentineans
18.2
/100
|
#200
Poor
18.9%
Arabs
17.7
/100
|
#201
Poor
18.9%
Immigrants | Austria
15.4
/100
|
#202
Poor
18.9%
Tohono O'odham
14.8
/100
|
#203
Poor
18.9%
Immigrants | Romania
14.6
/100
|
#204
Poor
18.9%
Russians
14.2
/100
|
#205
Poor
18.8%
Immigrants | Eastern Asia
14.1
/100
|
#206
Poor
18.8%
Immigrants | Chile
13.6
/100
|
#207
Poor
18.8%
Immigrants | Burma/Myanmar
13.6
/100
|
#208
Poor
18.8%
Immigrants | Egypt
13.5
/100
|
#209
Poor
18.8%
Bulgarians
13.1
/100
|
#210
Poor
18.8%
Immigrants | Kenya
12.4
/100
|
#211
Poor
18.8%
Panamanians
11.6
/100
|
#212
Poor
18.8%
Immigrants | Cuba
11.6
/100
|
#213
Poor
18.8%
Immigrants | Sierra Leone
10.8
/100
|
#214
Poor
18.7%