Blackfeet vs Navajo 2 or more Vehicles in Household

COMPARE

Blackfeet
Race
Ancestry
AfghanAfricanAlaska NativeAlaskan AthabascanAlbanianAleutAlsatianAmericanApacheArabArapahoArgentineanArmenianAssyrian/Chaldean/SyriacAustralianAustrianBahamianBangladeshiBarbadianBasqueBelgianBelizeanBermudanBhutaneseBlackfeetBolivianBrazilianBritishBritish West IndianBulgarianBurmeseCajunCambodianCanadianCape VerdeanCarpatho RusynCelticCentral AmericanCentral American IndianCherokeeCheyenneChickasawChileanChineseChippewaChoctawColombianColvilleComancheCosta RicanCreeCreekCroatianCrowCubanCypriotCzechCzechoslovakianDanishDelawareDominicanDutchDutch West IndianEastern EuropeanEcuadorianEgyptianEnglishEstonianEthiopianEuropeanFijianFilipinoFinnishFrenchFrench American IndianFrench CanadianGermanGerman RussianGhanaianGreekGuamanian/ChamorroGuatemalanGuyaneseHaitianHmongHonduranHopiHoumaHungarianIcelanderIndian (Asian)IndonesianInupiatIranianIraqiIrishIroquoisIsraeliItalianJamaicanJapaneseJordanianKenyanKiowaKoreanLaotianLatvianLebaneseLiberianLithuanianLumbeeLuxembourgerMacedonianMalaysianMalteseMarshalleseMenomineeMexicanMexican American IndianMongolianMoroccanNative HawaiianNepaleseNew ZealanderNicaraguanNigerianNorthern EuropeanNorwegianOkinawanOsageOttawaPaiutePakistaniPalestinianPanamanianParaguayanPennsylvania GermanPeruvianPimaPolishPortuguesePotawatomiPuebloPuerto RicanPuget Sound SalishRomanianRussianSalvadoranSamoanScandinavianScotch-IrishScottishSeminoleSenegaleseSerbianShoshoneSierra LeoneanSiouxSlavicSlovakSloveneSomaliSouth AfricanSouth AmericanSouth American IndianSoviet UnionSpaniardSpanishSpanish AmericanSpanish American IndianSri LankanSubsaharan AfricanSudaneseSwedishSwissSyrianTaiwaneseThaiTlingit-HaidaTohono O'OdhamTonganTrinidadian and TobagonianTsimshianTurkishU.S. Virgin IslanderUgandanUkrainianUruguayanUteVenezuelanVietnameseWelshWest IndianYakamaYaquiYugoslavianYumanYup'ikZimbabwean
Immigration
NonimmigrantsImmigrantsAfghanistanAfricaAlbaniaArgentinaArmeniaAsiaAustraliaAustriaBahamasBangladeshBarbadosBelarusBelgiumBelizeBoliviaBosnia and HerzegovinaBrazilBulgariaBurma/MyanmarCabo VerdeCambodiaCameroonCanadaCaribbeanCentral AmericaChileChinaColombiaCongoCosta RicaCroatiaCubaCzechoslovakiaDenmarkDominicaDominican RepublicEastern AfricaEastern AsiaEastern EuropeEcuadorEgyptEl SalvadorEnglandEritreaEthiopiaEuropeFijiFranceGermanyGhanaGreeceGrenadaGuatemalaGuyanaHaitiHondurasHong KongHungaryIndiaIndonesiaIranIraqIrelandIsraelItalyJamaicaJapanJordanKazakhstanKenyaKoreaKuwaitLaosLatin AmericaLatviaLebanonLiberiaLithuaniaMalaysiaMexicoMicronesiaMiddle AfricaMoldovaMoroccoNepalNetherlandsNicaraguaNigeriaNorth AmericaNorth MacedoniaNorthern AfricaNorthern EuropeNorwayOceaniaPakistanPanamaPeruPhilippinesPolandPortugalRomaniaRussiaSaudi ArabiaScotlandSenegalSerbiaSierra LeoneSingaporeSomaliaSouth AfricaSouth AmericaSouth Central AsiaSouth Eastern AsiaSouthern EuropeSpainSri LankaSt. Vincent and the GrenadinesSudanSwedenSwitzerlandSyriaTaiwanThailandTrinidad and TobagoTurkeyUgandaUkraineUruguayUzbekistanVenezuelaVietnamWest IndiesWestern AfricaWestern AsiaWestern EuropeYemenZaireZimbabweAzores
Navajo
Race
Ancestry
AfghanAfricanAlaska NativeAlaskan AthabascanAlbanianAleutAlsatianAmericanApacheArabArapahoArgentineanArmenianAssyrian/Chaldean/SyriacAustralianAustrianBahamianBangladeshiBarbadianBasqueBelgianBelizeanBermudanBhutaneseBolivianBrazilianBritishBritish West IndianBulgarianBurmeseCajunCambodianCanadianCape VerdeanCarpatho RusynCelticCentral AmericanCentral American IndianCherokeeCheyenneChickasawChileanChineseChippewaChoctawColombianColvilleComancheCosta RicanCreeCreekCroatianCrowCubanCypriotCzechCzechoslovakianDanishDelawareDominicanDutchDutch West IndianEastern EuropeanEcuadorianEgyptianEnglishEstonianEthiopianEuropeanFijianFilipinoFinnishFrenchFrench American IndianFrench CanadianGermanGerman RussianGhanaianGreekGuamanian/ChamorroGuatemalanGuyaneseHaitianHmongHonduranHopiHoumaHungarianIcelanderIndian (Asian)IndonesianInupiatIranianIraqiIrishIroquoisIsraeliItalianJamaicanJapaneseJordanianKenyanKiowaKoreanLaotianLatvianLebaneseLiberianLithuanianLumbeeLuxembourgerMacedonianMalaysianMalteseMarshalleseMenomineeMexicanMexican American IndianMongolianMoroccanNative HawaiianNavajoNepaleseNew ZealanderNicaraguanNigerianNorthern EuropeanNorwegianOkinawanOsageOttawaPaiutePakistaniPalestinianPanamanianParaguayanPennsylvania GermanPeruvianPimaPolishPortuguesePotawatomiPuebloPuerto RicanPuget Sound SalishRomanianRussianSalvadoranSamoanScandinavianScotch-IrishScottishSeminoleSenegaleseSerbianShoshoneSierra LeoneanSiouxSlavicSlovakSloveneSomaliSouth AfricanSouth AmericanSouth American IndianSoviet UnionSpaniardSpanishSpanish AmericanSpanish American IndianSri LankanSubsaharan AfricanSudaneseSwedishSwissSyrianTaiwaneseThaiTlingit-HaidaTohono O'OdhamTonganTrinidadian and TobagonianTsimshianTurkishU.S. Virgin IslanderUgandanUkrainianUruguayanUteVenezuelanVietnameseWelshWest IndianYakamaYaquiYugoslavianYumanYup'ikZimbabwean
Immigration
NonimmigrantsImmigrantsAfghanistanAfricaAlbaniaArgentinaArmeniaAsiaAustraliaAustriaBahamasBangladeshBarbadosBelarusBelgiumBelizeBoliviaBosnia and HerzegovinaBrazilBulgariaBurma/MyanmarCabo VerdeCambodiaCameroonCanadaCaribbeanCentral AmericaChileChinaColombiaCongoCosta RicaCroatiaCubaCzechoslovakiaDenmarkDominicaDominican RepublicEastern AfricaEastern AsiaEastern EuropeEcuadorEgyptEl SalvadorEnglandEritreaEthiopiaEuropeFijiFranceGermanyGhanaGreeceGrenadaGuatemalaGuyanaHaitiHondurasHong KongHungaryIndiaIndonesiaIranIraqIrelandIsraelItalyJamaicaJapanJordanKazakhstanKenyaKoreaKuwaitLaosLatin AmericaLatviaLebanonLiberiaLithuaniaMalaysiaMexicoMicronesiaMiddle AfricaMoldovaMoroccoNepalNetherlandsNicaraguaNigeriaNorth AmericaNorth MacedoniaNorthern AfricaNorthern EuropeNorwayOceaniaPakistanPanamaPeruPhilippinesPolandPortugalRomaniaRussiaSaudi ArabiaScotlandSenegalSerbiaSierra LeoneSingaporeSomaliaSouth AfricaSouth AmericaSouth Central AsiaSouth Eastern AsiaSouthern EuropeSpainSri LankaSt. Vincent and the GrenadinesSudanSwedenSwitzerlandSyriaTaiwanThailandTrinidad and TobagoTurkeyUgandaUkraineUruguayUzbekistanVenezuelaVietnamWest IndiesWestern AfricaWestern AsiaWestern EuropeYemenZaireZimbabweAzores
2 or more Vehicles in Household
Income
Poverty
Unemployment
Labor Participation
Family Structure
Vehicle Availability
Education Level
Disability

2 or more Vehicles in Household Comparison

Blackfeet

Navajo

Excellent
Average
56.4%
2 OR MORE VEHICLES IN HOUSEHOLD
86.5/ 100
METRIC RATING
135th/ 347
METRIC RANK
55.3%
2 OR MORE VEHICLES IN HOUSEHOLD
50.0/ 100
METRIC RATING
174th/ 347
METRIC RANK

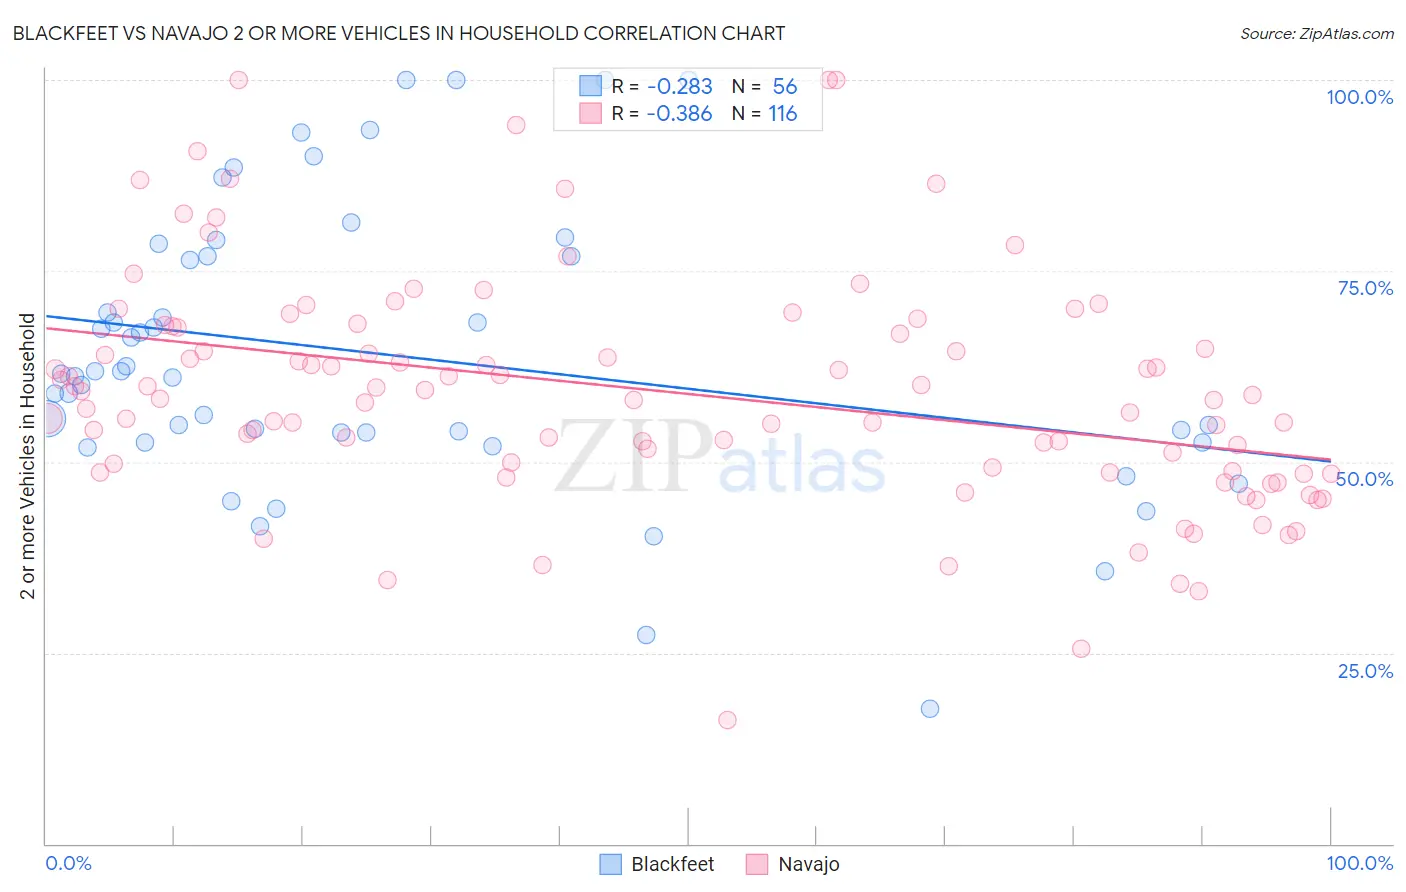
Blackfeet vs Navajo 2 or more Vehicles in Household Correlation Chart

The statistical analysis conducted on geographies consisting of 309,483,449 people shows a weak negative correlation between the proportion of Blackfeet and percentage of households with 2 or more vehicles available in the United States with a correlation coefficient (R) of -0.283 and weighted average of 56.4%. Similarly, the statistical analysis conducted on geographies consisting of 224,763,782 people shows a mild negative correlation between the proportion of Navajo and percentage of households with 2 or more vehicles available in the United States with a correlation coefficient (R) of -0.386 and weighted average of 55.3%, a difference of 1.8%.
Blackfeet vs Navajo 2 or more Vehicles in Household

2 or more Vehicles in Household Correlation Summary

MeasurementBlackfeetNavajo
Minimum17.6%16.3%
Maximum100.0%100.0%
Range82.4%83.7%
Mean64.0%59.2%
Median61.3%58.5%
Interquartile 25% (IQ1)53.2%49.0%
Interquartile 75% (IQ3)76.8%67.7%
Interquartile Range (IQR)23.7%18.7%
Standard Deviation (Sample)18.5%15.1%
Standard Deviation (Population)18.3%15.1%

Similar Demographics by 2 or more Vehicles in Household

Demographics Similar to Blackfeet by 2 or more Vehicles in Household

In terms of 2 or more vehicles in household, the demographic groups most similar to Blackfeet are Immigrants from the Azores (56.4%, a difference of 0.010%), Immigrants from Asia (56.3%, a difference of 0.040%), Cuban (56.3%, a difference of 0.13%), Salvadoran (56.3%, a difference of 0.14%), and Comanche (56.5%, a difference of 0.16%).
DemographicsRating | Rank2 or more Vehicles in Household
Immigrants | South Central Asia
90.5
/100
|
#128
Exceptional
56.6%
Ute
90.4
/100
|
#129
Exceptional
56.6%
Yugoslavians
90.0
/100
|
#130
Exceptional
56.6%
Bulgarians
89.7
/100
|
#131
Excellent
56.5%
Hungarians
89.1
/100
|
#132
Excellent
56.5%
Comanche
88.4
/100
|
#133
Excellent
56.5%
Immigrants | Azores
86.6
/100
|
#134
Excellent
56.4%
Blackfeet
86.5
/100
|
#135
Excellent
56.4%
Immigrants | Asia
86.0
/100
|
#136
Excellent
56.3%
Cubans
84.8
/100
|
#137
Excellent
56.3%
Salvadorans
84.7
/100
|
#138
Excellent
56.3%
Armenians
84.3
/100
|
#139
Excellent
56.3%
Latvians
83.6
/100
|
#140
Excellent
56.2%
Immigrants | Cambodia
83.6
/100
|
#141
Excellent
56.2%
South Africans
83.1
/100
|
#142
Excellent
56.2%

Demographics Similar to Navajo by 2 or more Vehicles in Household

In terms of 2 or more vehicles in household, the demographic groups most similar to Navajo are Immigrants from Denmark (55.3%, a difference of 0.020%), Immigrants from Western Europe (55.4%, a difference of 0.050%), Immigrants from Nicaragua (55.4%, a difference of 0.070%), Immigrants from Cuba (55.3%, a difference of 0.12%), and Menominee (55.3%, a difference of 0.15%).
DemographicsRating | Rank2 or more Vehicles in Household
Kenyans
58.1
/100
|
#167
Average
55.5%
French American Indians
56.7
/100
|
#168
Average
55.5%
Immigrants | Austria
56.3
/100
|
#169
Average
55.5%
Romanians
55.8
/100
|
#170
Average
55.5%
Immigrants | Costa Rica
54.4
/100
|
#171
Average
55.4%
Immigrants | Nicaragua
51.6
/100
|
#172
Average
55.4%
Immigrants | Western Europe
51.4
/100
|
#173
Average
55.4%
Navajo
50.0
/100
|
#174
Average
55.3%
Immigrants | Denmark
49.4
/100
|
#175
Average
55.3%
Immigrants | Cuba
47.0
/100
|
#176
Average
55.3%
Menominee
46.2
/100
|
#177
Average
55.3%
Immigrants | Sweden
45.3
/100
|
#178
Average
55.2%
Alaskan Athabascans
42.9
/100
|
#179
Average
55.2%
Immigrants | Kenya
40.4
/100
|
#180
Average
55.1%
Immigrants | Micronesia
38.2
/100
|
#181
Fair
55.1%