Latvian vs Sudanese 2 or more Vehicles in Household
COMPARE
Latvian
Sudanese
2 or more Vehicles in Household
2 or more Vehicles in Household Comparison
Latvians
Sudanese
56.2%
2 OR MORE VEHICLES IN HOUSEHOLD
83.6/ 100
METRIC RATING
140th/ 347
METRIC RANK
53.6%
2 OR MORE VEHICLES IN HOUSEHOLD
4.1/ 100
METRIC RATING
227th/ 347
METRIC RANK
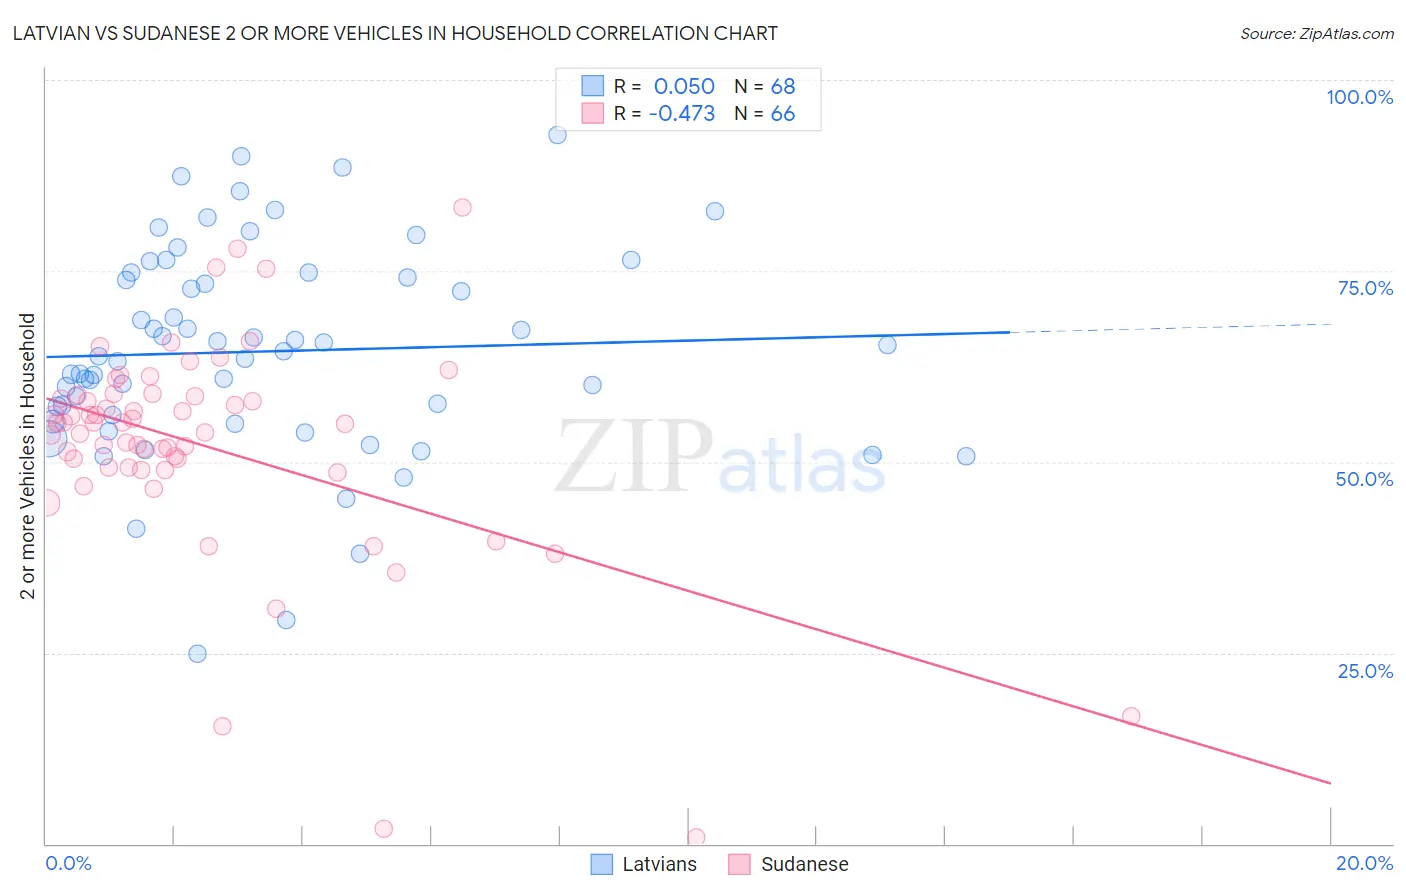
Latvian vs Sudanese 2 or more Vehicles in Household Correlation Chart
The statistical analysis conducted on geographies consisting of 220,663,993 people shows no correlation between the proportion of Latvians and percentage of households with 2 or more vehicles available in the United States with a correlation coefficient (R) of 0.050 and weighted average of 56.2%. Similarly, the statistical analysis conducted on geographies consisting of 110,122,172 people shows a moderate negative correlation between the proportion of Sudanese and percentage of households with 2 or more vehicles available in the United States with a correlation coefficient (R) of -0.473 and weighted average of 53.6%, a difference of 4.9%.
2 or more Vehicles in Household Correlation Summary
| Measurement | Latvian | Sudanese |
| Minimum | 24.9% | 0.83% |
| Maximum | 92.8% | 83.4% |
| Range | 67.9% | 82.5% |
| Mean | 64.5% | 52.1% |
| Median | 64.1% | 55.1% |
| Interquartile 25% (IQ1) | 55.7% | 49.2% |
| Interquartile 75% (IQ3) | 74.4% | 58.6% |
| Interquartile Range (IQR) | 18.7% | 9.4% |
| Standard Deviation (Sample) | 13.8% | 14.5% |
| Standard Deviation (Population) | 13.7% | 14.4% |
Similar Demographics by 2 or more Vehicles in Household
Demographics Similar to Latvians by 2 or more Vehicles in Household
In terms of 2 or more vehicles in household, the demographic groups most similar to Latvians are Immigrants from Cambodia (56.2%, a difference of 0.0%), South African (56.2%, a difference of 0.040%), Armenian (56.3%, a difference of 0.050%), Salvadoran (56.3%, a difference of 0.080%), and Cuban (56.3%, a difference of 0.090%).
| Demographics | Rating | Rank | 2 or more Vehicles in Household |
| Comanche | 88.4 /100 | #133 | Excellent 56.5% |
| Immigrants | Azores | 86.6 /100 | #134 | Excellent 56.4% |
| Blackfeet | 86.5 /100 | #135 | Excellent 56.4% |
| Immigrants | Asia | 86.0 /100 | #136 | Excellent 56.3% |
| Cubans | 84.8 /100 | #137 | Excellent 56.3% |
| Salvadorans | 84.7 /100 | #138 | Excellent 56.3% |
| Armenians | 84.3 /100 | #139 | Excellent 56.3% |
| Latvians | 83.6 /100 | #140 | Excellent 56.2% |
| Immigrants | Cambodia | 83.6 /100 | #141 | Excellent 56.2% |
| South Africans | 83.1 /100 | #142 | Excellent 56.2% |
| Seminole | 81.7 /100 | #143 | Excellent 56.2% |
| Immigrants | Syria | 81.4 /100 | #144 | Excellent 56.2% |
| Syrians | 81.2 /100 | #145 | Excellent 56.2% |
| Venezuelans | 80.7 /100 | #146 | Excellent 56.1% |
| Serbians | 80.3 /100 | #147 | Excellent 56.1% |
Demographics Similar to Sudanese by 2 or more Vehicles in Household
In terms of 2 or more vehicles in household, the demographic groups most similar to Sudanese are Alaska Native (53.6%, a difference of 0.060%), Immigrants from Turkey (53.6%, a difference of 0.080%), Immigrants from Nepal (53.5%, a difference of 0.14%), Panamanian (53.5%, a difference of 0.19%), and Immigrants from Eastern Africa (53.7%, a difference of 0.24%).
| Demographics | Rating | Rank | 2 or more Vehicles in Household |
| Taiwanese | 6.3 /100 | #220 | Tragic 53.9% |
| Immigrants | Singapore | 6.3 /100 | #221 | Tragic 53.9% |
| Kiowa | 6.2 /100 | #222 | Tragic 53.9% |
| Immigrants | Bosnia and Herzegovina | 5.5 /100 | #223 | Tragic 53.8% |
| Brazilians | 5.3 /100 | #224 | Tragic 53.8% |
| Immigrants | Egypt | 5.2 /100 | #225 | Tragic 53.8% |
| Immigrants | Eastern Africa | 5.1 /100 | #226 | Tragic 53.7% |
| Sudanese | 4.1 /100 | #227 | Tragic 53.6% |
| Alaska Natives | 3.9 /100 | #228 | Tragic 53.6% |
| Immigrants | Turkey | 3.8 /100 | #229 | Tragic 53.6% |
| Immigrants | Nepal | 3.6 /100 | #230 | Tragic 53.5% |
| Panamanians | 3.4 /100 | #231 | Tragic 53.5% |
| Immigrants | Guatemala | 3.2 /100 | #232 | Tragic 53.5% |
| Ugandans | 3.2 /100 | #233 | Tragic 53.5% |
| Immigrants | Switzerland | 3.0 /100 | #234 | Tragic 53.4% |