Immigrants from England vs Cuban 3 or more Vehicles in Household

COMPARE

Immigrants from England
Race
Ancestry
AfghanAfricanAlaska NativeAlaskan AthabascanAlbanianAleutAlsatianAmericanApacheArabArapahoArgentineanArmenianAssyrian/Chaldean/SyriacAustralianAustrianBahamianBangladeshiBarbadianBasqueBelgianBelizeanBermudanBhutaneseBlackfeetBolivianBrazilianBritishBritish West IndianBulgarianBurmeseCajunCambodianCanadianCape VerdeanCarpatho RusynCelticCentral AmericanCentral American IndianCherokeeCheyenneChickasawChileanChineseChippewaChoctawColombianColvilleComancheCosta RicanCreeCreekCroatianCrowCypriotCzechCzechoslovakianDanishDelawareDominicanDutchDutch West IndianEastern EuropeanEcuadorianEgyptianEnglishEstonianEthiopianEuropeanFijianFilipinoFinnishFrenchFrench American IndianFrench CanadianGermanGerman RussianGhanaianGreekGuamanian/ChamorroGuatemalanGuyaneseHaitianHmongHonduranHopiHoumaHungarianIcelanderIndian (Asian)IndonesianInupiatIranianIraqiIrishIroquoisIsraeliItalianJamaicanJapaneseJordanianKenyanKiowaKoreanLaotianLatvianLebaneseLiberianLithuanianLumbeeLuxembourgerMacedonianMalaysianMalteseMarshalleseMenomineeMexicanMexican American IndianMongolianMoroccanNative HawaiianNavajoNepaleseNew ZealanderNicaraguanNigerianNorthern EuropeanNorwegianOkinawanOsageOttawaPaiutePakistaniPalestinianPanamanianParaguayanPennsylvania GermanPeruvianPimaPolishPortuguesePotawatomiPuebloPuerto RicanPuget Sound SalishRomanianRussianSalvadoranSamoanScandinavianScotch-IrishScottishSeminoleSenegaleseSerbianShoshoneSierra LeoneanSiouxSlavicSlovakSloveneSomaliSouth AfricanSouth AmericanSouth American IndianSoviet UnionSpaniardSpanishSpanish AmericanSpanish American IndianSri LankanSubsaharan AfricanSudaneseSwedishSwissSyrianTaiwaneseThaiTlingit-HaidaTohono O'OdhamTonganTrinidadian and TobagonianTsimshianTurkishU.S. Virgin IslanderUgandanUkrainianUruguayanUteVenezuelanVietnameseWelshWest IndianYakamaYaquiYugoslavianYumanYup'ikZimbabwean
Immigration
NonimmigrantsImmigrantsAfghanistanAfricaAlbaniaArgentinaArmeniaAsiaAustraliaAustriaBahamasBangladeshBarbadosBelarusBelgiumBelizeBoliviaBosnia and HerzegovinaBrazilBulgariaBurma/MyanmarCabo VerdeCambodiaCameroonCanadaCaribbeanCentral AmericaChileChinaColombiaCongoCosta RicaCroatiaCubaCzechoslovakiaDenmarkDominicaDominican RepublicEastern AfricaEastern AsiaEastern EuropeEcuadorEgyptEl SalvadorEnglandEritreaEthiopiaEuropeFijiFranceGermanyGhanaGreeceGrenadaGuatemalaGuyanaHaitiHondurasHong KongHungaryIndiaIndonesiaIranIraqIrelandIsraelItalyJamaicaJapanJordanKazakhstanKenyaKoreaKuwaitLaosLatin AmericaLatviaLebanonLiberiaLithuaniaMalaysiaMexicoMicronesiaMiddle AfricaMoldovaMoroccoNepalNetherlandsNicaraguaNigeriaNorth AmericaNorth MacedoniaNorthern AfricaNorthern EuropeNorwayOceaniaPakistanPanamaPeruPhilippinesPolandPortugalRomaniaRussiaSaudi ArabiaScotlandSenegalSerbiaSierra LeoneSingaporeSomaliaSouth AfricaSouth AmericaSouth Central AsiaSouth Eastern AsiaSouthern EuropeSpainSri LankaSt. Vincent and the GrenadinesSudanSwedenSwitzerlandSyriaTaiwanThailandTrinidad and TobagoTurkeyUgandaUkraineUruguayUzbekistanVenezuelaVietnamWest IndiesWestern AfricaWestern AsiaWestern EuropeYemenZaireZimbabweAzores
Cuban
Race
Ancestry
AfghanAfricanAlaska NativeAlaskan AthabascanAlbanianAleutAlsatianAmericanApacheArabArapahoArgentineanArmenianAssyrian/Chaldean/SyriacAustralianAustrianBahamianBangladeshiBarbadianBasqueBelgianBelizeanBermudanBhutaneseBlackfeetBolivianBrazilianBritishBritish West IndianBulgarianBurmeseCajunCambodianCanadianCape VerdeanCarpatho RusynCelticCentral AmericanCentral American IndianCherokeeCheyenneChickasawChileanChineseChippewaChoctawColombianColvilleComancheCosta RicanCreeCreekCroatianCrowCubanCypriotCzechCzechoslovakianDanishDelawareDominicanDutchDutch West IndianEastern EuropeanEcuadorianEgyptianEnglishEstonianEthiopianEuropeanFijianFilipinoFinnishFrenchFrench American IndianFrench CanadianGermanGerman RussianGhanaianGreekGuamanian/ChamorroGuatemalanGuyaneseHaitianHmongHonduranHopiHoumaHungarianIcelanderIndian (Asian)IndonesianInupiatIranianIraqiIrishIroquoisIsraeliItalianJamaicanJapaneseJordanianKenyanKiowaKoreanLaotianLatvianLebaneseLiberianLithuanianLumbeeLuxembourgerMacedonianMalaysianMalteseMarshalleseMenomineeMexicanMexican American IndianMongolianMoroccanNative HawaiianNavajoNepaleseNew ZealanderNicaraguanNigerianNorthern EuropeanNorwegianOkinawanOsageOttawaPaiutePakistaniPalestinianPanamanianParaguayanPennsylvania GermanPeruvianPimaPolishPortuguesePotawatomiPuebloPuerto RicanPuget Sound SalishRomanianRussianSalvadoranSamoanScandinavianScotch-IrishScottishSeminoleSenegaleseSerbianShoshoneSierra LeoneanSiouxSlavicSlovakSloveneSomaliSouth AfricanSouth AmericanSouth American IndianSoviet UnionSpaniardSpanishSpanish AmericanSpanish American IndianSri LankanSubsaharan AfricanSudaneseSwedishSwissSyrianTaiwaneseThaiTlingit-HaidaTohono O'OdhamTonganTrinidadian and TobagonianTsimshianTurkishU.S. Virgin IslanderUgandanUkrainianUruguayanUteVenezuelanVietnameseWelshWest IndianYakamaYaquiYugoslavianYumanYup'ikZimbabwean
Immigration
NonimmigrantsImmigrantsAfghanistanAfricaAlbaniaArgentinaArmeniaAsiaAustraliaAustriaBahamasBangladeshBarbadosBelarusBelgiumBelizeBoliviaBosnia and HerzegovinaBrazilBulgariaBurma/MyanmarCabo VerdeCambodiaCameroonCanadaCaribbeanCentral AmericaChileChinaColombiaCongoCosta RicaCroatiaCubaCzechoslovakiaDenmarkDominicaDominican RepublicEastern AfricaEastern AsiaEastern EuropeEcuadorEgyptEl SalvadorEritreaEthiopiaEuropeFijiFranceGermanyGhanaGreeceGrenadaGuatemalaGuyanaHaitiHondurasHong KongHungaryIndiaIndonesiaIranIraqIrelandIsraelItalyJamaicaJapanJordanKazakhstanKenyaKoreaKuwaitLaosLatin AmericaLatviaLebanonLiberiaLithuaniaMalaysiaMexicoMicronesiaMiddle AfricaMoldovaMoroccoNepalNetherlandsNicaraguaNigeriaNorth AmericaNorth MacedoniaNorthern AfricaNorthern EuropeNorwayOceaniaPakistanPanamaPeruPhilippinesPolandPortugalRomaniaRussiaSaudi ArabiaScotlandSenegalSerbiaSierra LeoneSingaporeSomaliaSouth AfricaSouth AmericaSouth Central AsiaSouth Eastern AsiaSouthern EuropeSpainSri LankaSt. Vincent and the GrenadinesSudanSwedenSwitzerlandSyriaTaiwanThailandTrinidad and TobagoTurkeyUgandaUkraineUruguayUzbekistanVenezuelaVietnamWest IndiesWestern AfricaWestern AsiaWestern EuropeYemenZaireZimbabweAzores
3 or more Vehicles in Household
Income
Poverty
Unemployment
Labor Participation
Family Structure
Vehicle Availability
Education Level
Disability

3 or more Vehicles in Household Comparison

Immigrants from England

Cubans

Exceptional
Fair
20.7%
3 OR MORE VEHICLES IN HOUSEHOLD
96.2/ 100
METRIC RATING
113th/ 347
METRIC RANK
19.3%
3 OR MORE VEHICLES IN HOUSEHOLD
36.6/ 100
METRIC RATING
182nd/ 347
METRIC RANK

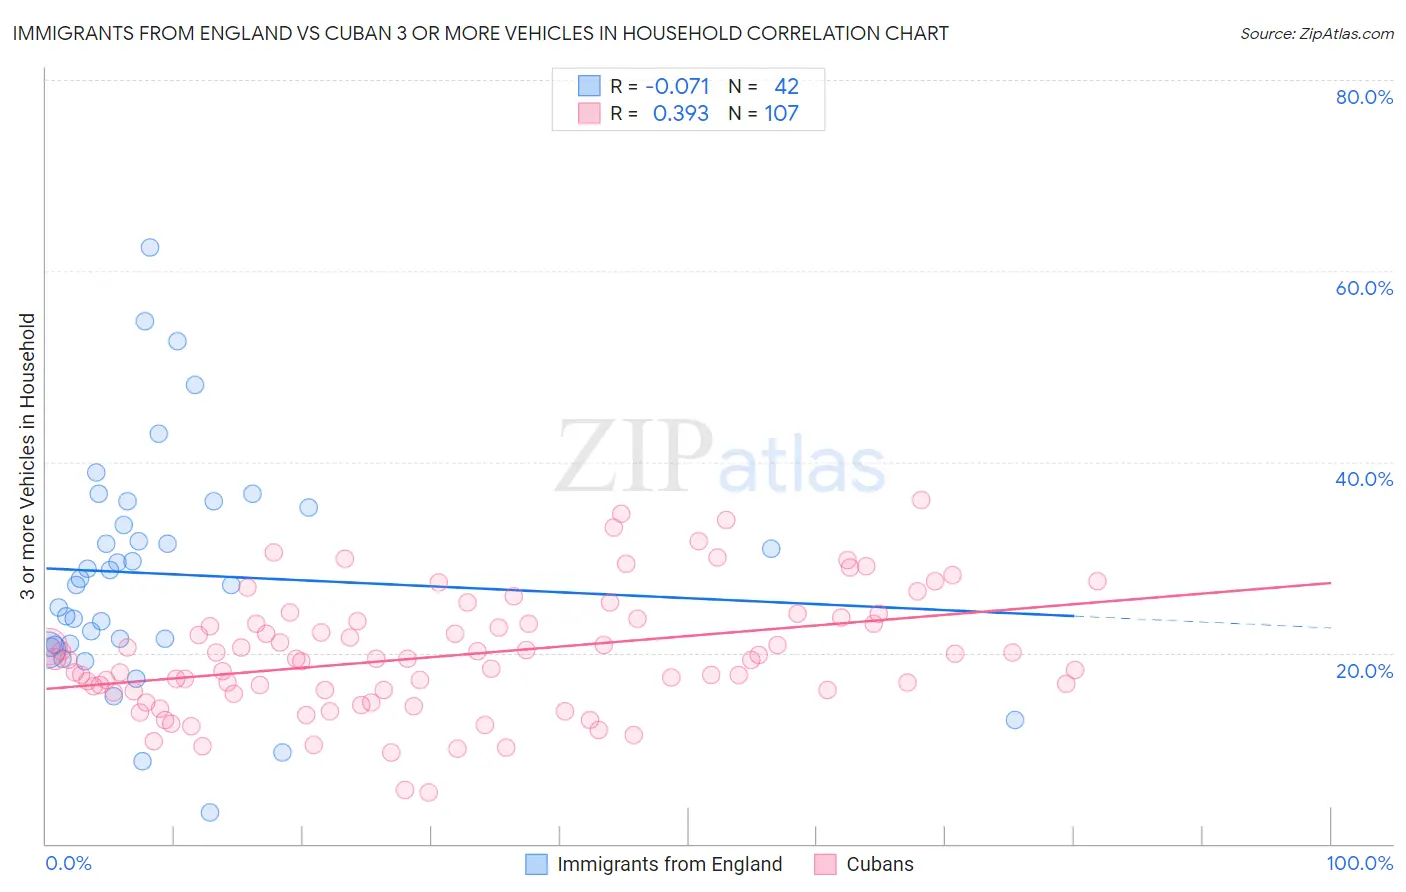
Immigrants from England vs Cuban 3 or more Vehicles in Household Correlation Chart

The statistical analysis conducted on geographies consisting of 391,649,997 people shows a slight negative correlation between the proportion of Immigrants from England and percentage of households with 3 or more vehicles available in the United States with a correlation coefficient (R) of -0.071 and weighted average of 20.7%. Similarly, the statistical analysis conducted on geographies consisting of 448,802,841 people shows a mild positive correlation between the proportion of Cubans and percentage of households with 3 or more vehicles available in the United States with a correlation coefficient (R) of 0.393 and weighted average of 19.3%, a difference of 7.2%.
Immigrants from England vs Cuban 3 or more Vehicles in Household

3 or more Vehicles in Household Correlation Summary

MeasurementImmigrants from EnglandCuban
Minimum3.3%5.3%
Maximum62.4%36.0%
Range59.1%30.7%
Mean28.2%19.8%
Median27.4%19.3%
Interquartile 25% (IQ1)20.8%16.0%
Interquartile 75% (IQ3)35.2%23.3%
Interquartile Range (IQR)14.4%7.3%
Standard Deviation (Sample)12.1%6.3%
Standard Deviation (Population)12.0%6.2%

Similar Demographics by 3 or more Vehicles in Household

Demographics Similar to Immigrants from England by 3 or more Vehicles in Household

In terms of 3 or more vehicles in household, the demographic groups most similar to Immigrants from England are Nicaraguan (20.7%, a difference of 0.010%), Burmese (20.6%, a difference of 0.18%), Immigrants from Micronesia (20.7%, a difference of 0.30%), Asian (20.8%, a difference of 0.33%), and Filipino (20.8%, a difference of 0.47%).
DemographicsRating | Rank3 or more Vehicles in Household
Bolivians
97.4
/100
|
#106
Exceptional
20.8%
Immigrants | Germany
97.4
/100
|
#107
Exceptional
20.8%
Immigrants | Scotland
97.1
/100
|
#108
Exceptional
20.8%
Filipinos
97.0
/100
|
#109
Exceptional
20.8%
Asians
96.8
/100
|
#110
Exceptional
20.8%
Immigrants | Micronesia
96.7
/100
|
#111
Exceptional
20.7%
Nicaraguans
96.2
/100
|
#112
Exceptional
20.7%
Immigrants | England
96.2
/100
|
#113
Exceptional
20.7%
Burmese
95.8
/100
|
#114
Exceptional
20.6%
French Canadians
95.0
/100
|
#115
Exceptional
20.6%
Italians
94.9
/100
|
#116
Exceptional
20.6%
Croatians
94.9
/100
|
#117
Exceptional
20.6%
Costa Ricans
94.6
/100
|
#118
Exceptional
20.6%
Immigrants | Latin America
94.5
/100
|
#119
Exceptional
20.5%
Maltese
93.9
/100
|
#120
Exceptional
20.5%

Demographics Similar to Cubans by 3 or more Vehicles in Household

In terms of 3 or more vehicles in household, the demographic groups most similar to Cubans are Romanian (19.3%, a difference of 0.040%), Cajun (19.3%, a difference of 0.050%), South African (19.3%, a difference of 0.070%), Latvian (19.3%, a difference of 0.070%), and Immigrants from South Central Asia (19.3%, a difference of 0.19%).
DemographicsRating | Rank3 or more Vehicles in Household
Syrians
47.0
/100
|
#175
Average
19.5%
Iroquois
46.0
/100
|
#176
Average
19.4%
Immigrants | Peru
41.1
/100
|
#177
Average
19.4%
Immigrants | Syria
40.3
/100
|
#178
Average
19.4%
Immigrants | South Central Asia
38.9
/100
|
#179
Fair
19.3%
South Africans
37.5
/100
|
#180
Fair
19.3%
Romanians
37.1
/100
|
#181
Fair
19.3%
Cubans
36.6
/100
|
#182
Fair
19.3%
Cajuns
36.0
/100
|
#183
Fair
19.3%
Latvians
35.7
/100
|
#184
Fair
19.3%
Immigrants | Sri Lanka
30.7
/100
|
#185
Fair
19.2%
Immigrants | Sweden
29.0
/100
|
#186
Fair
19.2%
Immigrants | Hong Kong
28.3
/100
|
#187
Fair
19.2%
Immigrants | Kuwait
26.1
/100
|
#188
Fair
19.1%
Indians (Asian)
26.0
/100
|
#189
Fair
19.1%