Immigrants from Nigeria vs Immigrants from Northern Europe 3 or more Vehicles in Household
COMPARE
Immigrants from Nigeria
Immigrants from Northern Europe
3 or more Vehicles in Household
3 or more Vehicles in Household Comparison
Immigrants from Nigeria
Immigrants from Northern Europe
18.7%
3 OR MORE VEHICLES IN HOUSEHOLD
10.3/ 100
METRIC RATING
216th/ 347
METRIC RANK
19.5%
3 OR MORE VEHICLES IN HOUSEHOLD
50.2/ 100
METRIC RATING
173rd/ 347
METRIC RANK
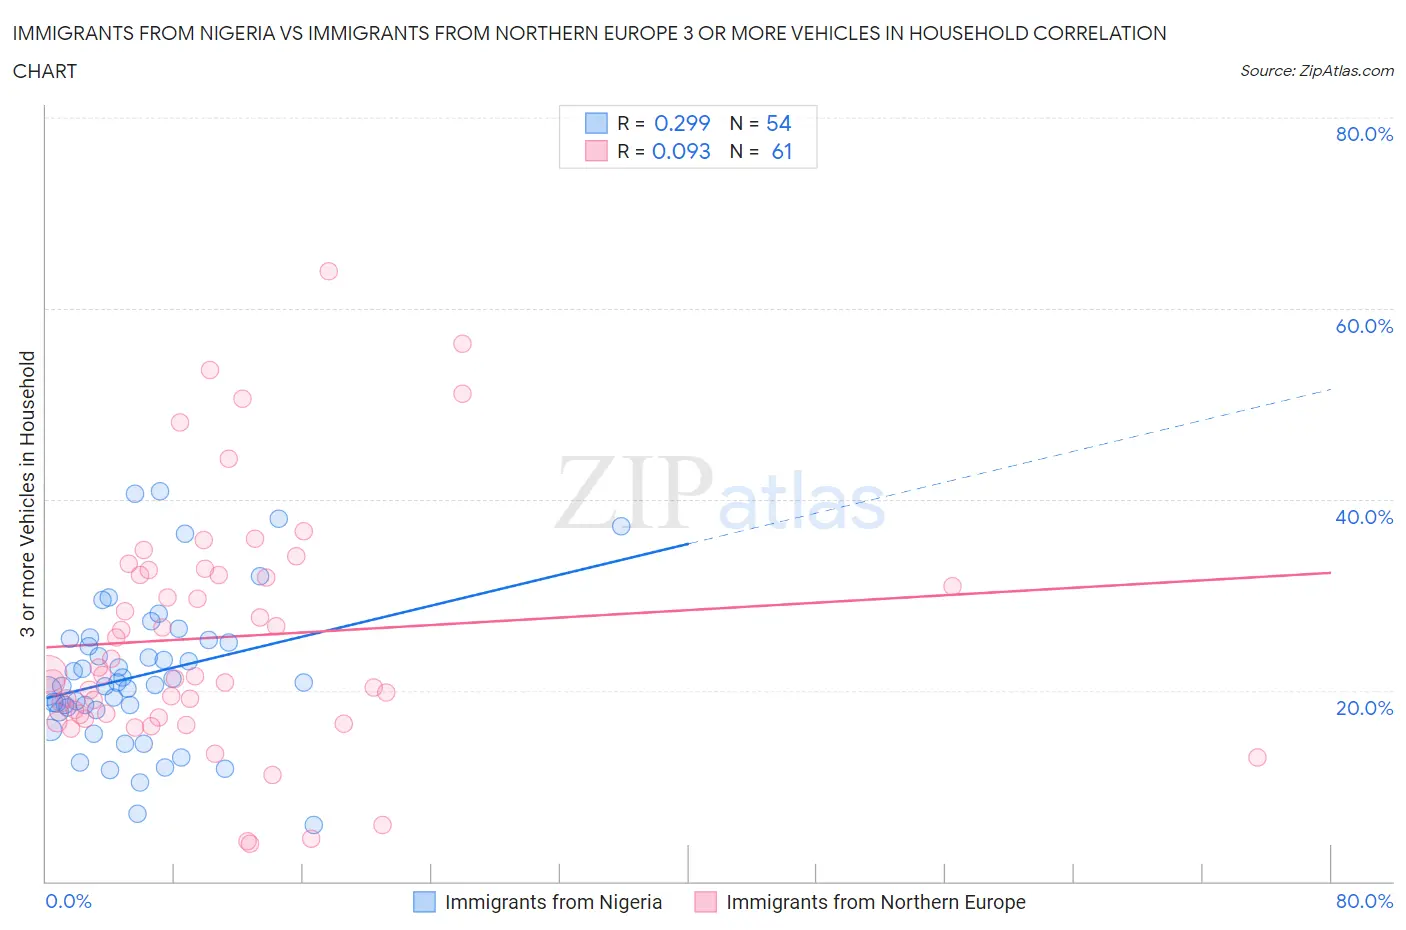
Immigrants from Nigeria vs Immigrants from Northern Europe 3 or more Vehicles in Household Correlation Chart
The statistical analysis conducted on geographies consisting of 283,187,528 people shows a weak positive correlation between the proportion of Immigrants from Nigeria and percentage of households with 3 or more vehicles available in the United States with a correlation coefficient (R) of 0.299 and weighted average of 18.7%. Similarly, the statistical analysis conducted on geographies consisting of 476,757,527 people shows a slight positive correlation between the proportion of Immigrants from Northern Europe and percentage of households with 3 or more vehicles available in the United States with a correlation coefficient (R) of 0.093 and weighted average of 19.5%, a difference of 4.3%.
3 or more Vehicles in Household Correlation Summary
| Measurement | Immigrants from Nigeria | Immigrants from Northern Europe |
| Minimum | 5.9% | 3.9% |
| Maximum | 40.9% | 63.8% |
| Range | 35.0% | 59.9% |
| Mean | 21.6% | 25.6% |
| Median | 20.6% | 21.6% |
| Interquartile 25% (IQ1) | 17.9% | 17.3% |
| Interquartile 75% (IQ3) | 25.2% | 32.3% |
| Interquartile Range (IQR) | 7.3% | 15.0% |
| Standard Deviation (Sample) | 7.8% | 12.7% |
| Standard Deviation (Population) | 7.7% | 12.6% |
Similar Demographics by 3 or more Vehicles in Household
Demographics Similar to Immigrants from Nigeria by 3 or more Vehicles in Household
In terms of 3 or more vehicles in household, the demographic groups most similar to Immigrants from Nigeria are Immigrants from Italy (18.7%, a difference of 0.020%), Eastern European (18.7%, a difference of 0.060%), Immigrants from Sierra Leone (18.7%, a difference of 0.10%), Panamanian (18.8%, a difference of 0.26%), and Immigrants from Cuba (18.8%, a difference of 0.26%).
| Demographics | Rating | Rank | 3 or more Vehicles in Household |
| Immigrants | Egypt | 13.5 /100 | #209 | Poor 18.8% |
| Bulgarians | 13.1 /100 | #210 | Poor 18.8% |
| Immigrants | Kenya | 12.4 /100 | #211 | Poor 18.8% |
| Panamanians | 11.6 /100 | #212 | Poor 18.8% |
| Immigrants | Cuba | 11.6 /100 | #213 | Poor 18.8% |
| Immigrants | Sierra Leone | 10.8 /100 | #214 | Poor 18.7% |
| Eastern Europeans | 10.6 /100 | #215 | Poor 18.7% |
| Immigrants | Nigeria | 10.3 /100 | #216 | Poor 18.7% |
| Immigrants | Italy | 10.2 /100 | #217 | Poor 18.7% |
| Immigrants | Portugal | 8.9 /100 | #218 | Tragic 18.6% |
| Immigrants | Armenia | 8.6 /100 | #219 | Tragic 18.6% |
| Nigerians | 7.9 /100 | #220 | Tragic 18.6% |
| Immigrants | Poland | 7.5 /100 | #221 | Tragic 18.6% |
| Belizeans | 7.3 /100 | #222 | Tragic 18.6% |
| Immigrants | Czechoslovakia | 5.9 /100 | #223 | Tragic 18.5% |
Demographics Similar to Immigrants from Northern Europe by 3 or more Vehicles in Household
In terms of 3 or more vehicles in household, the demographic groups most similar to Immigrants from Northern Europe are Immigrants from South Africa (19.5%, a difference of 0.020%), Kiowa (19.5%, a difference of 0.050%), Immigrants from Western Europe (19.5%, a difference of 0.23%), Syrian (19.5%, a difference of 0.25%), and Iroquois (19.4%, a difference of 0.32%).
| Demographics | Rating | Rank | 3 or more Vehicles in Household |
| Immigrants | Cameroon | 60.9 /100 | #166 | Good 19.7% |
| Ukrainians | 58.9 /100 | #167 | Average 19.6% |
| Peruvians | 58.8 /100 | #168 | Average 19.6% |
| Immigrants | Denmark | 57.6 /100 | #169 | Average 19.6% |
| Iraqis | 56.0 /100 | #170 | Average 19.6% |
| Immigrants | Western Europe | 53.2 /100 | #171 | Average 19.5% |
| Kiowa | 50.9 /100 | #172 | Average 19.5% |
| Immigrants | Northern Europe | 50.2 /100 | #173 | Average 19.5% |
| Immigrants | South Africa | 50.0 /100 | #174 | Average 19.5% |
| Syrians | 47.0 /100 | #175 | Average 19.5% |
| Iroquois | 46.0 /100 | #176 | Average 19.4% |
| Immigrants | Peru | 41.1 /100 | #177 | Average 19.4% |
| Immigrants | Syria | 40.3 /100 | #178 | Average 19.4% |
| Immigrants | South Central Asia | 38.9 /100 | #179 | Fair 19.3% |
| South Africans | 37.5 /100 | #180 | Fair 19.3% |