Immigrants from Malaysia vs Immigrants from Honduras 2 or more Vehicles in Household

COMPARE

Immigrants from Malaysia
Race
Ancestry
AfghanAfricanAlaska NativeAlaskan AthabascanAlbanianAleutAlsatianAmericanApacheArabArapahoArgentineanArmenianAssyrian/Chaldean/SyriacAustralianAustrianBahamianBangladeshiBarbadianBasqueBelgianBelizeanBermudanBhutaneseBlackfeetBolivianBrazilianBritishBritish West IndianBulgarianBurmeseCajunCambodianCanadianCape VerdeanCarpatho RusynCelticCentral AmericanCentral American IndianCherokeeCheyenneChickasawChileanChineseChippewaChoctawColombianColvilleComancheCosta RicanCreeCreekCroatianCrowCubanCypriotCzechCzechoslovakianDanishDelawareDominicanDutchDutch West IndianEastern EuropeanEcuadorianEgyptianEnglishEstonianEthiopianEuropeanFijianFilipinoFinnishFrenchFrench American IndianFrench CanadianGermanGerman RussianGhanaianGreekGuamanian/ChamorroGuatemalanGuyaneseHaitianHmongHonduranHopiHoumaHungarianIcelanderIndian (Asian)IndonesianInupiatIranianIraqiIrishIroquoisIsraeliItalianJamaicanJapaneseJordanianKenyanKiowaKoreanLaotianLatvianLebaneseLiberianLithuanianLumbeeLuxembourgerMacedonianMalaysianMalteseMarshalleseMenomineeMexicanMexican American IndianMongolianMoroccanNative HawaiianNavajoNepaleseNew ZealanderNicaraguanNigerianNorthern EuropeanNorwegianOkinawanOsageOttawaPaiutePakistaniPalestinianPanamanianParaguayanPennsylvania GermanPeruvianPimaPolishPortuguesePotawatomiPuebloPuerto RicanPuget Sound SalishRomanianRussianSalvadoranSamoanScandinavianScotch-IrishScottishSeminoleSenegaleseSerbianShoshoneSierra LeoneanSiouxSlavicSlovakSloveneSomaliSouth AfricanSouth AmericanSouth American IndianSoviet UnionSpaniardSpanishSpanish AmericanSpanish American IndianSri LankanSubsaharan AfricanSudaneseSwedishSwissSyrianTaiwaneseThaiTlingit-HaidaTohono O'OdhamTonganTrinidadian and TobagonianTsimshianTurkishU.S. Virgin IslanderUgandanUkrainianUruguayanUteVenezuelanVietnameseWelshWest IndianYakamaYaquiYugoslavianYumanYup'ikZimbabwean
Immigration
NonimmigrantsImmigrantsAfghanistanAfricaAlbaniaArgentinaArmeniaAsiaAustraliaAustriaBahamasBangladeshBarbadosBelarusBelgiumBelizeBoliviaBosnia and HerzegovinaBrazilBulgariaBurma/MyanmarCabo VerdeCambodiaCameroonCanadaCaribbeanCentral AmericaChileChinaColombiaCongoCosta RicaCroatiaCubaCzechoslovakiaDenmarkDominicaDominican RepublicEastern AfricaEastern AsiaEastern EuropeEcuadorEgyptEl SalvadorEnglandEritreaEthiopiaEuropeFijiFranceGermanyGhanaGreeceGrenadaGuatemalaGuyanaHaitiHong KongHungaryIndiaIndonesiaIranIraqIrelandIsraelItalyJamaicaJapanJordanKazakhstanKenyaKoreaKuwaitLaosLatin AmericaLatviaLebanonLiberiaLithuaniaMalaysiaMexicoMicronesiaMiddle AfricaMoldovaMoroccoNepalNetherlandsNicaraguaNigeriaNorth AmericaNorth MacedoniaNorthern AfricaNorthern EuropeNorwayOceaniaPakistanPanamaPeruPhilippinesPolandPortugalRomaniaRussiaSaudi ArabiaScotlandSenegalSerbiaSierra LeoneSingaporeSomaliaSouth AfricaSouth AmericaSouth Central AsiaSouth Eastern AsiaSouthern EuropeSpainSri LankaSt. Vincent and the GrenadinesSudanSwedenSwitzerlandSyriaTaiwanThailandTrinidad and TobagoTurkeyUgandaUkraineUruguayUzbekistanVenezuelaVietnamWest IndiesWestern AfricaWestern AsiaWestern EuropeYemenZaireZimbabweAzores
Immigrants from Honduras
Race
Ancestry
AfghanAfricanAlaska NativeAlaskan AthabascanAlbanianAleutAlsatianAmericanApacheArabArapahoArgentineanArmenianAssyrian/Chaldean/SyriacAustralianAustrianBahamianBangladeshiBarbadianBasqueBelgianBelizeanBermudanBhutaneseBlackfeetBolivianBrazilianBritishBritish West IndianBulgarianBurmeseCajunCambodianCanadianCape VerdeanCarpatho RusynCelticCentral AmericanCentral American IndianCherokeeCheyenneChickasawChileanChineseChippewaChoctawColombianColvilleComancheCosta RicanCreeCreekCroatianCrowCubanCypriotCzechCzechoslovakianDanishDelawareDominicanDutchDutch West IndianEastern EuropeanEcuadorianEgyptianEnglishEstonianEthiopianEuropeanFijianFilipinoFinnishFrenchFrench American IndianFrench CanadianGermanGerman RussianGhanaianGreekGuamanian/ChamorroGuatemalanGuyaneseHaitianHmongHonduranHopiHoumaHungarianIcelanderIndian (Asian)IndonesianInupiatIranianIraqiIrishIroquoisIsraeliItalianJamaicanJapaneseJordanianKenyanKiowaKoreanLaotianLatvianLebaneseLiberianLithuanianLumbeeLuxembourgerMacedonianMalaysianMalteseMarshalleseMenomineeMexicanMexican American IndianMongolianMoroccanNative HawaiianNavajoNepaleseNew ZealanderNicaraguanNigerianNorthern EuropeanNorwegianOkinawanOsageOttawaPaiutePakistaniPalestinianPanamanianParaguayanPennsylvania GermanPeruvianPimaPolishPortuguesePotawatomiPuebloPuerto RicanPuget Sound SalishRomanianRussianSalvadoranSamoanScandinavianScotch-IrishScottishSeminoleSenegaleseSerbianShoshoneSierra LeoneanSiouxSlavicSlovakSloveneSomaliSouth AfricanSouth AmericanSouth American IndianSoviet UnionSpaniardSpanishSpanish AmericanSpanish American IndianSri LankanSubsaharan AfricanSudaneseSwedishSwissSyrianTaiwaneseThaiTlingit-HaidaTohono O'OdhamTonganTrinidadian and TobagonianTsimshianTurkishU.S. Virgin IslanderUgandanUkrainianUruguayanUteVenezuelanVietnameseWelshWest IndianYakamaYaquiYugoslavianYumanYup'ikZimbabwean
Immigration
NonimmigrantsImmigrantsAfghanistanAfricaAlbaniaArgentinaArmeniaAsiaAustraliaAustriaBahamasBangladeshBarbadosBelarusBelgiumBelizeBoliviaBosnia and HerzegovinaBrazilBulgariaBurma/MyanmarCabo VerdeCambodiaCameroonCanadaCaribbeanCentral AmericaChileChinaColombiaCongoCosta RicaCroatiaCubaCzechoslovakiaDenmarkDominicaDominican RepublicEastern AfricaEastern AsiaEastern EuropeEcuadorEgyptEl SalvadorEnglandEritreaEthiopiaEuropeFijiFranceGermanyGhanaGreeceGrenadaGuatemalaGuyanaHaitiHondurasHong KongHungaryIndiaIndonesiaIranIraqIrelandIsraelItalyJamaicaJapanJordanKazakhstanKenyaKoreaKuwaitLaosLatin AmericaLatviaLebanonLiberiaLithuaniaMexicoMicronesiaMiddle AfricaMoldovaMoroccoNepalNetherlandsNicaraguaNigeriaNorth AmericaNorth MacedoniaNorthern AfricaNorthern EuropeNorwayOceaniaPakistanPanamaPeruPhilippinesPolandPortugalRomaniaRussiaSaudi ArabiaScotlandSenegalSerbiaSierra LeoneSingaporeSomaliaSouth AfricaSouth AmericaSouth Central AsiaSouth Eastern AsiaSouthern EuropeSpainSri LankaSt. Vincent and the GrenadinesSudanSwedenSwitzerlandSyriaTaiwanThailandTrinidad and TobagoTurkeyUgandaUkraineUruguayUzbekistanVenezuelaVietnamWest IndiesWestern AfricaWestern AsiaWestern EuropeYemenZaireZimbabweAzores
2 or more Vehicles in Household
Income
Poverty
Unemployment
Labor Participation
Family Structure
Vehicle Availability
Education Level
Disability

2 or more Vehicles in Household Comparison

Immigrants from Malaysia

Immigrants from Honduras

Tragic
Tragic
52.7%
2 OR MORE VEHICLES IN HOUSEHOLD
0.8/ 100
METRIC RATING
254th/ 347
METRIC RANK
51.8%
2 OR MORE VEHICLES IN HOUSEHOLD
0.2/ 100
METRIC RATING
275th/ 347
METRIC RANK

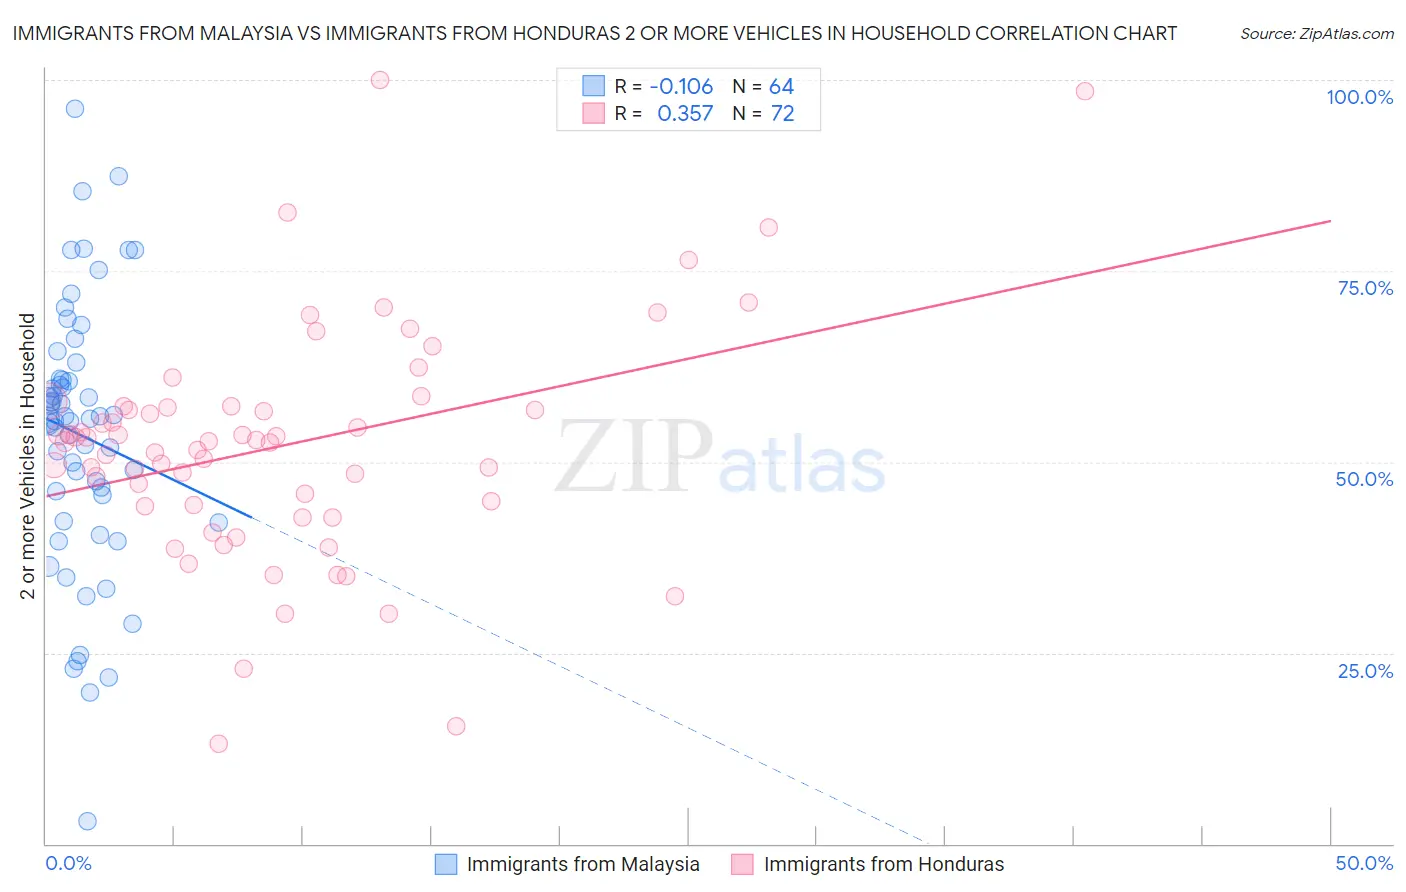
Immigrants from Malaysia vs Immigrants from Honduras 2 or more Vehicles in Household Correlation Chart

The statistical analysis conducted on geographies consisting of 197,930,354 people shows a poor negative correlation between the proportion of Immigrants from Malaysia and percentage of households with 2 or more vehicles available in the United States with a correlation coefficient (R) of -0.106 and weighted average of 52.7%. Similarly, the statistical analysis conducted on geographies consisting of 322,483,271 people shows a mild positive correlation between the proportion of Immigrants from Honduras and percentage of households with 2 or more vehicles available in the United States with a correlation coefficient (R) of 0.357 and weighted average of 51.8%, a difference of 1.6%.
Immigrants from Malaysia vs Immigrants from Honduras 2 or more Vehicles in Household

2 or more Vehicles in Household Correlation Summary

MeasurementImmigrants from MalaysiaImmigrants from Honduras
Minimum2.9%13.2%
Maximum96.2%100.0%
Range93.3%86.8%
Mean53.5%52.1%
Median55.5%52.7%
Interquartile 25% (IQ1)43.9%44.2%
Interquartile 75% (IQ3)60.8%57.2%
Interquartile Range (IQR)16.9%12.9%
Standard Deviation (Sample)17.5%15.3%
Standard Deviation (Population)17.3%15.2%

Similar Demographics by 2 or more Vehicles in Household

Demographics Similar to Immigrants from Malaysia by 2 or more Vehicles in Household

In terms of 2 or more vehicles in household, the demographic groups most similar to Immigrants from Malaysia are Uruguayan (52.7%, a difference of 0.030%), Immigrants from Eritrea (52.6%, a difference of 0.070%), Nigerian (52.8%, a difference of 0.19%), Immigrants from Hong Kong (52.6%, a difference of 0.21%), and Immigrants from Portugal (52.8%, a difference of 0.24%).
DemographicsRating | Rank2 or more Vehicles in Household
Sierra Leoneans
1.2
/100
|
#247
Tragic
52.9%
Colombians
1.1
/100
|
#248
Tragic
52.9%
Immigrants | Brazil
1.0
/100
|
#249
Tragic
52.8%
Mongolians
1.0
/100
|
#250
Tragic
52.8%
Immigrants | Sudan
1.0
/100
|
#251
Tragic
52.8%
Immigrants | Portugal
1.0
/100
|
#252
Tragic
52.8%
Nigerians
0.9
/100
|
#253
Tragic
52.8%
Immigrants | Malaysia
0.8
/100
|
#254
Tragic
52.7%
Uruguayans
0.7
/100
|
#255
Tragic
52.7%
Immigrants | Eritrea
0.7
/100
|
#256
Tragic
52.6%
Immigrants | Hong Kong
0.6
/100
|
#257
Tragic
52.6%
Central American Indians
0.6
/100
|
#258
Tragic
52.5%
Alsatians
0.6
/100
|
#259
Tragic
52.5%
Immigrants | Bahamas
0.5
/100
|
#260
Tragic
52.5%
Immigrants | Australia
0.5
/100
|
#261
Tragic
52.4%

Demographics Similar to Immigrants from Honduras by 2 or more Vehicles in Household

In terms of 2 or more vehicles in household, the demographic groups most similar to Immigrants from Honduras are African (51.8%, a difference of 0.020%), Immigrants from Croatia (51.8%, a difference of 0.030%), Israeli (51.9%, a difference of 0.060%), Immigrants from Africa (51.8%, a difference of 0.080%), and Yuman (51.7%, a difference of 0.14%).
DemographicsRating | Rank2 or more Vehicles in Household
Pima
0.2
/100
|
#268
Tragic
52.0%
Hondurans
0.2
/100
|
#269
Tragic
52.0%
Immigrants | Ireland
0.2
/100
|
#270
Tragic
52.0%
South Americans
0.2
/100
|
#271
Tragic
51.9%
Sub-Saharan Africans
0.2
/100
|
#272
Tragic
51.9%
Israelis
0.2
/100
|
#273
Tragic
51.9%
Africans
0.2
/100
|
#274
Tragic
51.8%
Immigrants | Honduras
0.2
/100
|
#275
Tragic
51.8%
Immigrants | Croatia
0.2
/100
|
#276
Tragic
51.8%
Immigrants | Africa
0.2
/100
|
#277
Tragic
51.8%
Yuman
0.1
/100
|
#278
Tragic
51.7%
Liberians
0.1
/100
|
#279
Tragic
51.7%
Immigrants | Eastern Europe
0.1
/100
|
#280
Tragic
51.7%
Immigrants | Kazakhstan
0.1
/100
|
#281
Tragic
51.6%
Bahamians
0.1
/100
|
#282
Tragic
51.5%