Egyptian vs Liberian 2 or more Vehicles in Household

COMPARE

Egyptian
Race
Ancestry
AfghanAfricanAlaska NativeAlaskan AthabascanAlbanianAleutAlsatianAmericanApacheArabArapahoArgentineanArmenianAssyrian/Chaldean/SyriacAustralianAustrianBahamianBangladeshiBarbadianBasqueBelgianBelizeanBermudanBhutaneseBlackfeetBolivianBrazilianBritishBritish West IndianBulgarianBurmeseCajunCambodianCanadianCape VerdeanCarpatho RusynCelticCentral AmericanCentral American IndianCherokeeCheyenneChickasawChileanChineseChippewaChoctawColombianColvilleComancheCosta RicanCreeCreekCroatianCrowCubanCypriotCzechCzechoslovakianDanishDelawareDominicanDutchDutch West IndianEastern EuropeanEcuadorianEgyptianEnglishEstonianEthiopianEuropeanFijianFilipinoFinnishFrenchFrench American IndianFrench CanadianGermanGerman RussianGhanaianGreekGuamanian/ChamorroGuatemalanGuyaneseHaitianHmongHonduranHopiHoumaHungarianIcelanderIndian (Asian)IndonesianInupiatIranianIraqiIrishIroquoisIsraeliItalianJamaicanJapaneseJordanianKenyanKiowaKoreanLaotianLatvianLebaneseLithuanianLumbeeLuxembourgerMacedonianMalaysianMalteseMarshalleseMenomineeMexicanMexican American IndianMongolianMoroccanNative HawaiianNavajoNepaleseNew ZealanderNicaraguanNigerianNorthern EuropeanNorwegianOkinawanOsageOttawaPaiutePakistaniPalestinianPanamanianParaguayanPennsylvania GermanPeruvianPimaPolishPortuguesePotawatomiPuebloPuerto RicanPuget Sound SalishRomanianRussianSalvadoranSamoanScandinavianScotch-IrishScottishSeminoleSenegaleseSerbianShoshoneSierra LeoneanSiouxSlavicSlovakSloveneSomaliSouth AfricanSouth AmericanSouth American IndianSoviet UnionSpaniardSpanishSpanish AmericanSpanish American IndianSri LankanSubsaharan AfricanSudaneseSwedishSwissSyrianTaiwaneseThaiTlingit-HaidaTohono O'OdhamTonganTrinidadian and TobagonianTsimshianTurkishU.S. Virgin IslanderUgandanUkrainianUruguayanUteVenezuelanVietnameseWelshWest IndianYakamaYaquiYugoslavianYumanYup'ikZimbabwean
Immigration
NonimmigrantsImmigrantsAfghanistanAfricaAlbaniaArgentinaArmeniaAsiaAustraliaAustriaBahamasBangladeshBarbadosBelarusBelgiumBelizeBoliviaBosnia and HerzegovinaBrazilBulgariaBurma/MyanmarCabo VerdeCambodiaCameroonCanadaCaribbeanCentral AmericaChileChinaColombiaCongoCosta RicaCroatiaCubaCzechoslovakiaDenmarkDominicaDominican RepublicEastern AfricaEastern AsiaEastern EuropeEcuadorEgyptEl SalvadorEnglandEritreaEthiopiaEuropeFijiFranceGermanyGhanaGreeceGrenadaGuatemalaGuyanaHaitiHondurasHong KongHungaryIndiaIndonesiaIranIraqIrelandIsraelItalyJamaicaJapanJordanKazakhstanKenyaKoreaKuwaitLaosLatin AmericaLatviaLebanonLiberiaLithuaniaMalaysiaMexicoMicronesiaMiddle AfricaMoldovaMoroccoNepalNetherlandsNicaraguaNigeriaNorth AmericaNorth MacedoniaNorthern AfricaNorthern EuropeNorwayOceaniaPakistanPanamaPeruPhilippinesPolandPortugalRomaniaRussiaSaudi ArabiaScotlandSenegalSerbiaSierra LeoneSingaporeSomaliaSouth AfricaSouth AmericaSouth Central AsiaSouth Eastern AsiaSouthern EuropeSpainSri LankaSt. Vincent and the GrenadinesSudanSwedenSwitzerlandSyriaTaiwanThailandTrinidad and TobagoTurkeyUgandaUkraineUruguayUzbekistanVenezuelaVietnamWest IndiesWestern AfricaWestern AsiaWestern EuropeYemenZaireZimbabweAzores
Liberian
Race
Ancestry
AfghanAfricanAlaska NativeAlaskan AthabascanAlbanianAleutAlsatianAmericanApacheArabArapahoArgentineanArmenianAssyrian/Chaldean/SyriacAustralianAustrianBahamianBangladeshiBarbadianBasqueBelgianBelizeanBermudanBhutaneseBlackfeetBolivianBrazilianBritishBritish West IndianBulgarianBurmeseCajunCambodianCanadianCape VerdeanCarpatho RusynCelticCentral AmericanCentral American IndianCherokeeCheyenneChickasawChileanChineseChippewaChoctawColombianColvilleComancheCosta RicanCreeCreekCroatianCrowCubanCypriotCzechCzechoslovakianDanishDelawareDominicanDutchDutch West IndianEastern EuropeanEcuadorianEnglishEstonianEthiopianEuropeanFijianFilipinoFinnishFrenchFrench American IndianFrench CanadianGermanGerman RussianGhanaianGreekGuamanian/ChamorroGuatemalanGuyaneseHaitianHmongHonduranHopiHoumaHungarianIcelanderIndian (Asian)IndonesianInupiatIranianIraqiIrishIroquoisIsraeliItalianJamaicanJapaneseJordanianKenyanKiowaKoreanLaotianLatvianLebaneseLiberianLithuanianLumbeeLuxembourgerMacedonianMalaysianMalteseMarshalleseMenomineeMexicanMexican American IndianMongolianMoroccanNative HawaiianNavajoNepaleseNew ZealanderNicaraguanNigerianNorthern EuropeanNorwegianOkinawanOsageOttawaPaiutePakistaniPalestinianPanamanianParaguayanPennsylvania GermanPeruvianPimaPolishPortuguesePotawatomiPuebloPuerto RicanPuget Sound SalishRomanianRussianSalvadoranSamoanScandinavianScotch-IrishScottishSeminoleSenegaleseSerbianShoshoneSierra LeoneanSiouxSlavicSlovakSloveneSomaliSouth AfricanSouth AmericanSouth American IndianSoviet UnionSpaniardSpanishSpanish AmericanSpanish American IndianSri LankanSubsaharan AfricanSudaneseSwedishSwissSyrianTaiwaneseThaiTlingit-HaidaTohono O'OdhamTonganTrinidadian and TobagonianTsimshianTurkishU.S. Virgin IslanderUgandanUkrainianUruguayanUteVenezuelanVietnameseWelshWest IndianYakamaYaquiYugoslavianYumanYup'ikZimbabwean
Immigration
NonimmigrantsImmigrantsAfghanistanAfricaAlbaniaArgentinaArmeniaAsiaAustraliaAustriaBahamasBangladeshBarbadosBelarusBelgiumBelizeBoliviaBosnia and HerzegovinaBrazilBulgariaBurma/MyanmarCabo VerdeCambodiaCameroonCanadaCaribbeanCentral AmericaChileChinaColombiaCongoCosta RicaCroatiaCubaCzechoslovakiaDenmarkDominicaDominican RepublicEastern AfricaEastern AsiaEastern EuropeEcuadorEgyptEl SalvadorEnglandEritreaEthiopiaEuropeFijiFranceGermanyGhanaGreeceGrenadaGuatemalaGuyanaHaitiHondurasHong KongHungaryIndiaIndonesiaIranIraqIrelandIsraelItalyJamaicaJapanJordanKazakhstanKenyaKoreaKuwaitLaosLatin AmericaLatviaLebanonLiberiaLithuaniaMalaysiaMexicoMicronesiaMiddle AfricaMoldovaMoroccoNepalNetherlandsNicaraguaNigeriaNorth AmericaNorth MacedoniaNorthern AfricaNorthern EuropeNorwayOceaniaPakistanPanamaPeruPhilippinesPolandPortugalRomaniaRussiaSaudi ArabiaScotlandSenegalSerbiaSierra LeoneSingaporeSomaliaSouth AfricaSouth AmericaSouth Central AsiaSouth Eastern AsiaSouthern EuropeSpainSri LankaSt. Vincent and the GrenadinesSudanSwedenSwitzerlandSyriaTaiwanThailandTrinidad and TobagoTurkeyUgandaUkraineUruguayUzbekistanVenezuelaVietnamWest IndiesWestern AfricaWestern AsiaWestern EuropeYemenZaireZimbabweAzores
2 or more Vehicles in Household
Income
Poverty
Unemployment
Labor Participation
Family Structure
Vehicle Availability
Education Level
Disability

2 or more Vehicles in Household Comparison

Egyptians

Liberians

Poor
Tragic
54.3%
2 OR MORE VEHICLES IN HOUSEHOLD
12.0/ 100
METRIC RATING
208th/ 347
METRIC RANK
51.7%
2 OR MORE VEHICLES IN HOUSEHOLD
0.1/ 100
METRIC RATING
279th/ 347
METRIC RANK

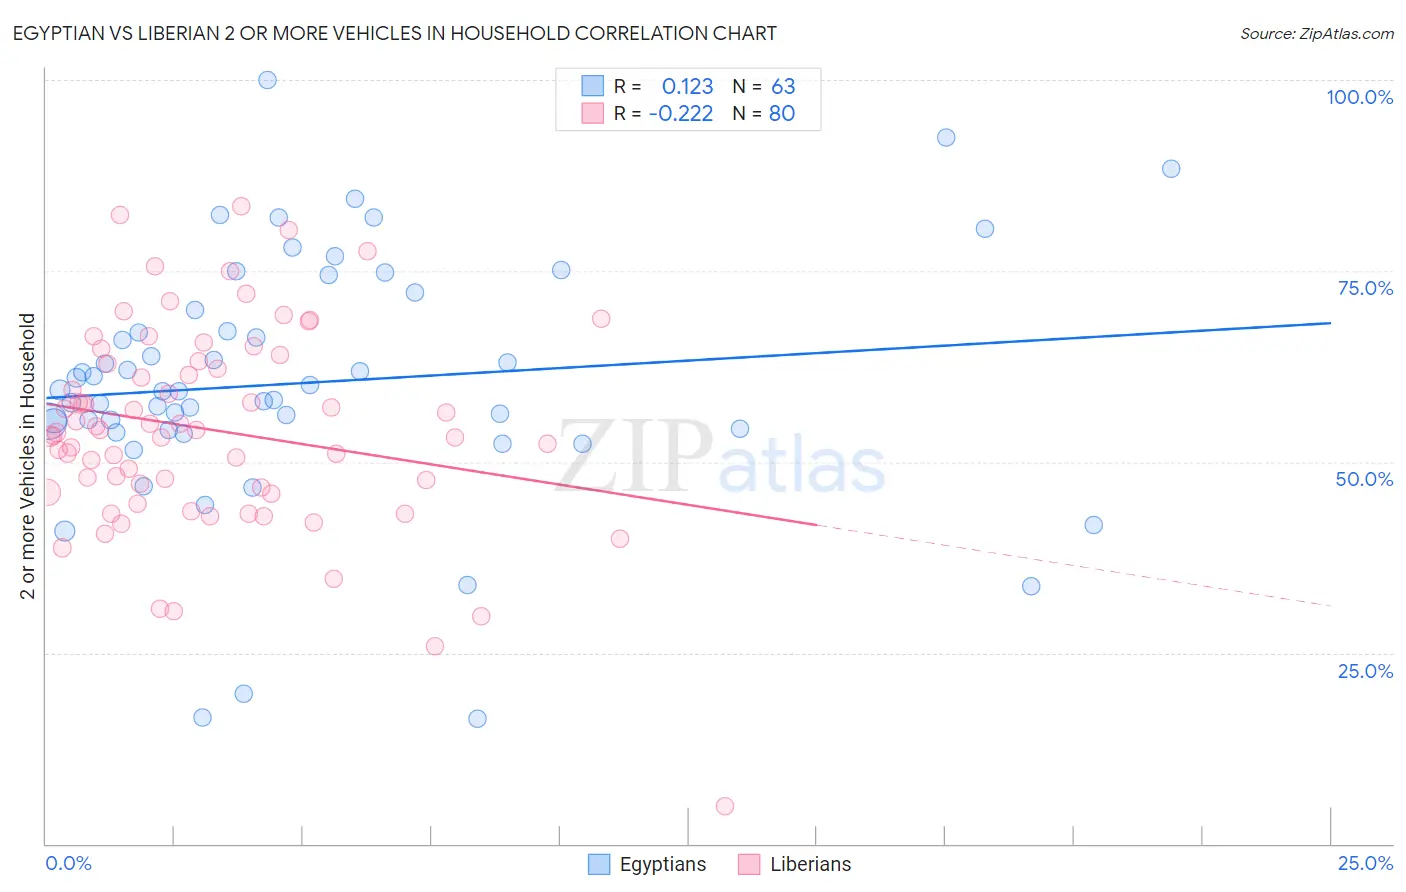
Egyptian vs Liberian 2 or more Vehicles in Household Correlation Chart

The statistical analysis conducted on geographies consisting of 276,797,335 people shows a poor positive correlation between the proportion of Egyptians and percentage of households with 2 or more vehicles available in the United States with a correlation coefficient (R) of 0.123 and weighted average of 54.3%. Similarly, the statistical analysis conducted on geographies consisting of 118,047,251 people shows a weak negative correlation between the proportion of Liberians and percentage of households with 2 or more vehicles available in the United States with a correlation coefficient (R) of -0.222 and weighted average of 51.7%, a difference of 4.9%.
Egyptian vs Liberian 2 or more Vehicles in Household

2 or more Vehicles in Household Correlation Summary

MeasurementEgyptianLiberian
Minimum16.3%4.9%
Maximum100.0%83.5%
Range83.7%78.6%
Mean60.4%54.2%
Median59.3%54.0%
Interquartile 25% (IQ1)54.2%46.3%
Interquartile 75% (IQ3)69.9%63.0%
Interquartile Range (IQR)15.6%16.7%
Standard Deviation (Sample)16.3%13.4%
Standard Deviation (Population)16.2%13.3%

Similar Demographics by 2 or more Vehicles in Household

Demographics Similar to Egyptians by 2 or more Vehicles in Household

In terms of 2 or more vehicles in household, the demographic groups most similar to Egyptians are Immigrants from Bulgaria (54.3%, a difference of 0.0%), Immigrants from Saudi Arabia (54.2%, a difference of 0.060%), Immigrants from Hungary (54.2%, a difference of 0.070%), Turkish (54.3%, a difference of 0.090%), and Immigrants from Chile (54.2%, a difference of 0.090%).
DemographicsRating | Rank2 or more Vehicles in Household
Immigrants | Italy
15.5
/100
|
#201
Poor
54.4%
Immigrants | North Macedonia
14.9
/100
|
#202
Poor
54.4%
Immigrants | Peru
14.3
/100
|
#203
Poor
54.4%
Immigrants | Belgium
13.7
/100
|
#204
Poor
54.3%
Cheyenne
13.6
/100
|
#205
Poor
54.3%
Immigrants | Latin America
13.1
/100
|
#206
Poor
54.3%
Turks
13.0
/100
|
#207
Poor
54.3%
Egyptians
12.0
/100
|
#208
Poor
54.3%
Immigrants | Bulgaria
12.0
/100
|
#209
Poor
54.3%
Immigrants | Saudi Arabia
11.3
/100
|
#210
Poor
54.2%
Immigrants | Hungary
11.3
/100
|
#211
Poor
54.2%
Immigrants | Chile
11.1
/100
|
#212
Poor
54.2%
Guatemalans
9.6
/100
|
#213
Tragic
54.1%
Immigrants | Czechoslovakia
9.4
/100
|
#214
Tragic
54.1%
Aleuts
9.3
/100
|
#215
Tragic
54.1%

Demographics Similar to Liberians by 2 or more Vehicles in Household

In terms of 2 or more vehicles in household, the demographic groups most similar to Liberians are Yuman (51.7%, a difference of 0.010%), Immigrants from Eastern Europe (51.7%, a difference of 0.030%), Immigrants from Africa (51.8%, a difference of 0.070%), Immigrants from Croatia (51.8%, a difference of 0.13%), and Immigrants from Honduras (51.8%, a difference of 0.15%).
DemographicsRating | Rank2 or more Vehicles in Household
Sub-Saharan Africans
0.2
/100
|
#272
Tragic
51.9%
Israelis
0.2
/100
|
#273
Tragic
51.9%
Africans
0.2
/100
|
#274
Tragic
51.8%
Immigrants | Honduras
0.2
/100
|
#275
Tragic
51.8%
Immigrants | Croatia
0.2
/100
|
#276
Tragic
51.8%
Immigrants | Africa
0.2
/100
|
#277
Tragic
51.8%
Yuman
0.1
/100
|
#278
Tragic
51.7%
Liberians
0.1
/100
|
#279
Tragic
51.7%
Immigrants | Eastern Europe
0.1
/100
|
#280
Tragic
51.7%
Immigrants | Kazakhstan
0.1
/100
|
#281
Tragic
51.6%
Bahamians
0.1
/100
|
#282
Tragic
51.5%
Immigrants | China
0.1
/100
|
#283
Tragic
51.5%
Immigrants | Zaire
0.1
/100
|
#284
Tragic
51.5%
Immigrants | Uruguay
0.1
/100
|
#285
Tragic
51.4%
Immigrants | Liberia
0.1
/100
|
#286
Tragic
51.3%