Cities with the Highest Percentage of Immigrants from Northern Europe in Maryland
RELATED REPORTS & OPTIONS
Northern Europe
Maryland
Compare Cities
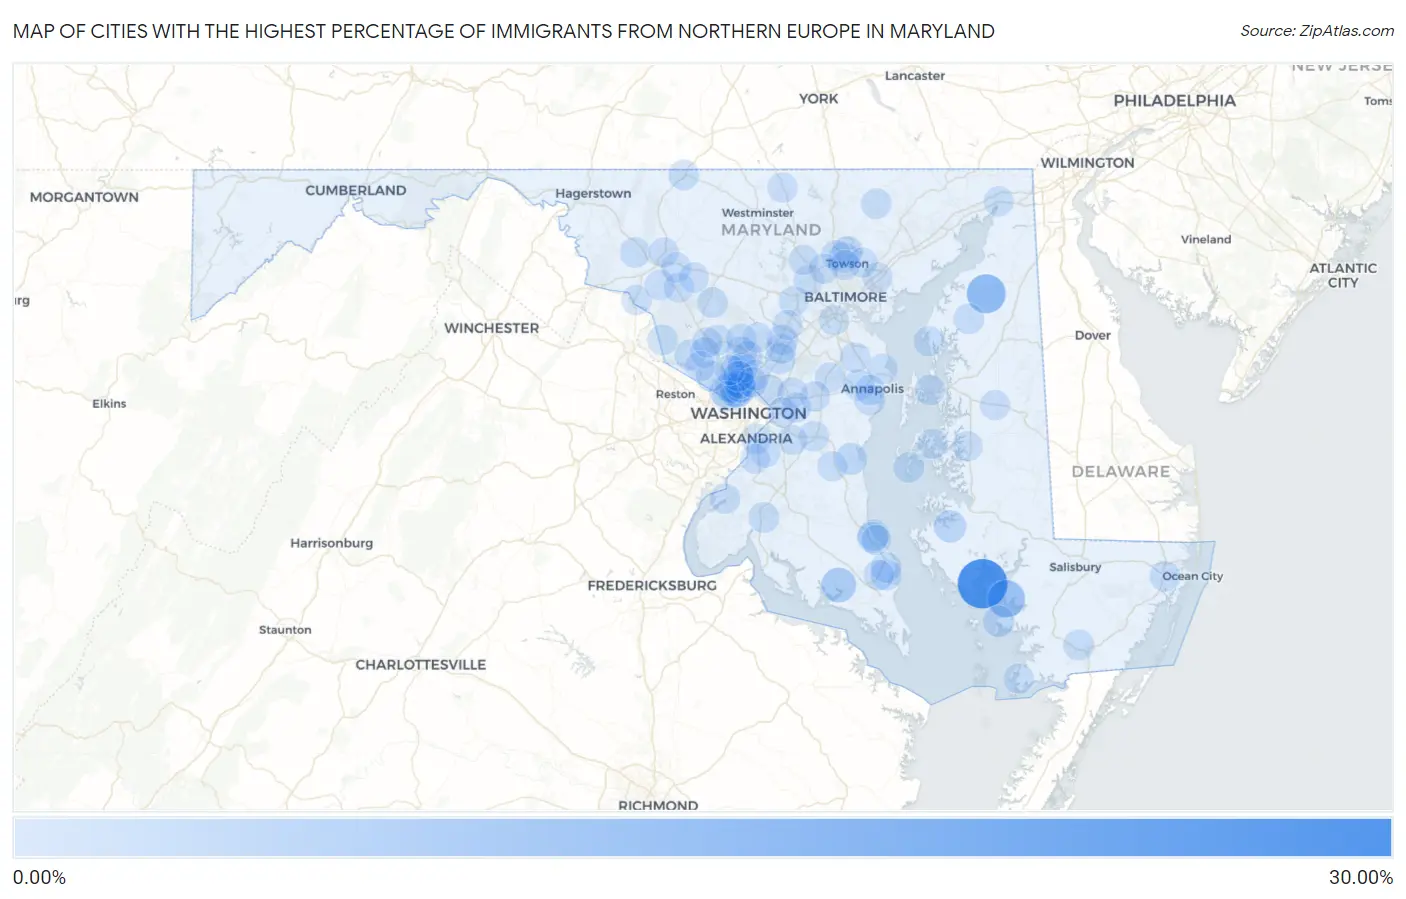
Map of Cities with the Highest Percentage of Immigrants from Northern Europe in Maryland
0.00%
30.00%
Cities with the Highest Percentage of Immigrants from Northern Europe in Maryland
| City | Northern Europe | vs State | vs National | |
| 1. | Elliott | 28.57% | 0.28%(+28.3)#1 | 0.29%(+28.3)#2 |
| 2. | Kennedyville | 12.72% | 0.28%(+12.4)#2 | 0.29%(+12.4)#19 |
| 3. | Nanticoke Acres | 10.69% | 0.28%(+10.4)#3 | 0.29%(+10.4)#28 |
| 4. | Leonardtown | 6.59% | 0.28%(+6.30)#4 | 0.29%(+6.30)#61 |
| 5. | Callaway | 3.87% | 0.28%(+3.58)#5 | 0.29%(+3.58)#169 |
| 6. | Church Creek | 3.33% | 0.28%(+3.05)#6 | 0.29%(+3.05)#230 |
| 7. | North Chevy Chase | 2.50% | 0.28%(+2.21)#7 | 0.29%(+2.21)#390 |
| 8. | Friendship | 2.45% | 0.28%(+2.17)#8 | 0.29%(+2.17)#399 |
| 9. | Chance | 2.25% | 0.28%(+1.96)#9 | 0.29%(+1.96)#445 |
| 10. | Leisure World | 2.22% | 0.28%(+1.93)#10 | 0.29%(+1.93)#455 |
| 11. | Calvert Beach | 2.05% | 0.28%(+1.76)#11 | 0.29%(+1.76)#518 |
| 12. | Chevy Chase Village | 1.96% | 0.28%(+1.68)#12 | 0.29%(+1.68)#555 |
| 13. | Somerset | 1.95% | 0.28%(+1.66)#13 | 0.29%(+1.66)#564 |
| 14. | Glen Echo | 1.77% | 0.28%(+1.49)#14 | 0.29%(+1.49)#642 |
| 15. | Parole | 1.75% | 0.28%(+1.47)#15 | 0.29%(+1.47)#653 |
| 16. | South Kensington | 1.60% | 0.28%(+1.32)#16 | 0.29%(+1.32)#751 |
| 17. | Garrett Park | 1.59% | 0.28%(+1.31)#17 | 0.29%(+1.31)#756 |
| 18. | Wildewood | 1.55% | 0.28%(+1.26)#18 | 0.29%(+1.26)#783 |
| 19. | Chevy Chase Section Five | 1.51% | 0.28%(+1.22)#19 | 0.29%(+1.22)#818 |
| 20. | Darnestown | 1.44% | 0.28%(+1.15)#20 | 0.29%(+1.15)#877 |
| 21. | St Leonard | 1.32% | 0.28%(+1.04)#21 | 0.29%(+1.04)#987 |
| 22. | Drum Point | 1.24% | 0.28%(+0.957)#22 | 0.29%(+0.957)#1,076 |
| 23. | Konterra | 1.22% | 0.28%(+0.939)#23 | 0.29%(+0.939)#1,105 |
| 24. | Tilghman Island | 1.21% | 0.28%(+0.926)#24 | 0.29%(+0.925)#1,119 |
| 25. | La Plata | 1.18% | 0.28%(+0.892)#25 | 0.29%(+0.891)#1,168 |
| 26. | Washington Grove | 1.16% | 0.28%(+0.874)#26 | 0.29%(+0.874)#1,195 |
| 27. | West Pocomoke | 1.12% | 0.28%(+0.839)#27 | 0.29%(+0.838)#1,249 |
| 28. | Jarrettsville | 1.12% | 0.28%(+0.836)#28 | 0.29%(+0.835)#1,252 |
| 29. | University Park | 1.11% | 0.28%(+0.826)#29 | 0.29%(+0.826)#1,268 |
| 30. | Emmitsburg | 1.10% | 0.28%(+0.815)#30 | 0.29%(+0.815)#1,278 |
| 31. | Friendship Heights Village | 1.09% | 0.28%(+0.804)#31 | 0.29%(+0.804)#1,299 |
| 32. | Chestertown | 1.07% | 0.28%(+0.784)#32 | 0.29%(+0.783)#1,343 |
| 33. | Berlin | 1.07% | 0.28%(+0.783)#33 | 0.29%(+0.783)#1,344 |
| 34. | Damascus | 1.04% | 0.28%(+0.760)#34 | 0.29%(+0.759)#1,384 |
| 35. | Kent Narrows | 1.04% | 0.28%(+0.753)#35 | 0.29%(+0.753)#1,396 |
| 36. | Scaggsville | 1.03% | 0.28%(+0.744)#36 | 0.29%(+0.743)#1,422 |
| 37. | Martin S Additions | 1.01% | 0.28%(+0.722)#37 | 0.29%(+0.722)#1,456 |
| 38. | Lusby | 0.98% | 0.28%(+0.694)#38 | 0.29%(+0.693)#1,512 |
| 39. | Poolesville | 0.91% | 0.28%(+0.630)#39 | 0.29%(+0.629)#1,649 |
| 40. | Timonium | 0.89% | 0.28%(+0.605)#40 | 0.29%(+0.604)#1,710 |
| 41. | Bethesda | 0.86% | 0.28%(+0.575)#41 | 0.29%(+0.574)#1,793 |
| 42. | Potomac Heights | 0.86% | 0.28%(+0.573)#42 | 0.29%(+0.572)#1,801 |
| 43. | Four Corners | 0.85% | 0.28%(+0.565)#43 | 0.29%(+0.564)#1,817 |
| 44. | Middletown | 0.84% | 0.28%(+0.559)#44 | 0.29%(+0.558)#1,840 |
| 45. | Layhill | 0.83% | 0.28%(+0.549)#45 | 0.29%(+0.548)#1,865 |
| 46. | Lutherville | 0.82% | 0.28%(+0.534)#46 | 0.29%(+0.533)#1,913 |
| 47. | Solomons | 0.80% | 0.28%(+0.518)#47 | 0.29%(+0.517)#1,949 |
| 48. | Annapolis Neck | 0.79% | 0.28%(+0.510)#48 | 0.29%(+0.509)#1,975 |
| 49. | Potomac | 0.73% | 0.28%(+0.444)#49 | 0.29%(+0.444)#2,164 |
| 50. | West Laurel | 0.72% | 0.28%(+0.431)#50 | 0.29%(+0.430)#2,210 |
| 51. | Wheaton | 0.70% | 0.28%(+0.420)#51 | 0.29%(+0.419)#2,239 |
| 52. | Easton | 0.70% | 0.28%(+0.416)#52 | 0.29%(+0.416)#2,254 |
| 53. | Chevy Chase | 0.68% | 0.28%(+0.400)#53 | 0.29%(+0.399)#2,314 |
| 54. | Cape St Claire | 0.68% | 0.28%(+0.399)#54 | 0.29%(+0.399)#2,317 |
| 55. | Upper Marlboro | 0.66% | 0.28%(+0.374)#55 | 0.29%(+0.373)#2,413 |
| 56. | Buckeystown | 0.65% | 0.28%(+0.363)#56 | 0.29%(+0.362)#2,451 |
| 57. | Severna Park | 0.65% | 0.28%(+0.360)#57 | 0.29%(+0.360)#2,461 |
| 58. | Chevy Chase View | 0.62% | 0.28%(+0.339)#58 | 0.29%(+0.338)#2,544 |
| 59. | Rock Hall | 0.62% | 0.28%(+0.333)#59 | 0.29%(+0.333)#2,566 |
| 60. | Annapolis | 0.61% | 0.28%(+0.329)#60 | 0.29%(+0.329)#2,584 |
| 61. | Forest Heights | 0.61% | 0.28%(+0.321)#61 | 0.29%(+0.320)#2,624 |
| 62. | Linthicum | 0.61% | 0.28%(+0.321)#62 | 0.29%(+0.320)#2,625 |
| 63. | Lanham | 0.60% | 0.28%(+0.315)#63 | 0.29%(+0.315)#2,642 |
| 64. | North Potomac | 0.58% | 0.28%(+0.298)#64 | 0.29%(+0.298)#2,729 |
| 65. | Ellicott City | 0.56% | 0.28%(+0.276)#65 | 0.29%(+0.276)#2,842 |
| 66. | Bartonsville | 0.55% | 0.28%(+0.263)#66 | 0.29%(+0.262)#2,910 |
| 67. | Brookmont | 0.54% | 0.28%(+0.251)#67 | 0.29%(+0.251)#2,963 |
| 68. | Rossville | 0.53% | 0.28%(+0.244)#68 | 0.29%(+0.244)#2,999 |
| 69. | St Michaels | 0.53% | 0.28%(+0.240)#69 | 0.29%(+0.240)#3,019 |
| 70. | Olney | 0.52% | 0.28%(+0.236)#70 | 0.29%(+0.235)#3,039 |
| 71. | Silver Spring | 0.52% | 0.28%(+0.235)#71 | 0.29%(+0.234)#3,050 |
| 72. | Peppermill Village | 0.51% | 0.28%(+0.230)#72 | 0.29%(+0.229)#3,076 |
| 73. | Point Of Rocks | 0.51% | 0.28%(+0.224)#73 | 0.29%(+0.223)#3,099 |
| 74. | Queen Anne | 0.51% | 0.28%(+0.220)#74 | 0.29%(+0.220)#3,117 |
| 75. | North Bethesda | 0.50% | 0.28%(+0.218)#75 | 0.29%(+0.217)#3,126 |
| 76. | Urbana | 0.49% | 0.28%(+0.209)#76 | 0.29%(+0.208)#3,178 |
| 77. | North East | 0.49% | 0.28%(+0.208)#77 | 0.29%(+0.207)#3,184 |
| 78. | Crisfield | 0.49% | 0.28%(+0.206)#78 | 0.29%(+0.205)#3,190 |
| 79. | Dunkirk | 0.48% | 0.28%(+0.198)#79 | 0.29%(+0.198)#3,235 |
| 80. | Melwood | 0.47% | 0.28%(+0.181)#80 | 0.29%(+0.180)#3,346 |
| 81. | Mays Chapel | 0.46% | 0.28%(+0.171)#81 | 0.29%(+0.171)#3,390 |
| 82. | Long Beach | 0.45% | 0.28%(+0.169)#82 | 0.29%(+0.169)#3,407 |
| 83. | Milford Mill | 0.45% | 0.28%(+0.169)#83 | 0.29%(+0.168)#3,414 |
| 84. | Crofton | 0.45% | 0.28%(+0.168)#84 | 0.29%(+0.168)#3,418 |
| 85. | Manchester | 0.44% | 0.28%(+0.159)#85 | 0.29%(+0.159)#3,481 |
| 86. | Carney | 0.44% | 0.28%(+0.151)#86 | 0.29%(+0.151)#3,532 |
| 87. | Columbia | 0.42% | 0.28%(+0.131)#87 | 0.29%(+0.130)#3,670 |
| 88. | Ashton Sandy Spring | 0.41% | 0.28%(+0.128)#88 | 0.29%(+0.127)#3,696 |
| 89. | Towson | 0.41% | 0.28%(+0.127)#89 | 0.29%(+0.126)#3,705 |
| 90. | Bowie | 0.41% | 0.28%(+0.126)#90 | 0.29%(+0.126)#3,709 |
| 91. | Pikesville | 0.39% | 0.28%(+0.102)#91 | 0.29%(+0.102)#3,909 |
| 92. | Travilah | 0.38% | 0.28%(+0.093)#92 | 0.29%(+0.093)#3,982 |
| 93. | Friendly | 0.38% | 0.28%(+0.091)#93 | 0.29%(+0.091)#4,007 |
| 94. | Owings Mills | 0.37% | 0.28%(+0.089)#94 | 0.29%(+0.089)#4,020 |
| 95. | Honeygo | 0.37% | 0.28%(+0.089)#95 | 0.29%(+0.088)#4,028 |
| 96. | Fort Washington | 0.37% | 0.28%(+0.087)#96 | 0.29%(+0.086)#4,045 |
| 97. | Monrovia | 0.37% | 0.28%(+0.084)#97 | 0.29%(+0.084)#4,057 |
| 98. | Lake Arbor | 0.37% | 0.28%(+0.084)#98 | 0.29%(+0.084)#4,058 |
| 99. | Gaithersburg | 0.37% | 0.28%(+0.080)#99 | 0.29%(+0.080)#4,095 |
| 100. | Frederick | 0.36% | 0.28%(+0.079)#100 | 0.29%(+0.078)#4,108 |
Common Questions
What are the Top 10 Cities with the Highest Percentage of Immigrants from Northern Europe in Maryland?
Top 10 Cities with the Highest Percentage of Immigrants from Northern Europe in Maryland are:
#1
28.57%
#2
12.72%
#3
10.69%
#4
6.59%
#5
3.33%
#6
2.50%
#7
2.45%
#8
2.25%
#9
2.22%
#10
2.05%
What city has the Highest Percentage of Immigrants from Northern Europe in Maryland?
Elliott has the Highest Percentage of Immigrants from Northern Europe in Maryland with 28.57%.
What is the Percentage of Immigrants from Northern Europe in the State of Maryland?
Percentage of Immigrants from Northern Europe in Maryland is 0.28%.
What is the Percentage of Immigrants from Northern Europe in the United States?
Percentage of Immigrants from Northern Europe in the United States is 0.29%.