Cities with the Most Immigrants from Cuba in Maryland
RELATED REPORTS & OPTIONS
Cuba
Maryland
Compare Cities
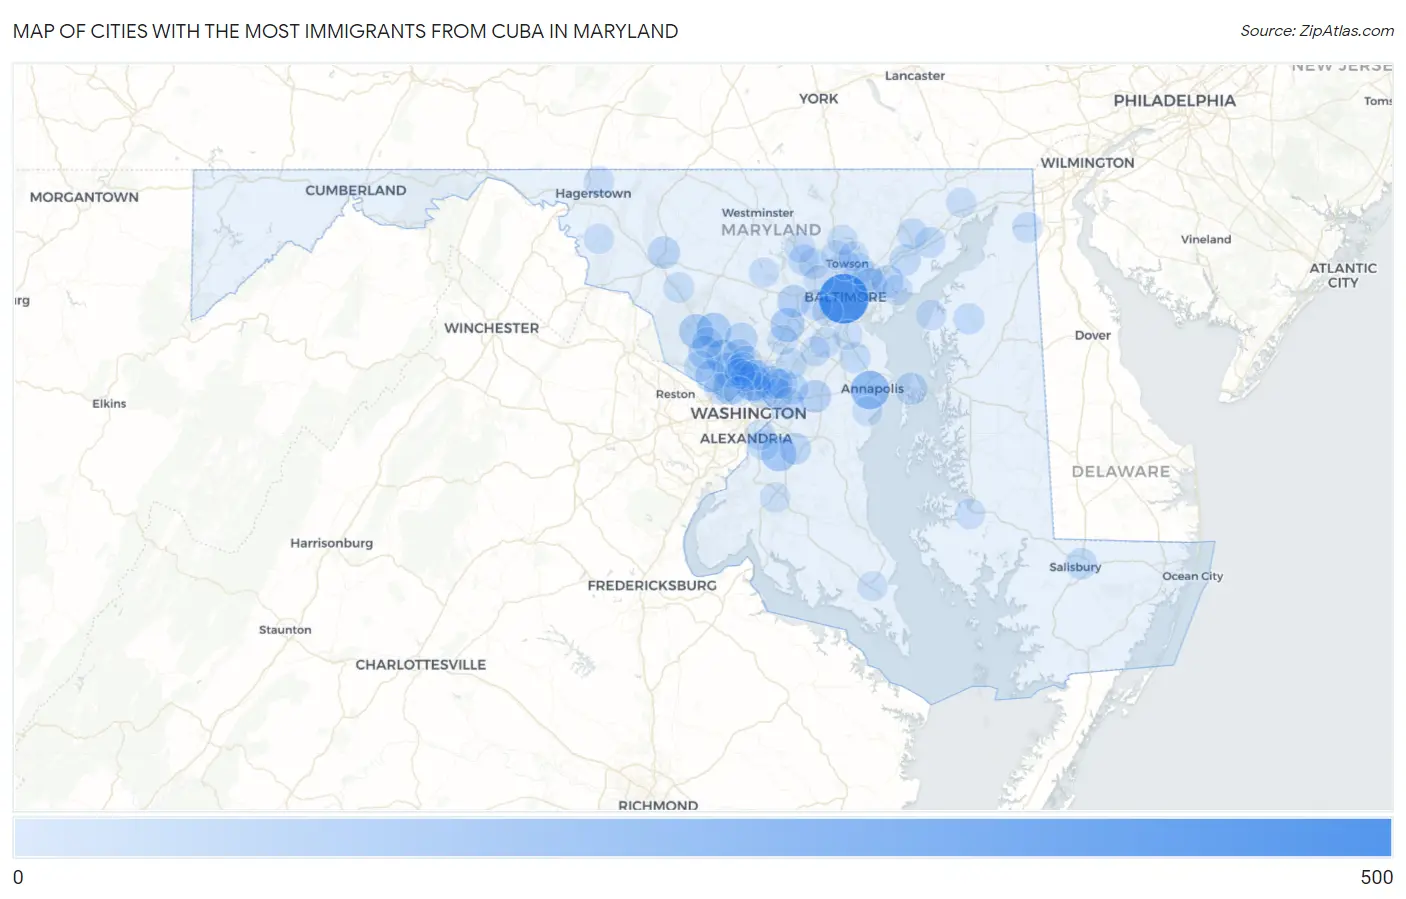
Map of Cities with the Most Immigrants from Cuba in Maryland
0
500
Cities with the Most Immigrants from Cuba in Maryland
| City | Cuba | vs State | vs National | |
| 1. | Baltimore | 418 | 3,238(12.91%)#1 | 1,325,277(0.03%)#247 |
| 2. | Annapolis | 177 | 3,238(5.47%)#2 | 1,325,277(0.01%)#464 |
| 3. | Silver Spring | 131 | 3,238(4.05%)#3 | 1,325,277(0.01%)#573 |
| 4. | Clinton | 105 | 3,238(3.24%)#4 | 1,325,277(0.01%)#682 |
| 5. | North Bethesda | 98 | 3,238(3.03%)#5 | 1,325,277(0.01%)#711 |
| 6. | Montgomery Village | 90 | 3,238(2.78%)#6 | 1,325,277(0.01%)#766 |
| 7. | Germantown | 88 | 3,238(2.72%)#7 | 1,325,277(0.01%)#776 |
| 8. | Columbia | 84 | 3,238(2.59%)#8 | 1,325,277(0.01%)#801 |
| 9. | Bethesda | 82 | 3,238(2.53%)#9 | 1,325,277(0.01%)#816 |
| 10. | North Potomac | 73 | 3,238(2.25%)#10 | 1,325,277(0.01%)#888 |
| 11. | Rosedale | 70 | 3,238(2.16%)#11 | 1,325,277(0.01%)#917 |
| 12. | Rockville | 69 | 3,238(2.13%)#12 | 1,325,277(0.01%)#923 |
| 13. | College Park | 68 | 3,238(2.10%)#13 | 1,325,277(0.01%)#934 |
| 14. | Ellicott City | 56 | 3,238(1.73%)#14 | 1,325,277(0.00%)#1,065 |
| 15. | Bowie | 55 | 3,238(1.70%)#15 | 1,325,277(0.00%)#1,076 |
| 16. | Frederick | 50 | 3,238(1.54%)#16 | 1,325,277(0.00%)#1,143 |
| 17. | Olney | 49 | 3,238(1.51%)#17 | 1,325,277(0.00%)#1,160 |
| 18. | Middle River | 49 | 3,238(1.51%)#18 | 1,325,277(0.00%)#1,164 |
| 19. | Stevensville | 45 | 3,238(1.39%)#19 | 1,325,277(0.00%)#1,236 |
| 20. | Chillum | 44 | 3,238(1.36%)#20 | 1,325,277(0.00%)#1,247 |
| 21. | Aspen Hill | 39 | 3,238(1.20%)#21 | 1,325,277(0.00%)#1,329 |
| 22. | Potomac | 39 | 3,238(1.20%)#22 | 1,325,277(0.00%)#1,332 |
| 23. | Rosaryville | 36 | 3,238(1.11%)#23 | 1,325,277(0.00%)#1,404 |
| 24. | Seabrook | 33 | 3,238(1.02%)#24 | 1,325,277(0.00%)#1,482 |
| 25. | Flower Hill | 33 | 3,238(1.02%)#25 | 1,325,277(0.00%)#1,485 |
| 26. | Cabin John | 31 | 3,238(0.96%)#26 | 1,325,277(0.00%)#1,555 |
| 27. | Salisbury | 30 | 3,238(0.93%)#27 | 1,325,277(0.00%)#1,562 |
| 28. | Joppatowne | 30 | 3,238(0.93%)#28 | 1,325,277(0.00%)#1,571 |
| 29. | Travilah | 30 | 3,238(0.93%)#29 | 1,325,277(0.00%)#1,572 |
| 30. | North Kensington | 30 | 3,238(0.93%)#30 | 1,325,277(0.00%)#1,575 |
| 31. | Bel Air South | 23 | 3,238(0.71%)#31 | 1,325,277(0.00%)#1,745 |
| 32. | Glenmont | 23 | 3,238(0.71%)#32 | 1,325,277(0.00%)#1,766 |
| 33. | Owings Mills | 22 | 3,238(0.68%)#33 | 1,325,277(0.00%)#1,796 |
| 34. | Parkville | 22 | 3,238(0.68%)#34 | 1,325,277(0.00%)#1,798 |
| 35. | Chestertown | 22 | 3,238(0.68%)#35 | 1,325,277(0.00%)#1,810 |
| 36. | Severna Park | 19 | 3,238(0.59%)#36 | 1,325,277(0.00%)#1,925 |
| 37. | South Laurel | 19 | 3,238(0.59%)#37 | 1,325,277(0.00%)#1,931 |
| 38. | Riverside | 18 | 3,238(0.56%)#38 | 1,325,277(0.00%)#1,990 |
| 39. | East Riverdale | 17 | 3,238(0.53%)#39 | 1,325,277(0.00%)#2,024 |
| 40. | Garrison | 16 | 3,238(0.49%)#40 | 1,325,277(0.00%)#2,086 |
| 41. | Hillandale | 16 | 3,238(0.49%)#41 | 1,325,277(0.00%)#2,094 |
| 42. | Severn | 15 | 3,238(0.46%)#42 | 1,325,277(0.00%)#2,112 |
| 43. | Greenbelt | 15 | 3,238(0.46%)#43 | 1,325,277(0.00%)#2,121 |
| 44. | Urbana | 15 | 3,238(0.46%)#44 | 1,325,277(0.00%)#2,136 |
| 45. | Wheaton | 14 | 3,238(0.43%)#45 | 1,325,277(0.00%)#2,165 |
| 46. | Chesapeake City | 14 | 3,238(0.43%)#46 | 1,325,277(0.00%)#2,222 |
| 47. | Oxon Hill | 13 | 3,238(0.40%)#47 | 1,325,277(0.00%)#2,244 |
| 48. | Gaithersburg | 12 | 3,238(0.37%)#48 | 1,325,277(0.00%)#2,296 |
| 49. | Catonsville | 12 | 3,238(0.37%)#49 | 1,325,277(0.00%)#2,303 |
| 50. | Glassmanor | 12 | 3,238(0.37%)#50 | 1,325,277(0.00%)#2,321 |
| 51. | Glenarden | 11 | 3,238(0.34%)#51 | 1,325,277(0.00%)#2,411 |
| 52. | Reisterstown | 10 | 3,238(0.31%)#52 | 1,325,277(0.00%)#2,459 |
| 53. | Bowleys Quarters | 10 | 3,238(0.31%)#53 | 1,325,277(0.00%)#2,491 |
| 54. | Paramount Long Meadow | 10 | 3,238(0.31%)#54 | 1,325,277(0.00%)#2,505 |
| 55. | Towson | 9 | 3,238(0.28%)#55 | 1,325,277(0.00%)#2,525 |
| 56. | Takoma Park | 9 | 3,238(0.28%)#56 | 1,325,277(0.00%)#2,563 |
| 57. | Four Corners | 9 | 3,238(0.28%)#57 | 1,325,277(0.00%)#2,586 |
| 58. | Cockeysville | 8 | 3,238(0.25%)#58 | 1,325,277(0.00%)#2,649 |
| 59. | Arbutus | 8 | 3,238(0.25%)#59 | 1,325,277(0.00%)#2,653 |
| 60. | Cambridge | 8 | 3,238(0.25%)#60 | 1,325,277(0.00%)#2,660 |
| 61. | Berwyn Heights | 8 | 3,238(0.25%)#61 | 1,325,277(0.00%)#2,685 |
| 62. | Forest Glen | 7 | 3,238(0.22%)#62 | 1,325,277(0.00%)#2,758 |
| 63. | Scaggsville | 6 | 3,238(0.19%)#63 | 1,325,277(0.00%)#2,831 |
| 64. | Tolchester | 6 | 3,238(0.19%)#64 | 1,325,277(0.00%)#2,868 |
| 65. | Mays Chapel | 5 | 3,238(0.15%)#65 | 1,325,277(0.00%)#2,892 |
| 66. | Fort Meade | 5 | 3,238(0.15%)#66 | 1,325,277(0.00%)#2,897 |
| 67. | Kensington | 5 | 3,238(0.15%)#67 | 1,325,277(0.00%)#2,917 |
| 68. | Keedysville | 5 | 3,238(0.15%)#68 | 1,325,277(0.00%)#2,933 |
| 69. | Sykesville | 4 | 3,238(0.12%)#69 | 1,325,277(0.00%)#2,983 |
| 70. | Hampton | 3 | 3,238(0.09%)#70 | 1,325,277(0.00%)#3,032 |
| 71. | Waldorf | 2 | 3,238(0.06%)#71 | 1,325,277(0.00%)#3,082 |
| 72. | Lochearn | 2 | 3,238(0.06%)#72 | 1,325,277(0.00%)#3,087 |
| 73. | Overlea | 2 | 3,238(0.06%)#73 | 1,325,277(0.00%)#3,094 |
| 74. | Honeygo | 2 | 3,238(0.06%)#74 | 1,325,277(0.00%)#3,095 |
| 75. | Mayo | 2 | 3,238(0.06%)#75 | 1,325,277(0.00%)#3,098 |
| 76. | Glen Burnie | 1 | 3,238(0.03%)#76 | 1,325,277(0.00%)#3,162 |
| 77. | California | 1 | 3,238(0.03%)#77 | 1,325,277(0.00%)#3,168 |
| 78. | Chevy Chase Village | 1 | 3,238(0.03%)#78 | 1,325,277(0.00%)#3,192 |
| 79. | Port Deposit | 1 | 3,238(0.03%)#79 | 1,325,277(0.00%)#3,209 |
Common Questions
What are the Top 10 Cities with the Most Immigrants from Cuba in Maryland?
Top 10 Cities with the Most Immigrants from Cuba in Maryland are:
#1
418
#2
177
#3
131
#4
105
#5
98
#6
90
#7
88
#8
84
#9
82
#10
73
What city has the Most Immigrants from Cuba in Maryland?
Baltimore has the Most Immigrants from Cuba in Maryland with 418.
What is the Total Immigrants from Cuba in the State of Maryland?
Total Immigrants from Cuba in Maryland is 3,238.
What is the Total Immigrants from Cuba in the United States?
Total Immigrants from Cuba in the United States is 1,325,277.