Cities with the Highest Percentage of Immigrants from Northern Europe in North Carolina
RELATED REPORTS & OPTIONS
Northern Europe
North Carolina
Compare Cities
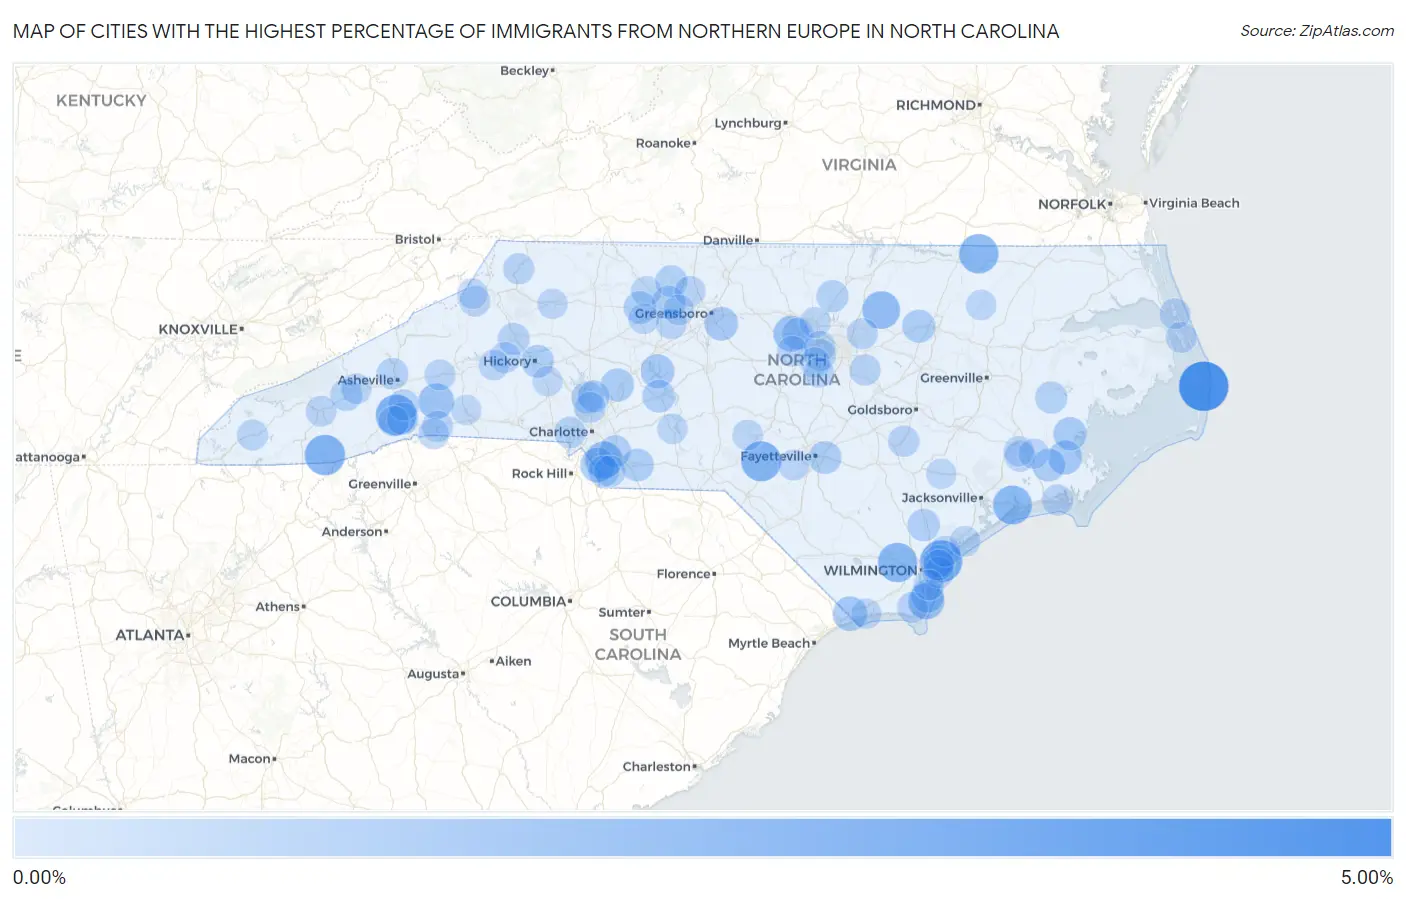
Map of Cities with the Highest Percentage of Immigrants from Northern Europe in North Carolina
0.00%
5.00%
Cities with the Highest Percentage of Immigrants from Northern Europe in North Carolina
| City | Northern Europe | vs State | vs National | |
| 1. | Salvo | 4.48% | 0.25%(+4.22)#1 | 0.29%(+4.19)#121 |
| 2. | Porters Neck | 2.90% | 0.25%(+2.65)#2 | 0.29%(+2.62)#289 |
| 3. | Horse Shoe | 2.64% | 0.25%(+2.39)#3 | 0.29%(+2.36)#356 |
| 4. | Highlands | 2.54% | 0.25%(+2.29)#4 | 0.29%(+2.26)#382 |
| 5. | Five Points | 2.46% | 0.25%(+2.21)#5 | 0.29%(+2.18)#395 |
| 6. | Seaboard | 2.32% | 0.25%(+2.07)#6 | 0.29%(+2.04)#426 |
| 7. | Sandy Creek | 2.30% | 0.25%(+2.05)#7 | 0.29%(+2.02)#430 |
| 8. | Swansboro | 2.26% | 0.25%(+2.01)#8 | 0.29%(+1.98)#440 |
| 9. | Louisburg | 1.97% | 0.25%(+1.71)#9 | 0.29%(+1.68)#551 |
| 10. | Weddington | 1.86% | 0.25%(+1.61)#10 | 0.29%(+1.57)#598 |
| 11. | Kure Beach | 1.69% | 0.25%(+1.43)#11 | 0.29%(+1.40)#692 |
| 12. | Carrboro | 1.60% | 0.25%(+1.34)#12 | 0.29%(+1.31)#754 |
| 13. | Lake Lure | 1.59% | 0.25%(+1.33)#13 | 0.29%(+1.30)#759 |
| 14. | Marvin | 1.34% | 0.25%(+1.08)#14 | 0.29%(+1.05)#964 |
| 15. | Carolina Shores | 1.34% | 0.25%(+1.08)#15 | 0.29%(+1.05)#971 |
| 16. | Oriental | 1.24% | 0.25%(+0.985)#16 | 0.29%(+0.954)#1,078 |
| 17. | Governors Club | 1.24% | 0.25%(+0.984)#17 | 0.29%(+0.954)#1,079 |
| 18. | Southmont | 1.22% | 0.25%(+0.966)#18 | 0.29%(+0.936)#1,108 |
| 19. | Forest Oaks | 1.18% | 0.25%(+0.928)#19 | 0.29%(+0.897)#1,158 |
| 20. | Cherry Branch | 1.09% | 0.25%(+0.838)#20 | 0.29%(+0.808)#1,292 |
| 21. | Mesic | 1.09% | 0.25%(+0.838)#21 | 0.29%(+0.808)#1,294 |
| 22. | Landis | 1.06% | 0.25%(+0.810)#22 | 0.29%(+0.779)#1,348 |
| 23. | Carolina Beach | 1.06% | 0.25%(+0.809)#23 | 0.29%(+0.778)#1,351 |
| 24. | Walkertown | 1.05% | 0.25%(+0.797)#24 | 0.29%(+0.766)#1,370 |
| 25. | Nashville | 1.05% | 0.25%(+0.794)#25 | 0.29%(+0.764)#1,376 |
| 26. | Minnesott Beach | 1.03% | 0.25%(+0.774)#26 | 0.29%(+0.743)#1,420 |
| 27. | Vander | 1.01% | 0.25%(+0.758)#27 | 0.29%(+0.727)#1,450 |
| 28. | Richfield | 0.98% | 0.25%(+0.722)#28 | 0.29%(+0.692)#1,514 |
| 29. | Hickory | 0.98% | 0.25%(+0.721)#29 | 0.29%(+0.690)#1,516 |
| 30. | Brandywine Bay | 0.97% | 0.25%(+0.716)#30 | 0.29%(+0.685)#1,528 |
| 31. | Wingate | 0.96% | 0.25%(+0.706)#31 | 0.29%(+0.675)#1,554 |
| 32. | Lewisville | 0.95% | 0.25%(+0.693)#32 | 0.29%(+0.662)#1,592 |
| 33. | Burgaw | 0.90% | 0.25%(+0.649)#33 | 0.29%(+0.619)#1,678 |
| 34. | Lake Park | 0.87% | 0.25%(+0.613)#34 | 0.29%(+0.582)#1,762 |
| 35. | Cornelius | 0.86% | 0.25%(+0.608)#35 | 0.29%(+0.578)#1,782 |
| 36. | Cypress Landing | 0.86% | 0.25%(+0.601)#36 | 0.29%(+0.570)#1,807 |
| 37. | Bayshore | 0.85% | 0.25%(+0.593)#37 | 0.29%(+0.563)#1,823 |
| 38. | Bath | 0.85% | 0.25%(+0.593)#38 | 0.29%(+0.562)#1,826 |
| 39. | Stem | 0.84% | 0.25%(+0.586)#39 | 0.29%(+0.555)#1,851 |
| 40. | Walnut Cove | 0.84% | 0.25%(+0.583)#40 | 0.29%(+0.553)#1,858 |
| 41. | Briar Chapel | 0.83% | 0.25%(+0.570)#41 | 0.29%(+0.540)#1,889 |
| 42. | Waynesville | 0.81% | 0.25%(+0.560)#42 | 0.29%(+0.530)#1,926 |
| 43. | Laurel Park | 0.80% | 0.25%(+0.548)#43 | 0.29%(+0.518)#1,948 |
| 44. | Davidson | 0.77% | 0.25%(+0.515)#44 | 0.29%(+0.484)#2,047 |
| 45. | Cary | 0.77% | 0.25%(+0.511)#45 | 0.29%(+0.480)#2,056 |
| 46. | Chapel Hill | 0.74% | 0.25%(+0.489)#46 | 0.29%(+0.458)#2,131 |
| 47. | Lenoir | 0.74% | 0.25%(+0.488)#47 | 0.29%(+0.458)#2,132 |
| 48. | Mineral Springs | 0.72% | 0.25%(+0.467)#48 | 0.29%(+0.437)#2,184 |
| 49. | Woodfin | 0.72% | 0.25%(+0.467)#49 | 0.29%(+0.436)#2,187 |
| 50. | Waxhaw | 0.72% | 0.25%(+0.461)#50 | 0.29%(+0.431)#2,208 |
| 51. | Belmont | 0.71% | 0.25%(+0.459)#51 | 0.29%(+0.429)#2,218 |
| 52. | Calypso | 0.70% | 0.25%(+0.444)#52 | 0.29%(+0.414)#2,259 |
| 53. | Fletcher | 0.69% | 0.25%(+0.433)#53 | 0.29%(+0.402)#2,297 |
| 54. | Morehead City | 0.69% | 0.25%(+0.430)#54 | 0.29%(+0.400)#2,310 |
| 55. | Drexel | 0.68% | 0.25%(+0.424)#55 | 0.29%(+0.393)#2,333 |
| 56. | Huntersville | 0.66% | 0.25%(+0.409)#56 | 0.29%(+0.378)#2,395 |
| 57. | West Jefferson | 0.66% | 0.25%(+0.408)#57 | 0.29%(+0.378)#2,396 |
| 58. | Clayton | 0.66% | 0.25%(+0.405)#58 | 0.29%(+0.374)#2,409 |
| 59. | Columbus | 0.64% | 0.25%(+0.389)#59 | 0.29%(+0.359)#2,465 |
| 60. | Rolesville | 0.64% | 0.25%(+0.385)#60 | 0.29%(+0.354)#2,479 |
| 61. | Wrightsville Beach | 0.63% | 0.25%(+0.377)#61 | 0.29%(+0.347)#2,503 |
| 62. | Brices Creek | 0.63% | 0.25%(+0.371)#62 | 0.29%(+0.340)#2,533 |
| 63. | Andrews | 0.62% | 0.25%(+0.368)#63 | 0.29%(+0.338)#2,545 |
| 64. | Sylva | 0.62% | 0.25%(+0.360)#64 | 0.29%(+0.330)#2,580 |
| 65. | Hampstead | 0.61% | 0.25%(+0.357)#65 | 0.29%(+0.326)#2,596 |
| 66. | Manteo | 0.61% | 0.25%(+0.354)#66 | 0.29%(+0.323)#2,605 |
| 67. | Old Fort | 0.61% | 0.25%(+0.353)#67 | 0.29%(+0.323)#2,609 |
| 68. | Ogden | 0.60% | 0.25%(+0.343)#68 | 0.29%(+0.312)#2,653 |
| 69. | Southport | 0.60% | 0.25%(+0.343)#69 | 0.29%(+0.312)#2,654 |
| 70. | Kitty Hawk | 0.60% | 0.25%(+0.341)#70 | 0.29%(+0.311)#2,661 |
| 71. | Tryon | 0.59% | 0.25%(+0.339)#71 | 0.29%(+0.308)#2,679 |
| 72. | Rockfish | 0.59% | 0.25%(+0.334)#72 | 0.29%(+0.303)#2,702 |
| 73. | Wallburg | 0.58% | 0.25%(+0.329)#73 | 0.29%(+0.299)#2,725 |
| 74. | Durham | 0.58% | 0.25%(+0.328)#74 | 0.29%(+0.298)#2,731 |
| 75. | Morrisville | 0.58% | 0.25%(+0.327)#75 | 0.29%(+0.296)#2,739 |
| 76. | Fearrington Village | 0.58% | 0.25%(+0.326)#76 | 0.29%(+0.296)#2,742 |
| 77. | Stokesdale | 0.58% | 0.25%(+0.321)#77 | 0.29%(+0.291)#2,761 |
| 78. | Banner Elk | 0.57% | 0.25%(+0.312)#78 | 0.29%(+0.282)#2,812 |
| 79. | Myrtle Grove | 0.56% | 0.25%(+0.307)#79 | 0.29%(+0.277)#2,830 |
| 80. | Clyde | 0.56% | 0.25%(+0.307)#80 | 0.29%(+0.276)#2,835 |
| 81. | Etowah | 0.56% | 0.25%(+0.304)#81 | 0.29%(+0.274)#2,852 |
| 82. | Salem | 0.55% | 0.25%(+0.296)#82 | 0.29%(+0.265)#2,890 |
| 83. | Kernersville | 0.54% | 0.25%(+0.290)#83 | 0.29%(+0.259)#2,927 |
| 84. | Surf City | 0.54% | 0.25%(+0.285)#84 | 0.29%(+0.255)#2,938 |
| 85. | Spout Springs | 0.54% | 0.25%(+0.284)#85 | 0.29%(+0.254)#2,944 |
| 86. | Pinehurst | 0.54% | 0.25%(+0.283)#86 | 0.29%(+0.253)#2,953 |
| 87. | Tobaccoville | 0.54% | 0.25%(+0.283)#87 | 0.29%(+0.253)#2,954 |
| 88. | Scotland Neck | 0.54% | 0.25%(+0.283)#88 | 0.29%(+0.252)#2,958 |
| 89. | Apex | 0.54% | 0.25%(+0.281)#89 | 0.29%(+0.250)#2,965 |
| 90. | Clemmons | 0.52% | 0.25%(+0.267)#90 | 0.29%(+0.236)#3,033 |
| 91. | Norwood | 0.52% | 0.25%(+0.261)#91 | 0.29%(+0.231)#3,066 |
| 92. | Trent Woods | 0.51% | 0.25%(+0.259)#92 | 0.29%(+0.229)#3,078 |
| 93. | Beech Mountain | 0.50% | 0.25%(+0.246)#93 | 0.29%(+0.216)#3,134 |
| 94. | Holly Springs | 0.50% | 0.25%(+0.245)#94 | 0.29%(+0.214)#3,140 |
| 95. | Fairfield Harbour | 0.50% | 0.25%(+0.242)#95 | 0.29%(+0.212)#3,156 |
| 96. | Ocean Isle Beach | 0.49% | 0.25%(+0.240)#96 | 0.29%(+0.209)#3,175 |
| 97. | Wilkesboro | 0.49% | 0.25%(+0.235)#97 | 0.29%(+0.205)#3,199 |
| 98. | Beulaville | 0.49% | 0.25%(+0.232)#98 | 0.29%(+0.201)#3,219 |
| 99. | Ruth | 0.48% | 0.25%(+0.228)#99 | 0.29%(+0.198)#3,236 |
| 100. | Maiden | 0.48% | 0.25%(+0.228)#100 | 0.29%(+0.198)#3,237 |
Common Questions
What are the Top 10 Cities with the Highest Percentage of Immigrants from Northern Europe in North Carolina?
Top 10 Cities with the Highest Percentage of Immigrants from Northern Europe in North Carolina are:
#1
4.48%
#2
2.90%
#3
2.64%
#4
2.54%
#5
2.46%
#6
2.32%
#7
2.30%
#8
2.26%
#9
1.97%
#10
1.86%
What city has the Highest Percentage of Immigrants from Northern Europe in North Carolina?
Salvo has the Highest Percentage of Immigrants from Northern Europe in North Carolina with 4.48%.
What is the Percentage of Immigrants from Northern Europe in the State of North Carolina?
Percentage of Immigrants from Northern Europe in North Carolina is 0.25%.
What is the Percentage of Immigrants from Northern Europe in the United States?
Percentage of Immigrants from Northern Europe in the United States is 0.29%.