Cities with the Most Immigrants from Liberia in Maryland
RELATED REPORTS & OPTIONS
Liberia
Maryland
Compare Cities
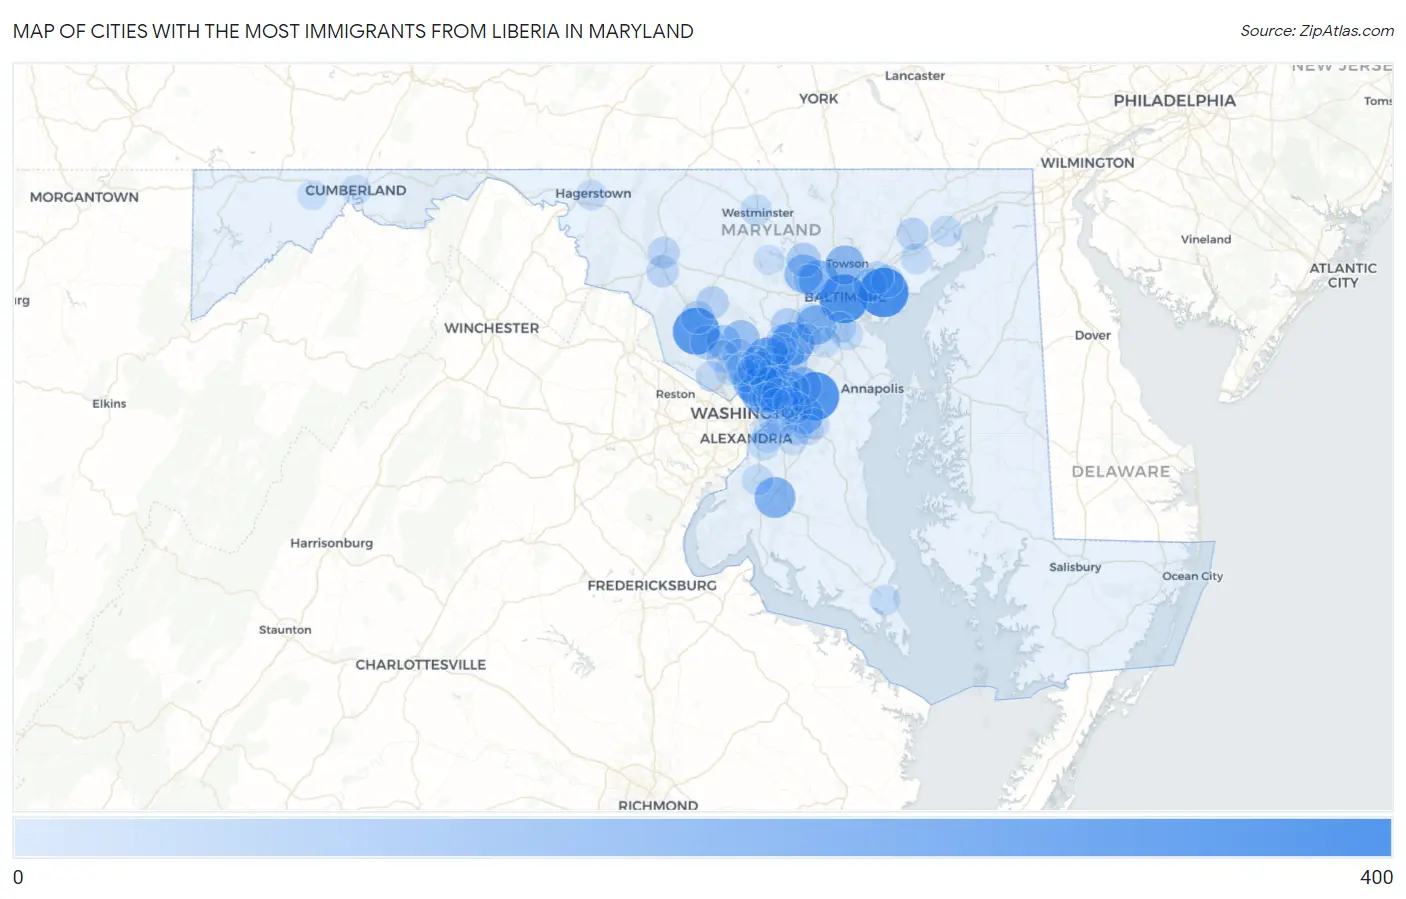
Map of Cities with the Most Immigrants from Liberia in Maryland
0
400
Cities with the Most Immigrants from Liberia in Maryland
| City | Liberia | vs State | vs National | |
| 1. | Essex | 336 | 5,959(5.64%)#1 | 98,441(0.34%)#43 |
| 2. | Baltimore | 322 | 5,959(5.40%)#2 | 98,441(0.33%)#45 |
| 3. | Bowie | 315 | 5,959(5.29%)#3 | 98,441(0.32%)#47 |
| 4. | Germantown | 289 | 5,959(4.85%)#4 | 98,441(0.29%)#51 |
| 5. | Fairland | 251 | 5,959(4.21%)#5 | 98,441(0.25%)#63 |
| 6. | Chillum | 223 | 5,959(3.74%)#6 | 98,441(0.23%)#69 |
| 7. | North Laurel | 221 | 5,959(3.71%)#7 | 98,441(0.22%)#70 |
| 8. | Waldorf | 182 | 5,959(3.05%)#8 | 98,441(0.18%)#86 |
| 9. | Lochearn | 161 | 5,959(2.70%)#9 | 98,441(0.16%)#97 |
| 10. | Elkridge | 160 | 5,959(2.69%)#10 | 98,441(0.16%)#98 |
| 11. | Towson | 155 | 5,959(2.60%)#11 | 98,441(0.16%)#103 |
| 12. | Silver Spring | 152 | 5,959(2.55%)#12 | 98,441(0.15%)#104 |
| 13. | Kettering | 143 | 5,959(2.40%)#13 | 98,441(0.15%)#109 |
| 14. | Randallstown | 141 | 5,959(2.37%)#14 | 98,441(0.14%)#110 |
| 15. | Calverton | 141 | 5,959(2.37%)#15 | 98,441(0.14%)#111 |
| 16. | Glenn Dale | 137 | 5,959(2.30%)#16 | 98,441(0.14%)#115 |
| 17. | Takoma Park | 127 | 5,959(2.13%)#17 | 98,441(0.13%)#129 |
| 18. | Olney | 119 | 5,959(2.00%)#18 | 98,441(0.12%)#136 |
| 19. | Greenbelt | 101 | 5,959(1.69%)#19 | 98,441(0.10%)#158 |
| 20. | White Oak | 85 | 5,959(1.43%)#20 | 98,441(0.09%)#190 |
| 21. | Redland | 82 | 5,959(1.38%)#21 | 98,441(0.08%)#198 |
| 22. | Owings Mills | 71 | 5,959(1.19%)#22 | 98,441(0.07%)#215 |
| 23. | Gaithersburg | 68 | 5,959(1.14%)#23 | 98,441(0.07%)#224 |
| 24. | Seabrook | 68 | 5,959(1.14%)#24 | 98,441(0.07%)#226 |
| 25. | Columbia | 61 | 5,959(1.02%)#25 | 98,441(0.06%)#248 |
| 26. | Woodlawn Cdp Baltimore County | 61 | 5,959(1.02%)#26 | 98,441(0.06%)#249 |
| 27. | Rosedale | 58 | 5,959(0.97%)#27 | 98,441(0.06%)#257 |
| 28. | South Laurel | 51 | 5,959(0.86%)#28 | 98,441(0.05%)#279 |
| 29. | Clarksburg | 51 | 5,959(0.86%)#29 | 98,441(0.05%)#280 |
| 30. | Westphalia | 47 | 5,959(0.79%)#30 | 98,441(0.05%)#298 |
| 31. | Landover | 44 | 5,959(0.74%)#31 | 98,441(0.04%)#310 |
| 32. | Damascus | 42 | 5,959(0.70%)#32 | 98,441(0.04%)#323 |
| 33. | Middle River | 40 | 5,959(0.67%)#33 | 98,441(0.04%)#333 |
| 34. | Rossville | 40 | 5,959(0.67%)#34 | 98,441(0.04%)#335 |
| 35. | Aspen Hill | 39 | 5,959(0.65%)#35 | 98,441(0.04%)#338 |
| 36. | Forest Glen | 39 | 5,959(0.65%)#36 | 98,441(0.04%)#341 |
| 37. | Bel Air South | 37 | 5,959(0.62%)#37 | 98,441(0.04%)#351 |
| 38. | Ballenger Creek | 37 | 5,959(0.62%)#38 | 98,441(0.04%)#352 |
| 39. | Mount Rainier | 37 | 5,959(0.62%)#39 | 98,441(0.04%)#353 |
| 40. | New Carrollton | 36 | 5,959(0.60%)#40 | 98,441(0.04%)#359 |
| 41. | Rockville | 35 | 5,959(0.59%)#41 | 98,441(0.04%)#360 |
| 42. | Coral Hills | 35 | 5,959(0.59%)#42 | 98,441(0.04%)#365 |
| 43. | Frederick | 33 | 5,959(0.55%)#43 | 98,441(0.03%)#371 |
| 44. | District Heights | 31 | 5,959(0.52%)#44 | 98,441(0.03%)#387 |
| 45. | Bladensburg | 30 | 5,959(0.50%)#45 | 98,441(0.03%)#399 |
| 46. | Laurel | 27 | 5,959(0.45%)#46 | 98,441(0.03%)#421 |
| 47. | Scaggsville | 26 | 5,959(0.44%)#47 | 98,441(0.03%)#429 |
| 48. | Brock Hall | 25 | 5,959(0.42%)#48 | 98,441(0.03%)#438 |
| 49. | Ferndale | 22 | 5,959(0.37%)#49 | 98,441(0.02%)#462 |
| 50. | Westminster | 21 | 5,959(0.35%)#50 | 98,441(0.02%)#467 |
| 51. | Oxon Hill | 21 | 5,959(0.35%)#51 | 98,441(0.02%)#468 |
| 52. | Aberdeen | 21 | 5,959(0.35%)#52 | 98,441(0.02%)#469 |
| 53. | Lake Arbor | 21 | 5,959(0.35%)#53 | 98,441(0.02%)#470 |
| 54. | Accokeek | 21 | 5,959(0.35%)#54 | 98,441(0.02%)#472 |
| 55. | Hillandale | 21 | 5,959(0.35%)#55 | 98,441(0.02%)#475 |
| 56. | Edmonston | 21 | 5,959(0.35%)#56 | 98,441(0.02%)#477 |
| 57. | College Park | 20 | 5,959(0.34%)#57 | 98,441(0.02%)#483 |
| 58. | Milford Mill | 20 | 5,959(0.34%)#58 | 98,441(0.02%)#485 |
| 59. | Edgewood | 20 | 5,959(0.34%)#59 | 98,441(0.02%)#486 |
| 60. | Wheaton | 19 | 5,959(0.32%)#60 | 98,441(0.02%)#492 |
| 61. | Ilchester | 19 | 5,959(0.32%)#61 | 98,441(0.02%)#493 |
| 62. | Beltsville | 19 | 5,959(0.32%)#62 | 98,441(0.02%)#496 |
| 63. | Adelphi | 19 | 5,959(0.32%)#63 | 98,441(0.02%)#498 |
| 64. | North Kensington | 17 | 5,959(0.29%)#64 | 98,441(0.02%)#524 |
| 65. | Glen Burnie | 16 | 5,959(0.27%)#65 | 98,441(0.02%)#531 |
| 66. | Lexington Park | 14 | 5,959(0.23%)#66 | 98,441(0.01%)#566 |
| 67. | Brentwood | 14 | 5,959(0.23%)#67 | 98,441(0.01%)#570 |
| 68. | East Riverdale | 13 | 5,959(0.22%)#68 | 98,441(0.01%)#576 |
| 69. | Jessup | 13 | 5,959(0.22%)#69 | 98,441(0.01%)#577 |
| 70. | Temple Hills | 13 | 5,959(0.22%)#70 | 98,441(0.01%)#578 |
| 71. | Cheverly | 13 | 5,959(0.22%)#71 | 98,441(0.01%)#579 |
| 72. | West Laurel | 13 | 5,959(0.22%)#72 | 98,441(0.01%)#580 |
| 73. | Glenarden | 12 | 5,959(0.20%)#73 | 98,441(0.01%)#594 |
| 74. | Severn | 11 | 5,959(0.18%)#74 | 98,441(0.01%)#604 |
| 75. | Hagerstown | 11 | 5,959(0.18%)#75 | 98,441(0.01%)#606 |
| 76. | North Bethesda | 10 | 5,959(0.17%)#76 | 98,441(0.01%)#617 |
| 77. | Potomac | 10 | 5,959(0.17%)#77 | 98,441(0.01%)#618 |
| 78. | Burtonsville | 10 | 5,959(0.17%)#78 | 98,441(0.01%)#624 |
| 79. | Melwood | 7 | 5,959(0.12%)#79 | 98,441(0.01%)#677 |
| 80. | Hillcrest Heights | 5 | 5,959(0.08%)#80 | 98,441(0.01%)#700 |
| 81. | Colesville | 5 | 5,959(0.08%)#81 | 98,441(0.01%)#703 |
| 82. | Midlothian | 5 | 5,959(0.08%)#82 | 98,441(0.01%)#716 |
| 83. | Eldersburg | 3 | 5,959(0.05%)#83 | 98,441(0.00%)#728 |
| 84. | Cumberland | 2 | 5,959(0.03%)#84 | 98,441(0.00%)#746 |
| 85. | Kemp Mill | 1 | 5,959(0.02%)#85 | 98,441(0.00%)#773 |
| 86. | Marlboro Village | 1 | 5,959(0.02%)#86 | 98,441(0.00%)#774 |
Common Questions
What are the Top 10 Cities with the Most Immigrants from Liberia in Maryland?
Top 10 Cities with the Most Immigrants from Liberia in Maryland are:
#1
336
#2
322
#3
315
#4
289
#5
251
#6
223
#7
221
#8
182
#9
161
#10
160
What city has the Most Immigrants from Liberia in Maryland?
Essex has the Most Immigrants from Liberia in Maryland with 336.
What is the Total Immigrants from Liberia in the State of Maryland?
Total Immigrants from Liberia in Maryland is 5,959.
What is the Total Immigrants from Liberia in the United States?
Total Immigrants from Liberia in the United States is 98,441.