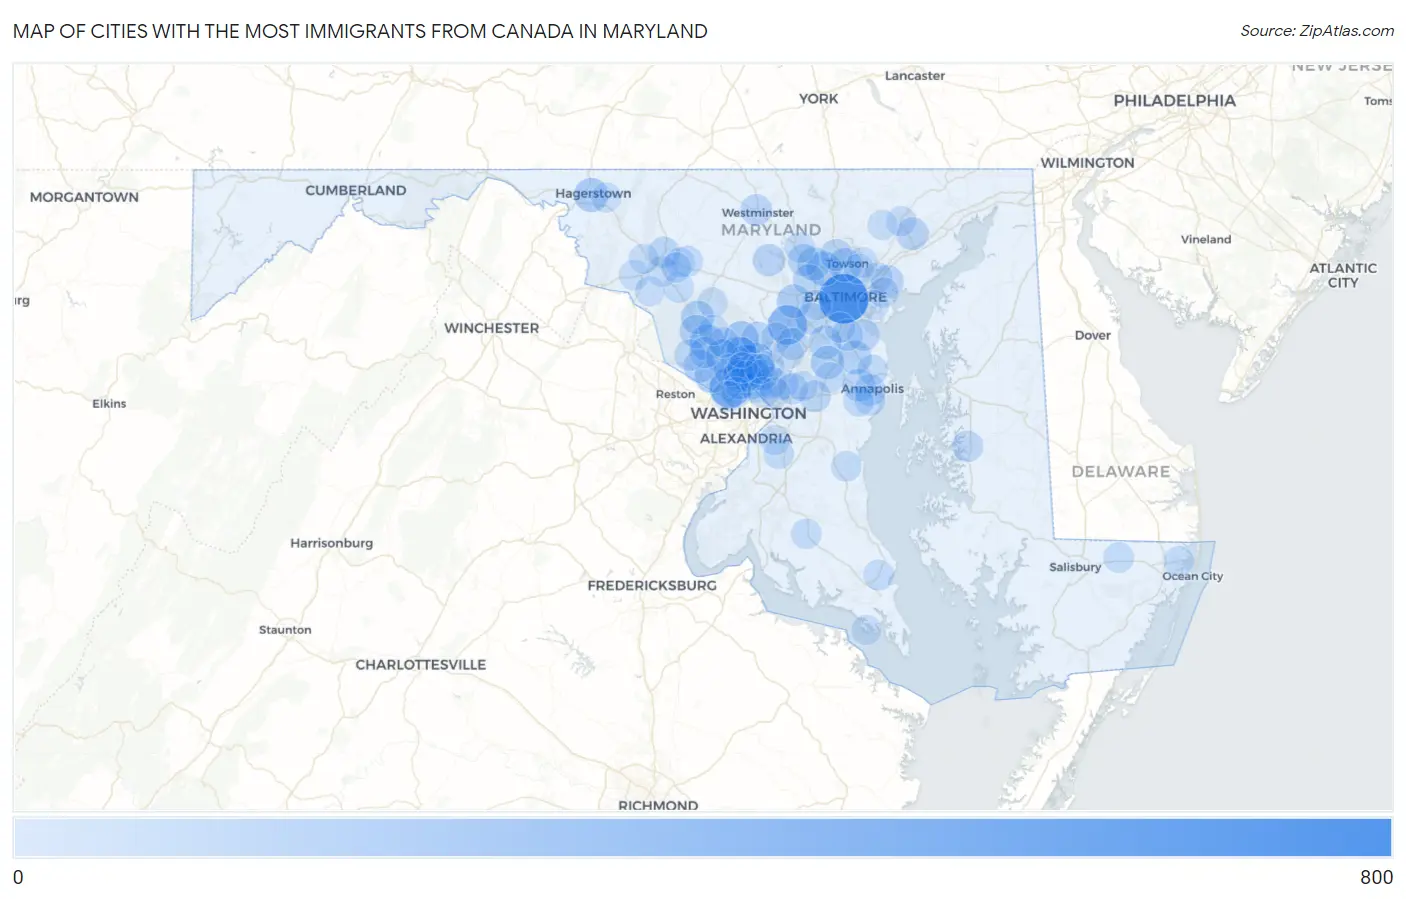
Cities with the Most Immigrants from Canada in Maryland
RELATED REPORTS & OPTIONS
Canada
Maryland
Compare Cities
Map of Cities with the Most Immigrants from Canada in Maryland
0
800
Cities with the Most Immigrants from Canada in Maryland
| City | Canada | vs State | vs National | |
| 1. | Baltimore | 624 | 8,603(7.25%)#1 | 821,792(0.08%)#155 |
| 2. | Bethesda | 342 | 8,603(3.98%)#2 | 821,792(0.04%)#356 |
| 3. | Columbia | 297 | 8,603(3.45%)#3 | 821,792(0.04%)#416 |
| 4. | Aspen Hill | 230 | 8,603(2.67%)#4 | 821,792(0.03%)#569 |
| 5. | Colesville | 218 | 8,603(2.53%)#5 | 821,792(0.03%)#598 |
| 6. | Gaithersburg | 178 | 8,603(2.07%)#6 | 821,792(0.02%)#728 |
| 7. | Olney | 170 | 8,603(1.98%)#7 | 821,792(0.02%)#757 |
| 8. | Pikesville | 149 | 8,603(1.73%)#8 | 821,792(0.02%)#872 |
| 9. | Hagerstown | 139 | 8,603(1.62%)#9 | 821,792(0.02%)#934 |
| 10. | Rockville | 134 | 8,603(1.56%)#10 | 821,792(0.02%)#963 |
| 11. | Ellicott City | 123 | 8,603(1.43%)#11 | 821,792(0.01%)#1,039 |
| 12. | Towson | 122 | 8,603(1.42%)#12 | 821,792(0.01%)#1,046 |
| 13. | Glenmont | 118 | 8,603(1.37%)#13 | 821,792(0.01%)#1,088 |
| 14. | Severna Park | 117 | 8,603(1.36%)#14 | 821,792(0.01%)#1,094 |
| 15. | Severn | 116 | 8,603(1.35%)#15 | 821,792(0.01%)#1,105 |
| 16. | Odenton | 115 | 8,603(1.34%)#16 | 821,792(0.01%)#1,117 |
| 17. | Clarksburg | 113 | 8,603(1.31%)#17 | 821,792(0.01%)#1,134 |
| 18. | Potomac | 112 | 8,603(1.30%)#18 | 821,792(0.01%)#1,143 |
| 19. | Garrison | 107 | 8,603(1.24%)#19 | 821,792(0.01%)#1,200 |
| 20. | Silver Spring | 105 | 8,603(1.22%)#20 | 821,792(0.01%)#1,212 |
| 21. | Germantown | 99 | 8,603(1.15%)#21 | 821,792(0.01%)#1,277 |
| 22. | Travilah | 98 | 8,603(1.14%)#22 | 821,792(0.01%)#1,299 |
| 23. | Middle River | 88 | 8,603(1.02%)#23 | 821,792(0.01%)#1,405 |
| 24. | Bel Air South | 87 | 8,603(1.01%)#24 | 821,792(0.01%)#1,419 |
| 25. | Parole | 86 | 8,603(1.00%)#25 | 821,792(0.01%)#1,436 |
| 26. | Kensington | 86 | 8,603(1.00%)#26 | 821,792(0.01%)#1,445 |
| 27. | Kemp Mill | 84 | 8,603(0.98%)#27 | 821,792(0.01%)#1,471 |
| 28. | Eldersburg | 82 | 8,603(0.95%)#28 | 821,792(0.01%)#1,493 |
| 29. | Mays Chapel | 75 | 8,603(0.87%)#29 | 821,792(0.01%)#1,615 |
| 30. | South Kensington | 74 | 8,603(0.86%)#30 | 821,792(0.01%)#1,631 |
| 31. | North Bethesda | 72 | 8,603(0.84%)#31 | 821,792(0.01%)#1,659 |
| 32. | Owings Mills | 71 | 8,603(0.83%)#32 | 821,792(0.01%)#1,674 |
| 33. | North Laurel | 70 | 8,603(0.81%)#33 | 821,792(0.01%)#1,699 |
| 34. | Riviera Beach | 69 | 8,603(0.80%)#34 | 821,792(0.01%)#1,719 |
| 35. | Frederick | 66 | 8,603(0.77%)#35 | 821,792(0.01%)#1,771 |
| 36. | College Park | 62 | 8,603(0.72%)#36 | 821,792(0.01%)#1,853 |
| 37. | Glen Burnie | 61 | 8,603(0.71%)#37 | 821,792(0.01%)#1,871 |
| 38. | Woodlawn Cdp Baltimore County | 61 | 8,603(0.71%)#38 | 821,792(0.01%)#1,873 |
| 39. | Ilchester | 61 | 8,603(0.71%)#39 | 821,792(0.01%)#1,882 |
| 40. | Westminster | 61 | 8,603(0.71%)#40 | 821,792(0.01%)#1,884 |
| 41. | Ashton Sandy Spring | 61 | 8,603(0.71%)#41 | 821,792(0.01%)#1,892 |
| 42. | Annapolis | 60 | 8,603(0.70%)#42 | 821,792(0.01%)#1,903 |
| 43. | Milford Mill | 59 | 8,603(0.69%)#43 | 821,792(0.01%)#1,921 |
| 44. | Bowie | 58 | 8,603(0.67%)#44 | 821,792(0.01%)#1,937 |
| 45. | North Potomac | 54 | 8,603(0.63%)#45 | 821,792(0.01%)#2,037 |
| 46. | Easton | 52 | 8,603(0.60%)#46 | 821,792(0.01%)#2,103 |
| 47. | Darnestown | 52 | 8,603(0.60%)#47 | 821,792(0.01%)#2,119 |
| 48. | Greenbelt | 50 | 8,603(0.58%)#48 | 821,792(0.01%)#2,157 |
| 49. | Chevy Chase | 50 | 8,603(0.58%)#49 | 821,792(0.01%)#2,169 |
| 50. | Seabrook | 47 | 8,603(0.55%)#50 | 821,792(0.01%)#2,246 |
| 51. | Takoma Park | 46 | 8,603(0.53%)#51 | 821,792(0.01%)#2,281 |
| 52. | Four Corners | 41 | 8,603(0.48%)#52 | 821,792(0.00%)#2,492 |
| 53. | Annapolis Neck | 39 | 8,603(0.45%)#53 | 821,792(0.00%)#2,574 |
| 54. | Hillandale | 38 | 8,603(0.44%)#54 | 821,792(0.00%)#2,632 |
| 55. | Arnold | 37 | 8,603(0.43%)#55 | 821,792(0.00%)#2,655 |
| 56. | Linganore | 37 | 8,603(0.43%)#56 | 821,792(0.00%)#2,674 |
| 57. | Forest Glen | 37 | 8,603(0.43%)#57 | 821,792(0.00%)#2,679 |
| 58. | Urbana | 36 | 8,603(0.42%)#58 | 821,792(0.00%)#2,711 |
| 59. | Friendship Heights Village | 35 | 8,603(0.41%)#59 | 821,792(0.00%)#2,783 |
| 60. | Brookmont | 35 | 8,603(0.41%)#60 | 821,792(0.00%)#2,786 |
| 61. | Leisure World | 33 | 8,603(0.38%)#61 | 821,792(0.00%)#2,880 |
| 62. | Solomons | 33 | 8,603(0.38%)#62 | 821,792(0.00%)#2,903 |
| 63. | Flower Hill | 32 | 8,603(0.37%)#63 | 821,792(0.00%)#2,936 |
| 64. | Crofton | 30 | 8,603(0.35%)#64 | 821,792(0.00%)#3,045 |
| 65. | Ballenger Creek | 30 | 8,603(0.35%)#65 | 821,792(0.00%)#3,049 |
| 66. | Edgewater | 30 | 8,603(0.35%)#66 | 821,792(0.00%)#3,071 |
| 67. | Calverton | 29 | 8,603(0.34%)#67 | 821,792(0.00%)#3,104 |
| 68. | Carney | 28 | 8,603(0.33%)#68 | 821,792(0.00%)#3,153 |
| 69. | Ferndale | 28 | 8,603(0.33%)#69 | 821,792(0.00%)#3,165 |
| 70. | Owings | 28 | 8,603(0.33%)#70 | 821,792(0.00%)#3,200 |
| 71. | Pittsville | 28 | 8,603(0.33%)#71 | 821,792(0.00%)#3,201 |
| 72. | Chillum | 27 | 8,603(0.31%)#72 | 821,792(0.00%)#3,215 |
| 73. | Clinton | 26 | 8,603(0.30%)#73 | 821,792(0.00%)#3,279 |
| 74. | Reisterstown | 26 | 8,603(0.30%)#74 | 821,792(0.00%)#3,284 |
| 75. | Ocean Pines | 26 | 8,603(0.30%)#75 | 821,792(0.00%)#3,297 |
| 76. | Charlotte Hall | 26 | 8,603(0.30%)#76 | 821,792(0.00%)#3,336 |
| 77. | Redland | 25 | 8,603(0.29%)#77 | 821,792(0.00%)#3,356 |
| 78. | Rossville | 23 | 8,603(0.27%)#78 | 821,792(0.00%)#3,525 |
| 79. | Essex | 22 | 8,603(0.26%)#79 | 821,792(0.00%)#3,591 |
| 80. | Wheaton | 21 | 8,603(0.24%)#80 | 821,792(0.00%)#3,682 |
| 81. | Parkville | 21 | 8,603(0.24%)#81 | 821,792(0.00%)#3,687 |
| 82. | Dundalk | 20 | 8,603(0.23%)#82 | 821,792(0.00%)#3,779 |
| 83. | Fulton | 20 | 8,603(0.23%)#83 | 821,792(0.00%)#3,836 |
| 84. | White Oak | 19 | 8,603(0.22%)#84 | 821,792(0.00%)#3,894 |
| 85. | Glenn Dale | 19 | 8,603(0.22%)#85 | 821,792(0.00%)#3,896 |
| 86. | Riverdale Park | 19 | 8,603(0.22%)#86 | 821,792(0.00%)#3,922 |
| 87. | Spring Ridge | 19 | 8,603(0.22%)#87 | 821,792(0.00%)#3,930 |
| 88. | Jefferson | 19 | 8,603(0.22%)#88 | 821,792(0.00%)#3,958 |
| 89. | Bartonsville | 19 | 8,603(0.22%)#89 | 821,792(0.00%)#3,960 |
| 90. | Bel Air North | 18 | 8,603(0.21%)#90 | 821,792(0.00%)#3,988 |
| 91. | Laurel | 18 | 8,603(0.21%)#91 | 821,792(0.00%)#3,989 |
| 92. | Damascus | 18 | 8,603(0.21%)#92 | 821,792(0.00%)#4,008 |
| 93. | Montgomery Village | 17 | 8,603(0.20%)#93 | 821,792(0.00%)#4,092 |
| 94. | Camp Springs | 17 | 8,603(0.20%)#94 | 821,792(0.00%)#4,096 |
| 95. | Fallston | 17 | 8,603(0.20%)#95 | 821,792(0.00%)#4,125 |
| 96. | Robinwood | 17 | 8,603(0.20%)#96 | 821,792(0.00%)#4,139 |
| 97. | Adamstown | 17 | 8,603(0.20%)#97 | 821,792(0.00%)#4,186 |
| 98. | Catonsville | 16 | 8,603(0.19%)#98 | 821,792(0.00%)#4,211 |
| 99. | Braddock Heights | 16 | 8,603(0.19%)#99 | 821,792(0.00%)#4,288 |
| 100. | Piney Point | 15 | 8,603(0.17%)#100 | 821,792(0.00%)#4,477 |
Common Questions
What are the Top 10 Cities with the Most Immigrants from Canada in Maryland?
Top 10 Cities with the Most Immigrants from Canada in Maryland are:
#1
624
#2
342
#3
297
#4
230
#5
218
#6
178
#7
170
#8
149
#9
139
#10
134
What city has the Most Immigrants from Canada in Maryland?
Baltimore has the Most Immigrants from Canada in Maryland with 624.
What is the Total Immigrants from Canada in the State of Maryland?
Total Immigrants from Canada in Maryland is 8,603.
What is the Total Immigrants from Canada in the United States?
Total Immigrants from Canada in the United States is 821,792.