Cities with the Most Immigrants from Hungary in Maryland
RELATED REPORTS & OPTIONS
Hungary
Maryland
Compare Cities
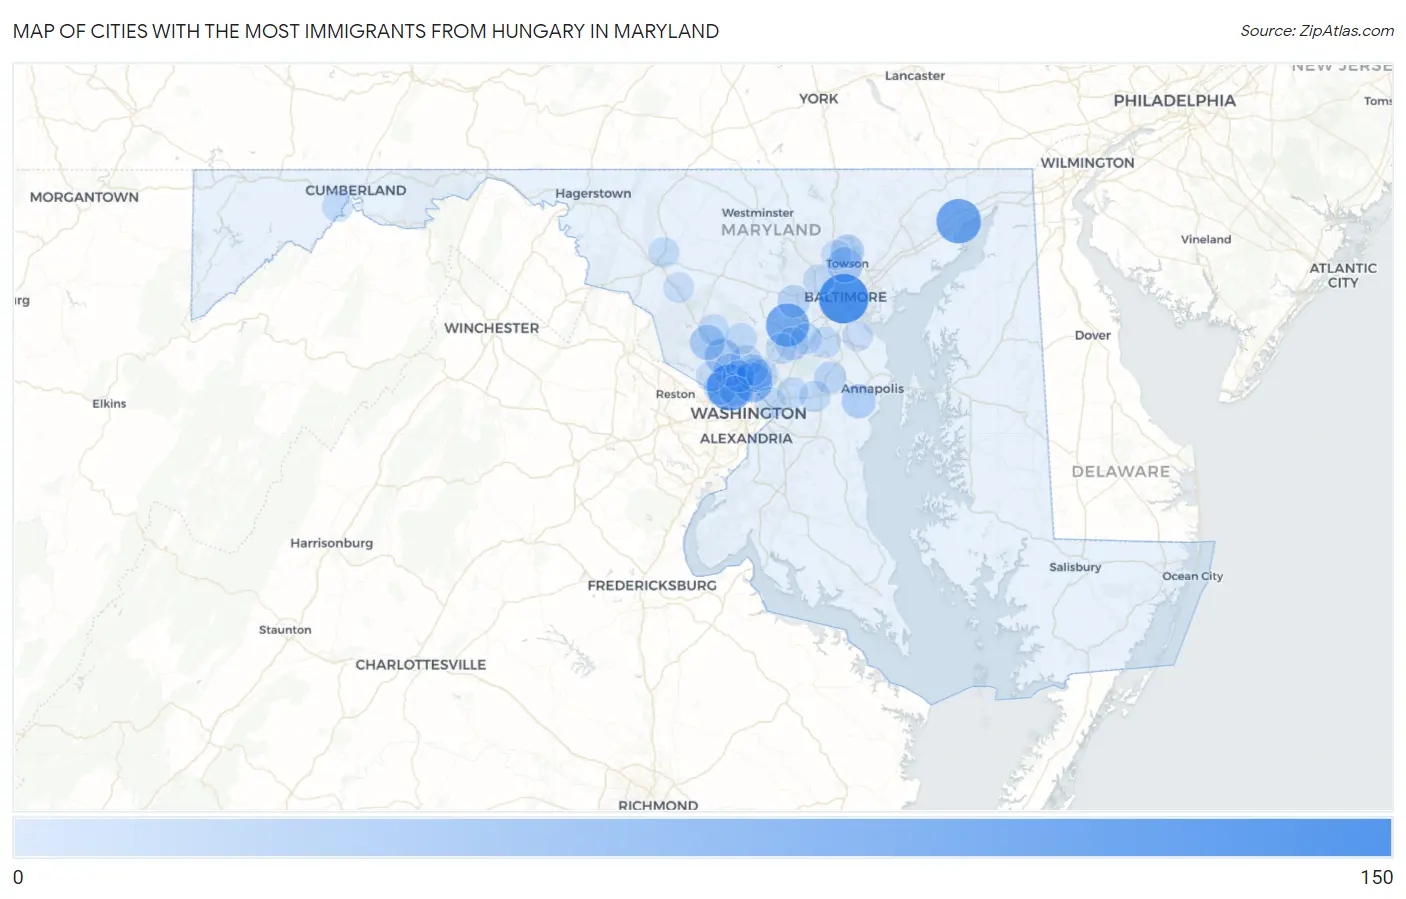
Map of Cities with the Most Immigrants from Hungary in Maryland
0
150
Cities with the Most Immigrants from Hungary in Maryland
| City | Hungary | vs State | vs National | |
| 1. | Baltimore | 119 | 904(13.16%)#1 | 64,894(0.18%)#50 |
| 2. | Bethesda | 98 | 904(10.84%)#2 | 64,894(0.15%)#79 |
| 3. | Havre De Grace | 88 | 904(9.73%)#3 | 64,894(0.14%)#100 |
| 4. | Columbia | 79 | 904(8.74%)#4 | 64,894(0.12%)#121 |
| 5. | Silver Spring | 55 | 904(6.08%)#5 | 64,894(0.08%)#204 |
| 6. | Rockville | 32 | 904(3.54%)#6 | 64,894(0.05%)#398 |
| 7. | Towson | 31 | 904(3.43%)#7 | 64,894(0.05%)#409 |
| 8. | Gaithersburg | 30 | 904(3.32%)#8 | 64,894(0.05%)#426 |
| 9. | Four Corners | 26 | 904(2.88%)#9 | 64,894(0.04%)#505 |
| 10. | Edgewater | 24 | 904(2.65%)#10 | 64,894(0.04%)#545 |
| 11. | Timonium | 20 | 904(2.21%)#11 | 64,894(0.03%)#640 |
| 12. | North Laurel | 18 | 904(1.99%)#12 | 64,894(0.03%)#693 |
| 13. | North Bethesda | 16 | 904(1.77%)#13 | 64,894(0.02%)#746 |
| 14. | Ellicott City | 15 | 904(1.66%)#14 | 64,894(0.02%)#773 |
| 15. | Cabin John | 14 | 904(1.55%)#15 | 64,894(0.02%)#840 |
| 16. | Crofton | 12 | 904(1.33%)#16 | 64,894(0.02%)#906 |
| 17. | Glenmont | 12 | 904(1.33%)#17 | 64,894(0.02%)#913 |
| 18. | South Kensington | 11 | 904(1.22%)#18 | 64,894(0.02%)#970 |
| 19. | Hillandale | 10 | 904(1.11%)#19 | 64,894(0.02%)#1,031 |
| 20. | Flower Hill | 9 | 904(1.00%)#20 | 64,894(0.01%)#1,083 |
| 21. | Kemp Mill | 9 | 904(1.00%)#21 | 64,894(0.01%)#1,085 |
| 22. | Severn | 8 | 904(0.88%)#22 | 64,894(0.01%)#1,117 |
| 23. | Olney | 8 | 904(0.88%)#23 | 64,894(0.01%)#1,125 |
| 24. | Bowie | 7 | 904(0.77%)#24 | 64,894(0.01%)#1,193 |
| 25. | Montgomery Village | 7 | 904(0.77%)#25 | 64,894(0.01%)#1,201 |
| 26. | Lochearn | 7 | 904(0.77%)#26 | 64,894(0.01%)#1,205 |
| 27. | Jessup | 7 | 904(0.77%)#27 | 64,894(0.01%)#1,221 |
| 28. | Cresaptown | 7 | 904(0.77%)#28 | 64,894(0.01%)#1,236 |
| 29. | Colmar Manor | 7 | 904(0.77%)#29 | 64,894(0.01%)#1,250 |
| 30. | Frederick | 6 | 904(0.66%)#30 | 64,894(0.01%)#1,257 |
| 31. | Lanham | 6 | 904(0.66%)#31 | 64,894(0.01%)#1,281 |
| 32. | West Laurel | 6 | 904(0.66%)#32 | 64,894(0.01%)#1,293 |
| 33. | Urbana | 4 | 904(0.44%)#33 | 64,894(0.01%)#1,382 |
| 34. | Somerset | 4 | 904(0.44%)#34 | 64,894(0.01%)#1,401 |
| 35. | Woodlawn Cdp Baltimore County | 2 | 904(0.22%)#35 | 64,894(0.00%)#1,460 |
| 36. | Pasadena | 2 | 904(0.22%)#36 | 64,894(0.00%)#1,462 |
| 37. | Mays Chapel | 2 | 904(0.22%)#37 | 64,894(0.00%)#1,468 |
| 38. | Potomac | 1 | 904(0.11%)#38 | 64,894(0.00%)#1,514 |
Common Questions
What are the Top 10 Cities with the Most Immigrants from Hungary in Maryland?
Top 10 Cities with the Most Immigrants from Hungary in Maryland are:
#1
119
#2
98
#3
88
#4
79
#5
55
#6
32
#7
31
#8
30
#9
26
#10
24
What city has the Most Immigrants from Hungary in Maryland?
Baltimore has the Most Immigrants from Hungary in Maryland with 119.
What is the Total Immigrants from Hungary in the State of Maryland?
Total Immigrants from Hungary in Maryland is 904.
What is the Total Immigrants from Hungary in the United States?
Total Immigrants from Hungary in the United States is 64,894.