Cities with the Highest Percentage of Immigrants from Northern Europe in Vermont
RELATED REPORTS & OPTIONS
Northern Europe
Vermont
Compare Cities
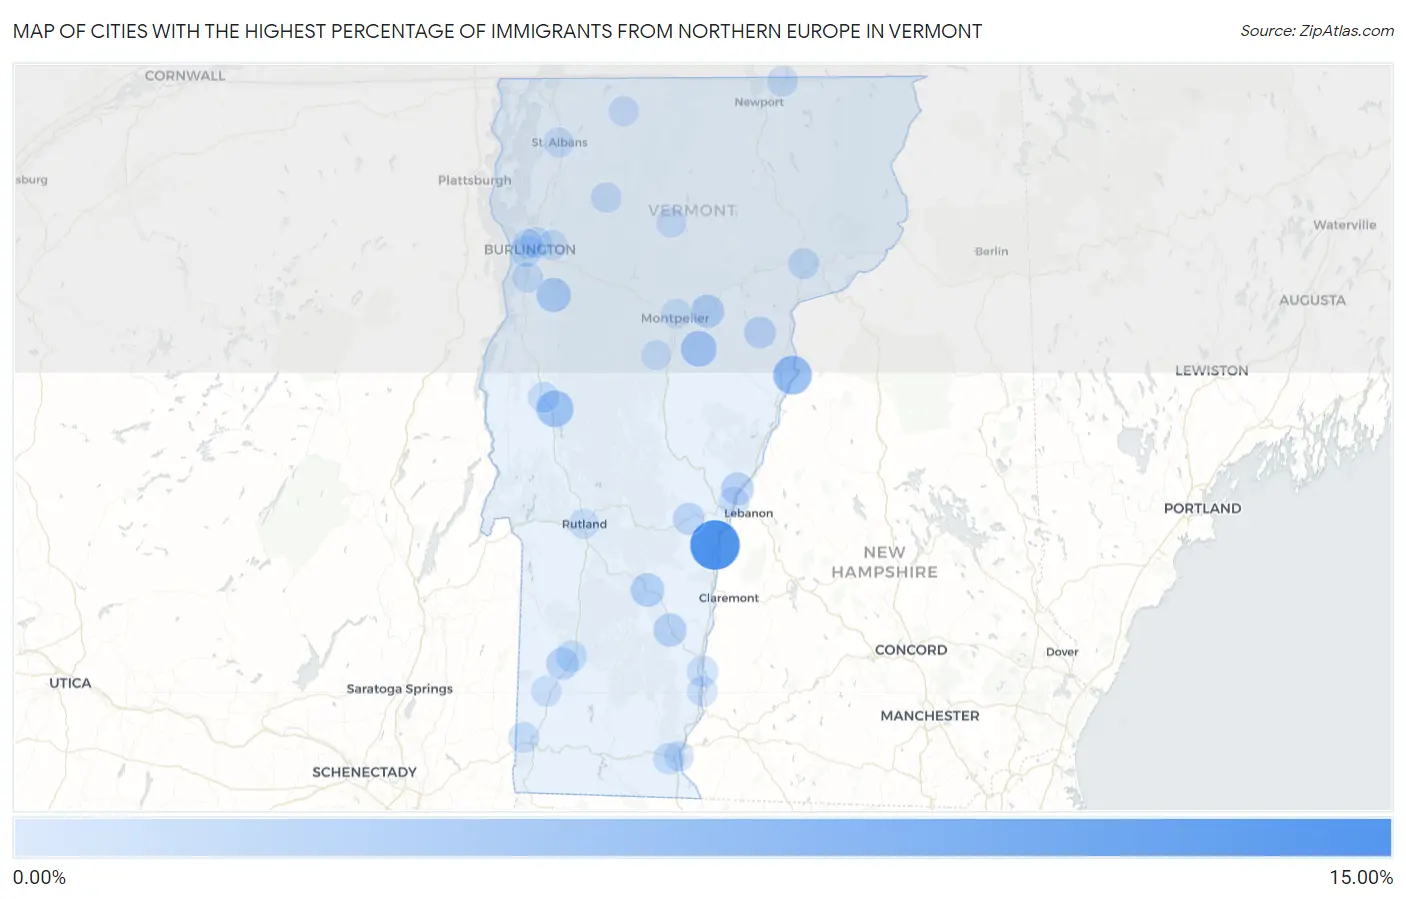
Map of Cities with the Highest Percentage of Immigrants from Northern Europe in Vermont
0.00%
15.00%
Cities with the Highest Percentage of Immigrants from Northern Europe in Vermont
| City | Northern Europe | vs State | vs National | |
| 1. | Hartland | 14.08% | 0.40%(+13.7)#1 | 0.29%(+13.8)#16 |
| 2. | West Dummerston | 10.53% | 0.40%(+10.1)#2 | 0.29%(+10.2)#29 |
| 3. | Wardsboro | 8.16% | 0.40%(+7.76)#3 | 0.29%(+7.88)#41 |
| 4. | Newbury | 6.06% | 0.40%(+5.66)#4 | 0.29%(+5.78)#70 |
| 5. | East Middlebury | 4.76% | 0.40%(+4.36)#5 | 0.29%(+4.48)#103 |
| 6. | Websterville | 4.02% | 0.40%(+3.61)#6 | 0.29%(+3.73)#160 |
| 7. | Hinesburg | 3.04% | 0.40%(+2.64)#7 | 0.29%(+2.75)#273 |
| 8. | Ludlow | 2.53% | 0.40%(+2.13)#8 | 0.29%(+2.25)#384 |
| 9. | Plainfield | 2.33% | 0.40%(+1.92)#9 | 0.29%(+2.04)#425 |
| 10. | Chester | 2.10% | 0.40%(+1.69)#10 | 0.29%(+1.81)#495 |
| 11. | Norwich | 1.91% | 0.40%(+1.50)#11 | 0.29%(+1.62)#579 |
| 12. | Manchester | 1.71% | 0.40%(+1.30)#12 | 0.29%(+1.42)#679 |
| 13. | Danby | 1.69% | 0.40%(+1.28)#13 | 0.29%(+1.40)#693 |
| 14. | Killington | 1.50% | 0.40%(+1.09)#14 | 0.29%(+1.21)#830 |
| 15. | Groton | 1.39% | 0.40%(+0.987)#15 | 0.29%(+1.10)#921 |
| 16. | Woodstock | 1.36% | 0.40%(+0.953)#16 | 0.29%(+1.07)#953 |
| 17. | Manchester Center | 0.93% | 0.40%(+0.524)#17 | 0.29%(+0.641)#1,625 |
| 18. | South Burlington | 0.92% | 0.40%(+0.517)#18 | 0.29%(+0.634)#1,640 |
| 19. | Winooski | 0.89% | 0.40%(+0.484)#19 | 0.29%(+0.601)#1,715 |
| 20. | West Brattleboro | 0.82% | 0.40%(+0.414)#20 | 0.29%(+0.531)#1,921 |
| 21. | Bellows Falls | 0.78% | 0.40%(+0.377)#21 | 0.29%(+0.494)#2,025 |
| 22. | St Johnsbury | 0.75% | 0.40%(+0.352)#22 | 0.29%(+0.469)#2,094 |
| 23. | Middlebury | 0.71% | 0.40%(+0.307)#23 | 0.29%(+0.423)#2,229 |
| 24. | Huntington | 0.68% | 0.40%(+0.277)#24 | 0.29%(+0.394)#2,330 |
| 25. | North Bennington | 0.63% | 0.40%(+0.232)#25 | 0.29%(+0.348)#2,496 |
| 26. | Derby Line | 0.58% | 0.40%(+0.176)#26 | 0.29%(+0.293)#2,751 |
| 27. | Cambridge | 0.51% | 0.40%(+0.103)#27 | 0.29%(+0.220)#3,115 |
| 28. | Arlington | 0.34% | 0.40%(-0.065)#28 | 0.29%(+0.051)#4,334 |
| 29. | Westminster | 0.33% | 0.40%(-0.069)#29 | 0.29%(+0.048)#4,378 |
| 30. | Essex Junction | 0.29% | 0.40%(-0.111)#30 | 0.29%(+0.006)#4,781 |
| 31. | Burlington | 0.26% | 0.40%(-0.145)#31 | 0.29%(-0.028)#5,140 |
| 32. | Shelburne | 0.24% | 0.40%(-0.160)#32 | 0.29%(-0.043)#5,322 |
| 33. | Morrisville | 0.23% | 0.40%(-0.169)#33 | 0.29%(-0.052)#5,439 |
| 34. | Wilder | 0.22% | 0.40%(-0.182)#34 | 0.29%(-0.065)#5,612 |
| 35. | Enosburg Falls | 0.19% | 0.40%(-0.209)#35 | 0.29%(-0.092)#5,992 |
| 36. | Brattleboro | 0.19% | 0.40%(-0.217)#36 | 0.29%(-0.100)#6,099 |
| 37. | Rutland | 0.18% | 0.40%(-0.225)#37 | 0.29%(-0.108)#6,228 |
| 38. | St Albans | 0.13% | 0.40%(-0.272)#38 | 0.29%(-0.155)#6,862 |
| 39. | Northfield | 0.091% | 0.40%(-0.311)#39 | 0.29%(-0.194)#7,403 |
| 40. | Montpelier | 0.087% | 0.40%(-0.315)#40 | 0.29%(-0.198)#7,476 |
1
2Common Questions
What are the Top 10 Cities with the Highest Percentage of Immigrants from Northern Europe in Vermont?
Top 10 Cities with the Highest Percentage of Immigrants from Northern Europe in Vermont are:
#1
14.08%
#2
6.06%
#3
4.76%
#4
4.02%
#5
3.04%
#6
2.53%
#7
2.33%
#8
2.10%
#9
1.91%
#10
1.71%
What city has the Highest Percentage of Immigrants from Northern Europe in Vermont?
Hartland has the Highest Percentage of Immigrants from Northern Europe in Vermont with 14.08%.
What is the Percentage of Immigrants from Northern Europe in the State of Vermont?
Percentage of Immigrants from Northern Europe in Vermont is 0.40%.
What is the Percentage of Immigrants from Northern Europe in the United States?
Percentage of Immigrants from Northern Europe in the United States is 0.29%.