West Laurel, MD
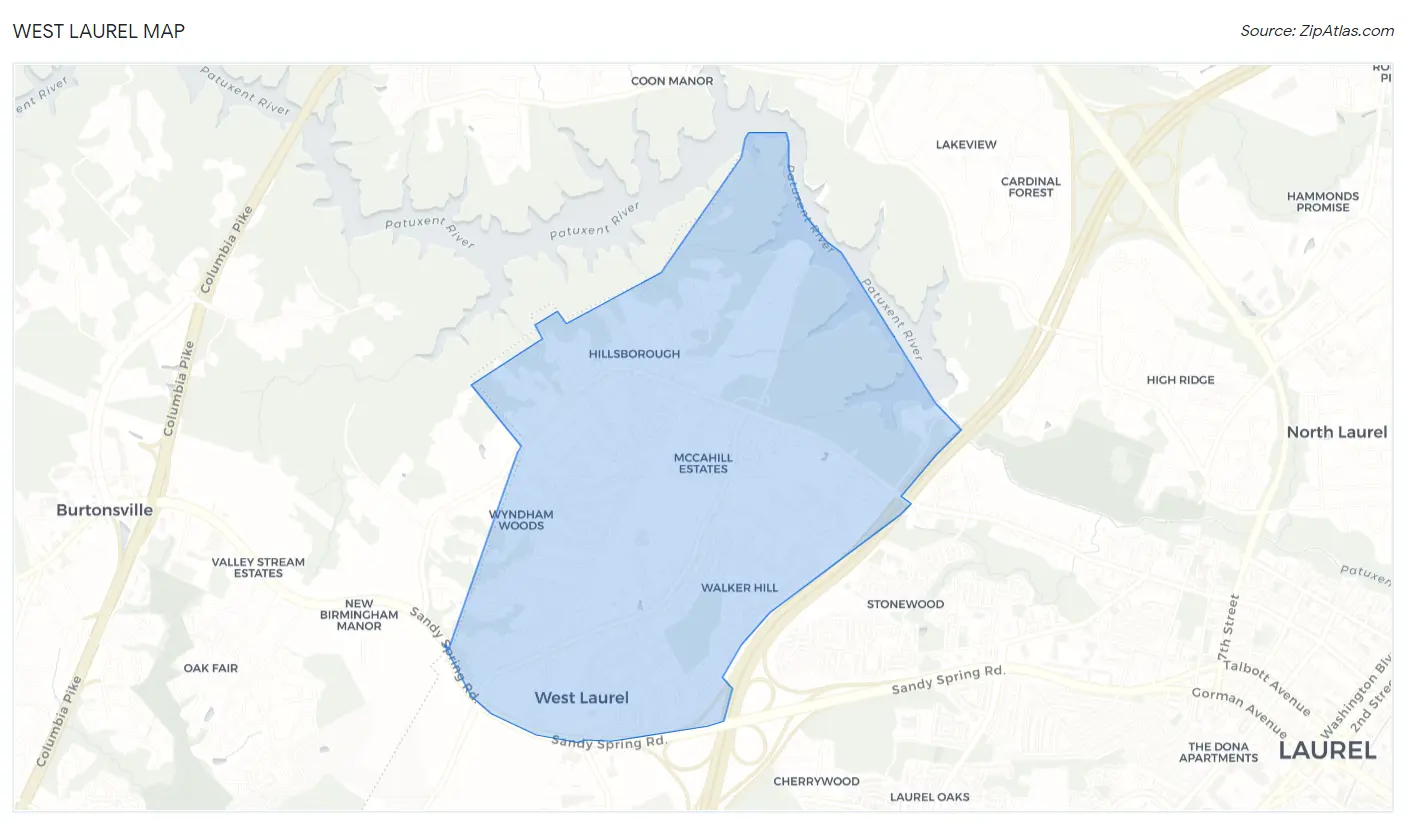
West Laurel Map
West Laurel Overview
4,332
TOTAL POPULATION
2,273
MALE POPULATION
2,059
FEMALE POPULATION
110.39
MALES / 100 FEMALES
90.59
FEMALES / 100 MALES
42.0
MEDIAN AGE
3.1
AVG FAMILY SIZE
2.8
AVG HOUSEHOLD SIZE
$57,923
PER CAPITA INCOME
$167,827
AVG FAMILY INCOME
$154,014
AVG HOUSEHOLD INCOME
21.5%
WAGE / INCOME GAP [ % ]
78.5¢/ $1
WAGE / INCOME GAP [ $ ]
0.30
INEQUALITY / GINI INDEX
2,509
LABOR FORCE [ PEOPLE ]
72.1%
PERCENT IN LABOR FORCE
2.8%
UNEMPLOYMENT RATE
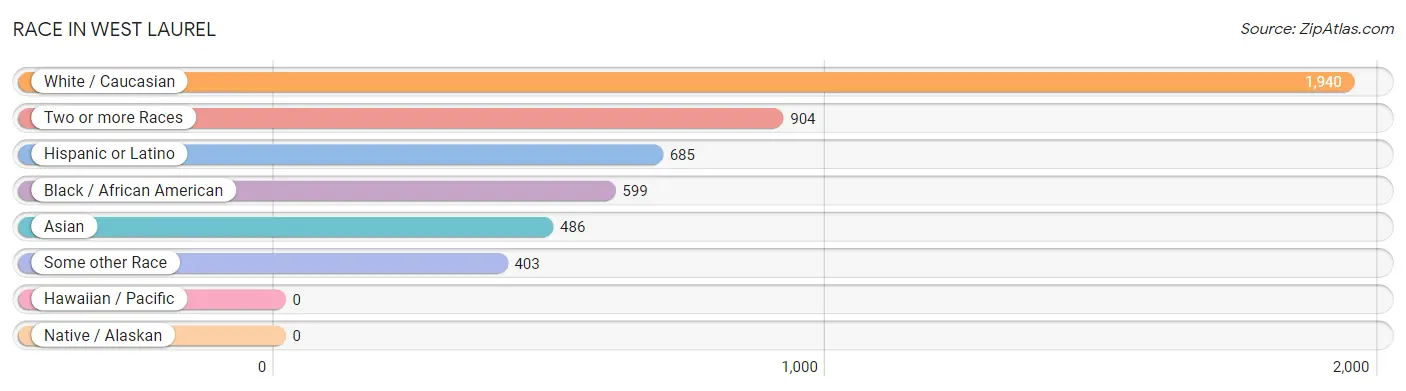
Race in West Laurel
The most populous races in West Laurel are White / Caucasian (1,940 | 44.8%), Two or more Races (904 | 20.9%), and Hispanic or Latino (685 | 15.8%).
| Race | # Population | % Population |
| Asian | 486 | 11.2% |
| Black / African American | 599 | 13.8% |
| Hawaiian / Pacific | 0 | 0.0% |
| Hispanic or Latino | 685 | 15.8% |
| Native / Alaskan | 0 | 0.0% |
| White / Caucasian | 1,940 | 44.8% |
| Two or more Races | 904 | 20.9% |
| Some other Race | 403 | 9.3% |
| Total | 4,332 | 100.0% |
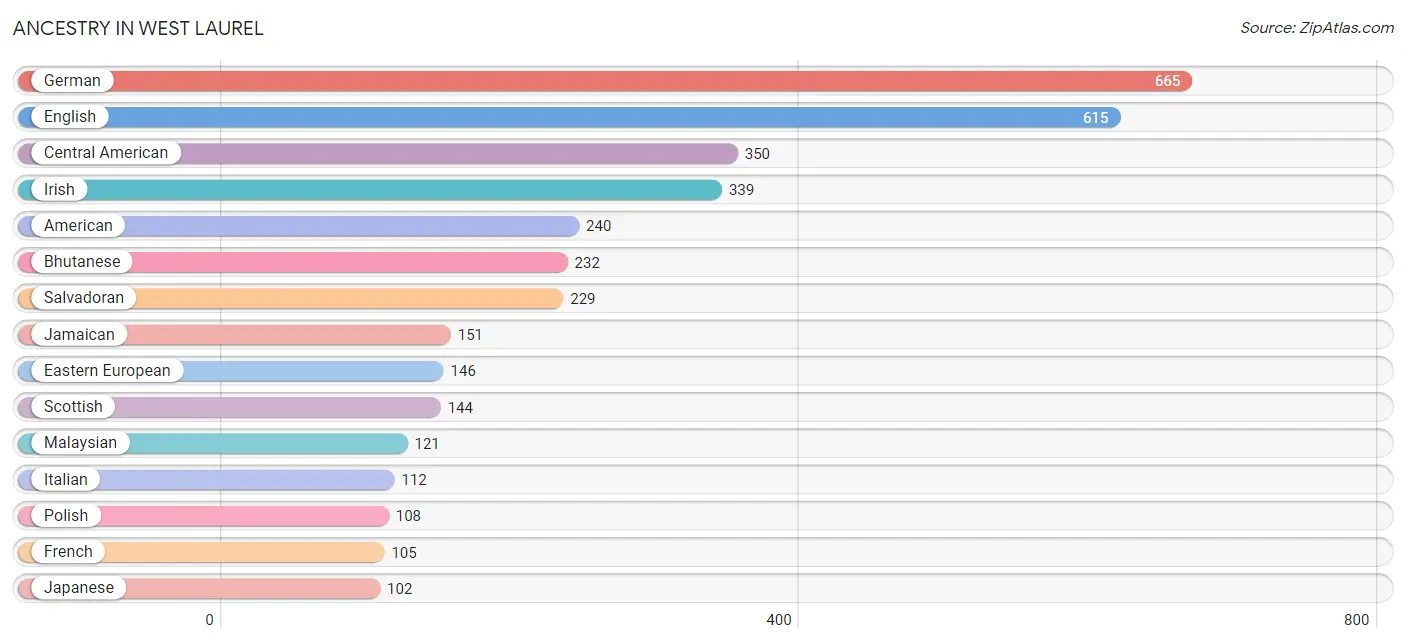
Ancestry in West Laurel
The most populous ancestries reported in West Laurel are German (665 | 15.3%), English (615 | 14.2%), Central American (350 | 8.1%), Irish (339 | 7.8%), and American (240 | 5.5%), together accounting for 51.0% of all West Laurel residents.
| Ancestry | # Population | % Population |
| African | 56 | 1.3% |
| American | 240 | 5.5% |
| Arab | 53 | 1.2% |
| Argentinean | 51 | 1.2% |
| Australian | 6 | 0.1% |
| Austrian | 13 | 0.3% |
| Bhutanese | 232 | 5.4% |
| Brazilian | 7 | 0.2% |
| British | 5 | 0.1% |
| Burmese | 85 | 2.0% |
| Canadian | 14 | 0.3% |
| Central American | 350 | 8.1% |
| Cuban | 10 | 0.2% |
| Czech | 7 | 0.2% |
| Dutch | 10 | 0.2% |
| Eastern European | 146 | 3.4% |
| English | 615 | 14.2% |
| Estonian | 7 | 0.2% |
| Ethiopian | 6 | 0.1% |
| European | 38 | 0.9% |
| Filipino | 35 | 0.8% |
| French | 105 | 2.4% |
| French Canadian | 7 | 0.2% |
| German | 665 | 15.3% |
| Ghanaian | 26 | 0.6% |
| Greek | 23 | 0.5% |
| Guatemalan | 88 | 2.0% |
| Guyanese | 30 | 0.7% |
| Haitian | 16 | 0.4% |
| Honduran | 33 | 0.8% |
| Hungarian | 12 | 0.3% |
| Irish | 339 | 7.8% |
| Italian | 112 | 2.6% |
| Jamaican | 151 | 3.5% |
| Japanese | 102 | 2.4% |
| Korean | 38 | 0.9% |
| Lebanese | 14 | 0.3% |
| Liberian | 39 | 0.9% |
| Malaysian | 121 | 2.8% |
| Mexican | 11 | 0.3% |
| Norwegian | 8 | 0.2% |
| Pakistani | 6 | 0.1% |
| Polish | 108 | 2.5% |
| Portuguese | 25 | 0.6% |
| Puerto Rican | 88 | 2.0% |
| Russian | 42 | 1.0% |
| Salvadoran | 229 | 5.3% |
| Scandinavian | 12 | 0.3% |
| Scotch-Irish | 17 | 0.4% |
| Scottish | 144 | 3.3% |
| Serbian | 10 | 0.2% |
| Slovene | 4 | 0.1% |
| South American | 51 | 1.2% |
| Sri Lankan | 32 | 0.7% |
| Subsaharan African | 102 | 2.4% |
| Swedish | 25 | 0.6% |
| Thai | 89 | 2.1% |
| Trinidadian and Tobagonian | 9 | 0.2% |
| Turkish | 23 | 0.5% |
| Welsh | 6 | 0.1% | View All 60 Rows |
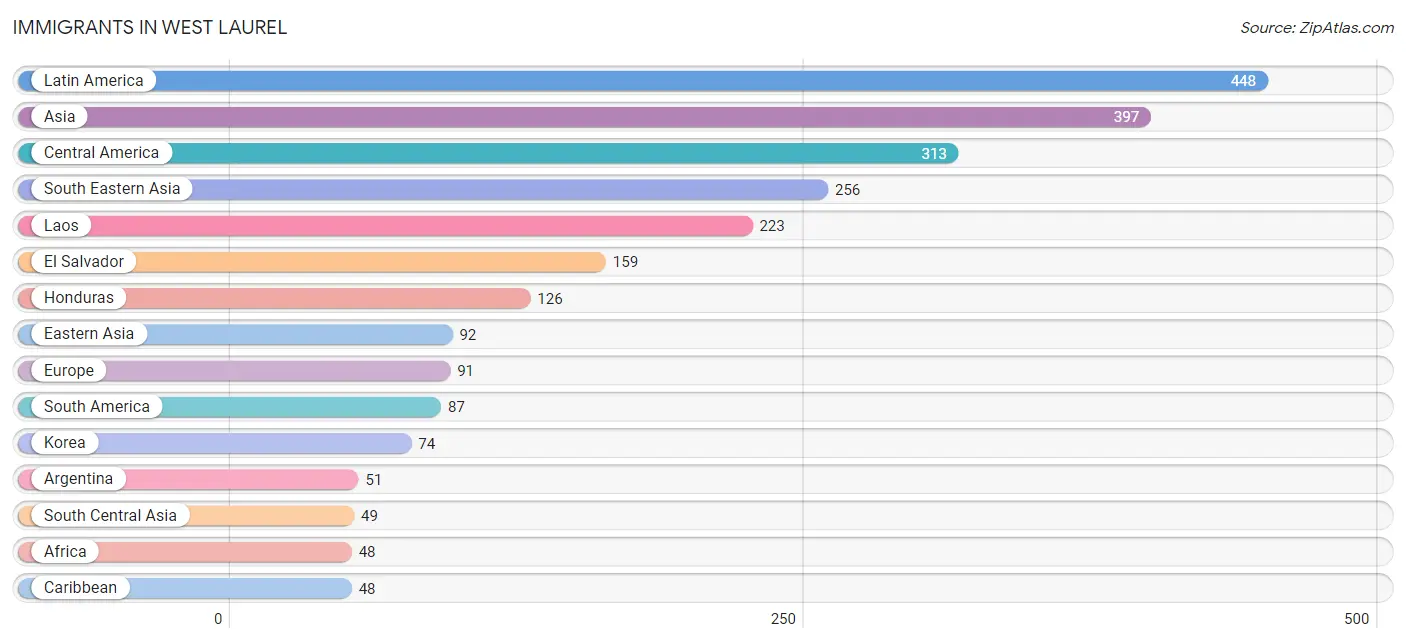
Immigrants in West Laurel
The most numerous immigrant groups reported in West Laurel came from Latin America (448 | 10.3%), Asia (397 | 9.2%), Central America (313 | 7.2%), South Eastern Asia (256 | 5.9%), and Laos (223 | 5.1%), together accounting for 37.8% of all West Laurel residents.
| Immigration Origin | # Population | % Population |
| Africa | 48 | 1.1% |
| Argentina | 51 | 1.2% |
| Asia | 397 | 9.2% |
| Bangladesh | 26 | 0.6% |
| Canada | 14 | 0.3% |
| Caribbean | 48 | 1.1% |
| Central America | 313 | 7.2% |
| China | 18 | 0.4% |
| Denmark | 7 | 0.2% |
| Eastern Africa | 6 | 0.1% |
| Eastern Asia | 92 | 2.1% |
| Eastern Europe | 35 | 0.8% |
| Egypt | 20 | 0.5% |
| El Salvador | 159 | 3.7% |
| Eritrea | 6 | 0.1% |
| Europe | 91 | 2.1% |
| Guatemala | 28 | 0.6% |
| Guyana | 28 | 0.6% |
| Haiti | 16 | 0.4% |
| Honduras | 126 | 2.9% |
| Hungary | 6 | 0.1% |
| India | 20 | 0.5% |
| Ireland | 24 | 0.5% |
| Jamaica | 23 | 0.5% |
| Korea | 74 | 1.7% |
| Laos | 223 | 5.1% |
| Latin America | 448 | 10.3% |
| Liberia | 13 | 0.3% |
| Northern Africa | 20 | 0.5% |
| Northern Europe | 31 | 0.7% |
| Pakistan | 3 | 0.1% |
| Peru | 8 | 0.2% |
| Portugal | 25 | 0.6% |
| Russia | 12 | 0.3% |
| Serbia | 10 | 0.2% |
| Sierra Leone | 2 | 0.1% |
| South America | 87 | 2.0% |
| South Central Asia | 49 | 1.1% |
| South Eastern Asia | 256 | 5.9% |
| Southern Europe | 25 | 0.6% |
| Taiwan | 18 | 0.4% |
| Trinidad and Tobago | 9 | 0.2% |
| Vietnam | 19 | 0.4% |
| Western Africa | 22 | 0.5% | View All 44 Rows |
Sex and Age in West Laurel
Sex and Age in West Laurel
The most populous age groups in West Laurel are 40 to 44 Years (343 | 15.1%) for men and 55 to 59 Years (308 | 15.0%) for women.
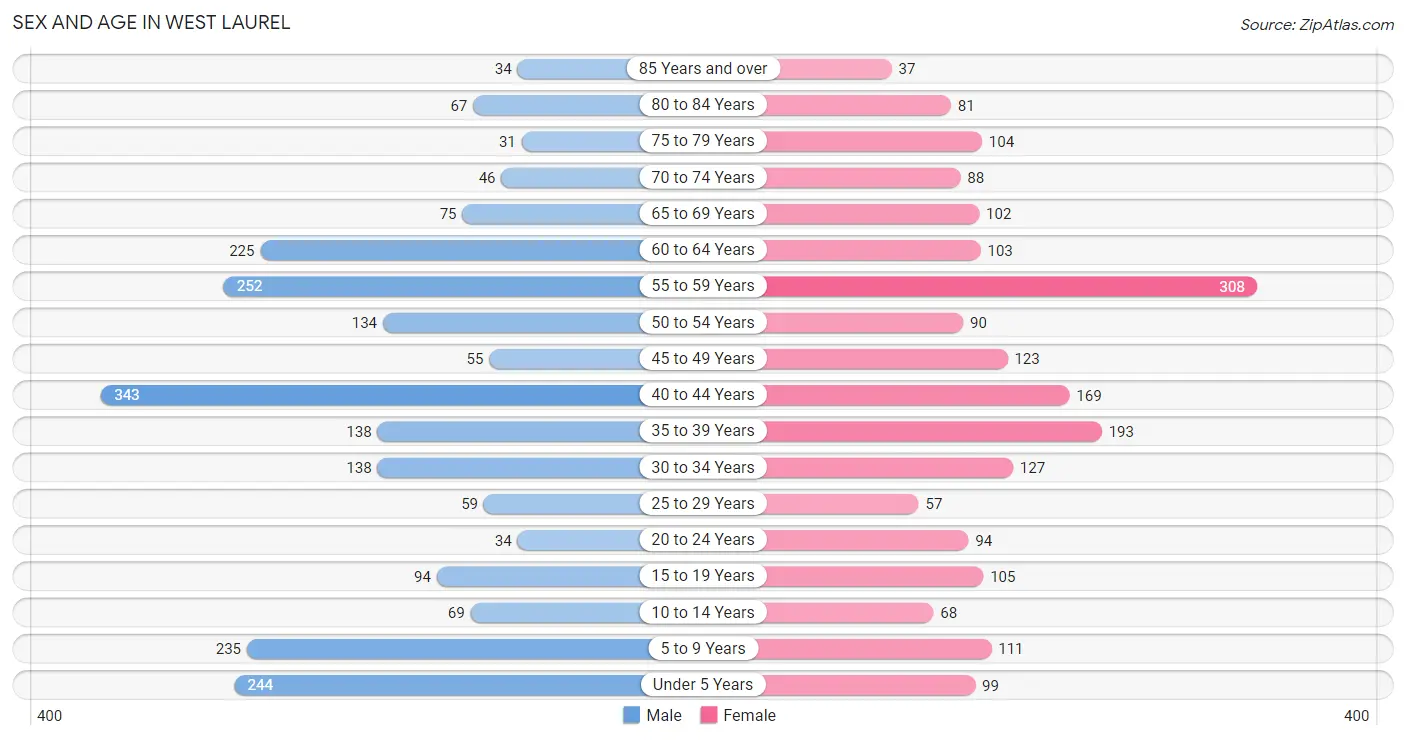
| Age Bracket | Male | Female |
| Under 5 Years | 244 (10.7%) | 99 (4.8%) |
| 5 to 9 Years | 235 (10.3%) | 111 (5.4%) |
| 10 to 14 Years | 69 (3.0%) | 68 (3.3%) |
| 15 to 19 Years | 94 (4.1%) | 105 (5.1%) |
| 20 to 24 Years | 34 (1.5%) | 94 (4.6%) |
| 25 to 29 Years | 59 (2.6%) | 57 (2.8%) |
| 30 to 34 Years | 138 (6.1%) | 127 (6.2%) |
| 35 to 39 Years | 138 (6.1%) | 193 (9.4%) |
| 40 to 44 Years | 343 (15.1%) | 169 (8.2%) |
| 45 to 49 Years | 55 (2.4%) | 123 (6.0%) |
| 50 to 54 Years | 134 (5.9%) | 90 (4.4%) |
| 55 to 59 Years | 252 (11.1%) | 308 (15.0%) |
| 60 to 64 Years | 225 (9.9%) | 103 (5.0%) |
| 65 to 69 Years | 75 (3.3%) | 102 (5.0%) |
| 70 to 74 Years | 46 (2.0%) | 88 (4.3%) |
| 75 to 79 Years | 31 (1.4%) | 104 (5.1%) |
| 80 to 84 Years | 67 (2.9%) | 81 (3.9%) |
| 85 Years and over | 34 (1.5%) | 37 (1.8%) |
| Total | 2,273 (100.0%) | 2,059 (100.0%) |
Families and Households in West Laurel
Median Family Size in West Laurel
The median family size in West Laurel is 3.12 persons per family, with single male/father families (80 | 6.6%) accounting for the largest median family size of 3.54 persons per family. On the other hand, married-couple families (1,010 | 82.9%) represent the smallest median family size with 3.03 persons per family.
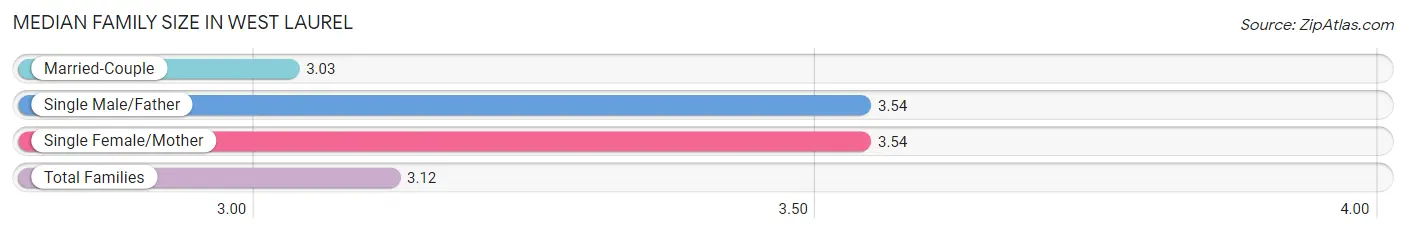
| Family Type | # Families | Family Size |
| Married-Couple | 1,010 (82.9%) | 3.03 |
| Single Male/Father | 80 (6.6%) | 3.54 |
| Single Female/Mother | 129 (10.6%) | 3.54 |
| Total Families | 1,219 (100.0%) | 3.12 |
Median Household Size in West Laurel
The median household size in West Laurel is 2.84 persons per household, with single male/father households (80 | 5.3%) accounting for the largest median household size of 4.05 persons per household. non-family households (294 | 19.4%) represent the smallest median household size with 1.40 persons per household.
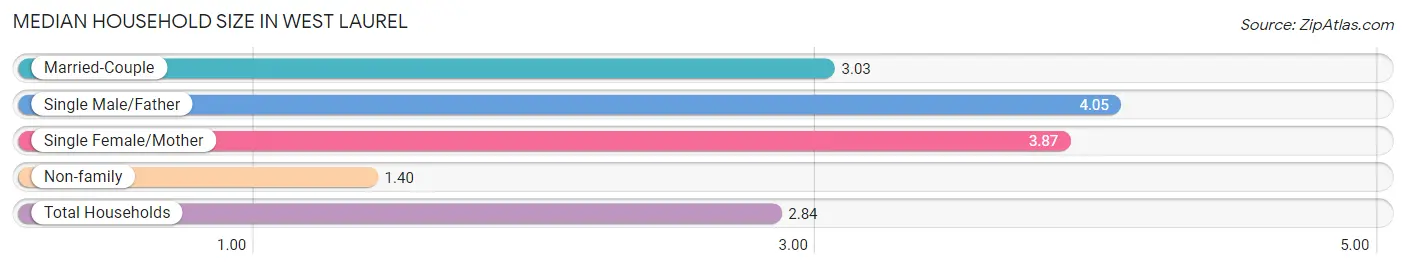
| Household Type | # Households | Household Size |
| Married-Couple | 1,010 (66.7%) | 3.03 |
| Single Male/Father | 80 (5.3%) | 4.05 |
| Single Female/Mother | 129 (8.5%) | 3.87 |
| Non-family | 294 (19.4%) | 1.40 |
| Total Households | 1,513 (100.0%) | 2.84 |
Household Size by Marriage Status in West Laurel
Out of a total of 1,513 households in West Laurel, 1,219 (80.6%) are family households, while 294 (19.4%) are nonfamily households. The most numerous type of family households are 2-person households, comprising 496, and the most common type of nonfamily households are 1-person households, comprising 153.
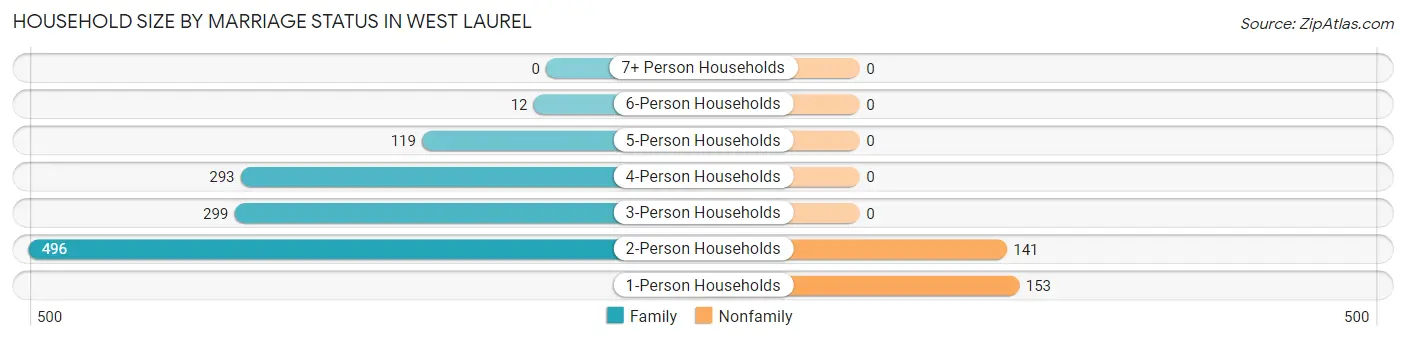
| Household Size | Family Households | Nonfamily Households |
| 1-Person Households | - | 153 (10.1%) |
| 2-Person Households | 496 (32.8%) | 141 (9.3%) |
| 3-Person Households | 299 (19.8%) | 0 (0.0%) |
| 4-Person Households | 293 (19.4%) | 0 (0.0%) |
| 5-Person Households | 119 (7.9%) | 0 (0.0%) |
| 6-Person Households | 12 (0.8%) | 0 (0.0%) |
| 7+ Person Households | 0 (0.0%) | 0 (0.0%) |
| Total | 1,219 (80.6%) | 294 (19.4%) |
Female Fertility in West Laurel
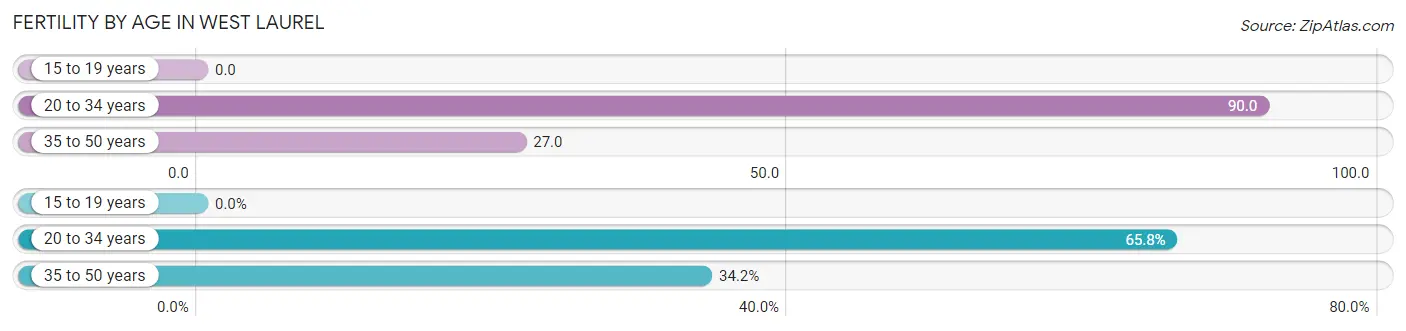
Fertility by Age in West Laurel
Average fertility rate in West Laurel is 44.0 births per 1,000 women. Women in the age bracket of 20 to 34 years have the highest fertility rate with 90.0 births per 1,000 women. Women in the age bracket of 20 to 34 years acount for 65.8% of all women with births.
| Age Bracket | Women with Births | Births / 1,000 Women |
| 15 to 19 years | 0 (0.0%) | 0.0 |
| 20 to 34 years | 25 (65.8%) | 90.0 |
| 35 to 50 years | 13 (34.2%) | 27.0 |
| Total | 38 (100.0%) | 44.0 |
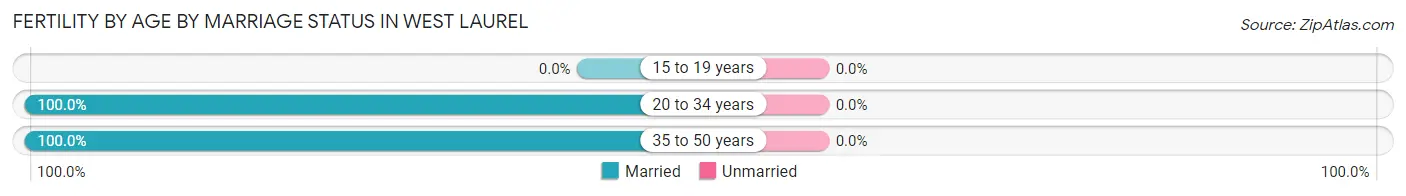
Fertility by Age by Marriage Status in West Laurel
| Age Bracket | Married | Unmarried |
| 15 to 19 years | 0 (0.0%) | 0 (0.0%) |
| 20 to 34 years | 25 (100.0%) | 0 (0.0%) |
| 35 to 50 years | 13 (100.0%) | 0 (0.0%) |
| Total | 38 (100.0%) | 0 (0.0%) |
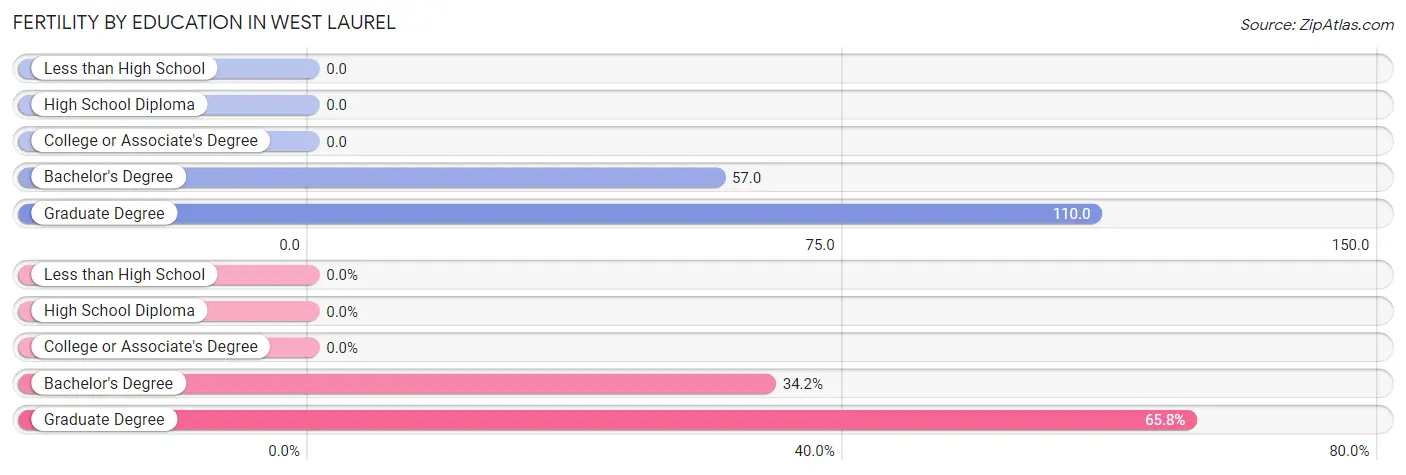
Fertility by Education in West Laurel
| Educational Attainment | Women with Births | Births / 1,000 Women |
| Less than High School | 0 (0.0%) | 0.0 |
| High School Diploma | 0 (0.0%) | 0.0 |
| College or Associate's Degree | 0 (0.0%) | 0.0 |
| Bachelor's Degree | 13 (34.2%) | 57.0 |
| Graduate Degree | 25 (65.8%) | 110.0 |
| Total | 38 (100.0%) | 44.0 |
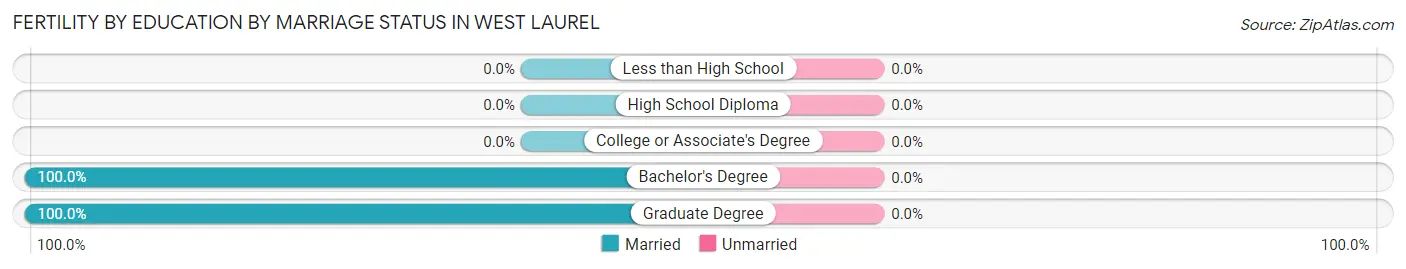
Fertility by Education by Marriage Status in West Laurel
| Educational Attainment | Married | Unmarried |
| Less than High School | 0 (0.0%) | 0 (0.0%) |
| High School Diploma | 0 (0.0%) | 0 (0.0%) |
| College or Associate's Degree | 0 (0.0%) | 0 (0.0%) |
| Bachelor's Degree | 13 (100.0%) | 0 (0.0%) |
| Graduate Degree | 25 (100.0%) | 0 (0.0%) |
| Total | 38 (100.0%) | 0 (0.0%) |
Income in West Laurel
Income Overview in West Laurel
Per Capita Income in West Laurel is $57,923, while median incomes of families and households are $167,827 and $154,014 respectively.
| Characteristic | Number | Measure |
| Per Capita Income | 4,332 | $57,923 |
| Median Family Income | 1,219 | $167,827 |
| Mean Family Income | 1,219 | $181,449 |
| Median Household Income | 1,513 | $154,014 |
| Mean Household Income | 1,513 | $163,548 |
| Income Deficit | 1,219 | $0 |
| Wage / Income Gap (%) | 4,332 | 21.49% |
| Wage / Income Gap ($) | 4,332 | 78.51¢ per $1 |
| Gini / Inequality Index | 4,332 | 0.30 |
Earnings by Sex in West Laurel
Average Earnings in West Laurel are $69,036, $72,138 for men and $56,635 for women, a difference of 21.5%.
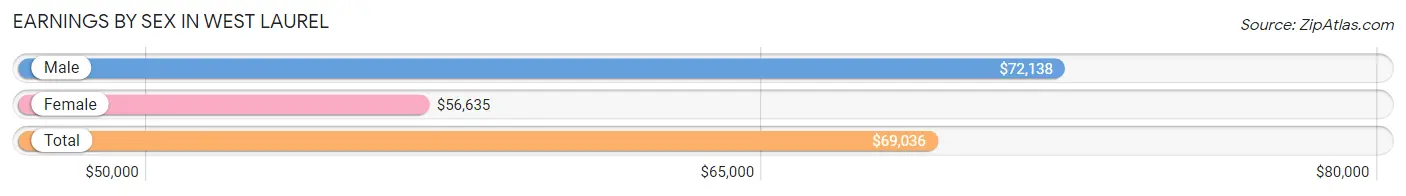
| Sex | Number | Average Earnings |
| Male | 1,398 (52.0%) | $72,138 |
| Female | 1,291 (48.0%) | $56,635 |
| Total | 2,689 (100.0%) | $69,036 |
Earnings by Sex by Income Bracket in West Laurel
The most common earnings brackets in West Laurel are $100,000+ for men (498 | 35.6%) and $75,000 to $99,999 for women (283 | 21.9%).
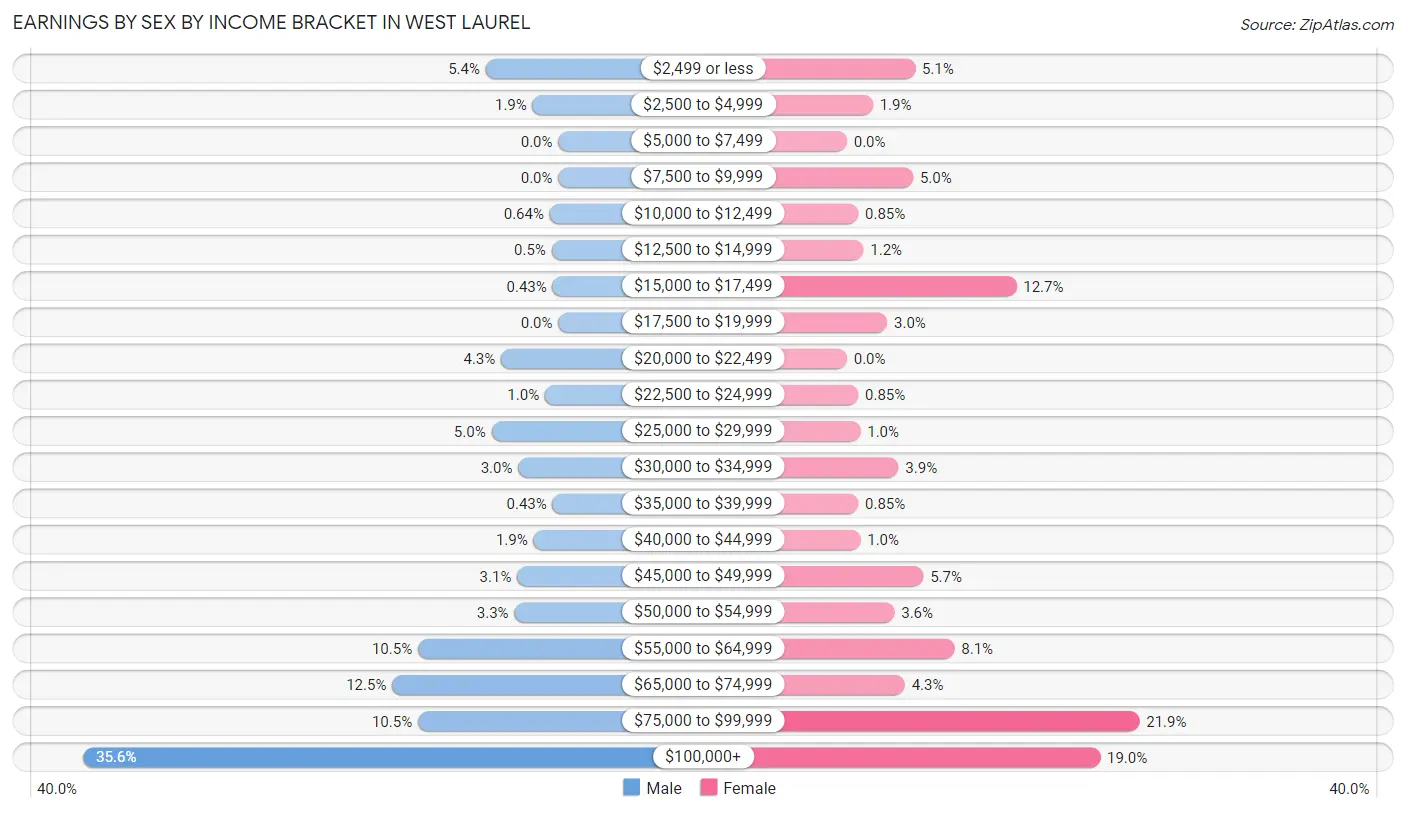
| Income | Male | Female |
| $2,499 or less | 76 (5.4%) | 66 (5.1%) |
| $2,500 to $4,999 | 27 (1.9%) | 25 (1.9%) |
| $5,000 to $7,499 | 0 (0.0%) | 0 (0.0%) |
| $7,500 to $9,999 | 0 (0.0%) | 64 (5.0%) |
| $10,000 to $12,499 | 9 (0.6%) | 11 (0.9%) |
| $12,500 to $14,999 | 7 (0.5%) | 16 (1.2%) |
| $15,000 to $17,499 | 6 (0.4%) | 164 (12.7%) |
| $17,500 to $19,999 | 0 (0.0%) | 39 (3.0%) |
| $20,000 to $22,499 | 60 (4.3%) | 0 (0.0%) |
| $22,500 to $24,999 | 14 (1.0%) | 11 (0.9%) |
| $25,000 to $29,999 | 70 (5.0%) | 13 (1.0%) |
| $30,000 to $34,999 | 42 (3.0%) | 50 (3.9%) |
| $35,000 to $39,999 | 6 (0.4%) | 11 (0.9%) |
| $40,000 to $44,999 | 26 (1.9%) | 13 (1.0%) |
| $45,000 to $49,999 | 43 (3.1%) | 74 (5.7%) |
| $50,000 to $54,999 | 46 (3.3%) | 46 (3.6%) |
| $55,000 to $64,999 | 147 (10.5%) | 104 (8.1%) |
| $65,000 to $74,999 | 174 (12.4%) | 56 (4.3%) |
| $75,000 to $99,999 | 147 (10.5%) | 283 (21.9%) |
| $100,000+ | 498 (35.6%) | 245 (19.0%) |
| Total | 1,398 (100.0%) | 1,291 (100.0%) |
Earnings by Sex by Educational Attainment in West Laurel
Average earnings in West Laurel are $74,375 for men and $64,911 for women, a difference of 12.7%. Men with an educational attainment of less than high school enjoy the highest average annual earnings of $178,681, while those with high school diploma education earn the least with $55,857. Women with an educational attainment of graduate degree earn the most with the average annual earnings of $81,322, while those with less than high school education have the smallest earnings of $2,499.
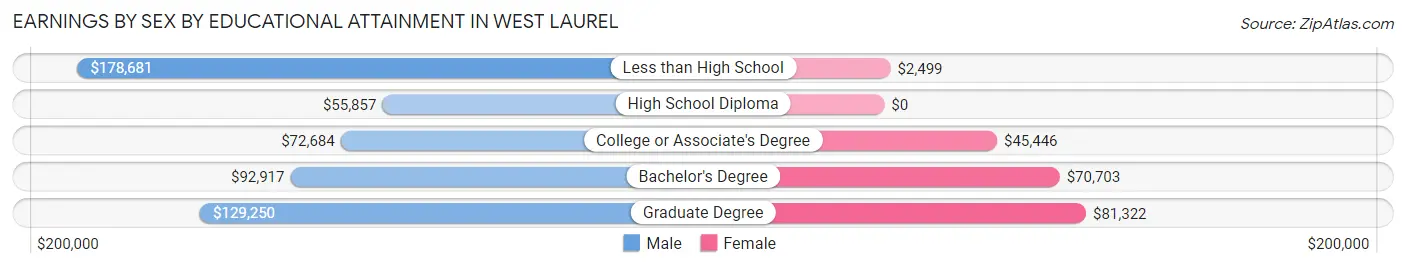
| Educational Attainment | Male Income | Female Income |
| Less than High School | $178,681 | $2,499 |
| High School Diploma | $55,857 | $0 |
| College or Associate's Degree | $72,684 | $45,446 |
| Bachelor's Degree | $92,917 | $70,703 |
| Graduate Degree | $129,250 | $81,322 |
| Total | $74,375 | $64,911 |
Family Income in West Laurel
Family Income Brackets in West Laurel
According to the West Laurel family income data, there are 438 families falling into the $150,000 to $199,999 income range, which is the most common income bracket and makes up 35.9% of all families.
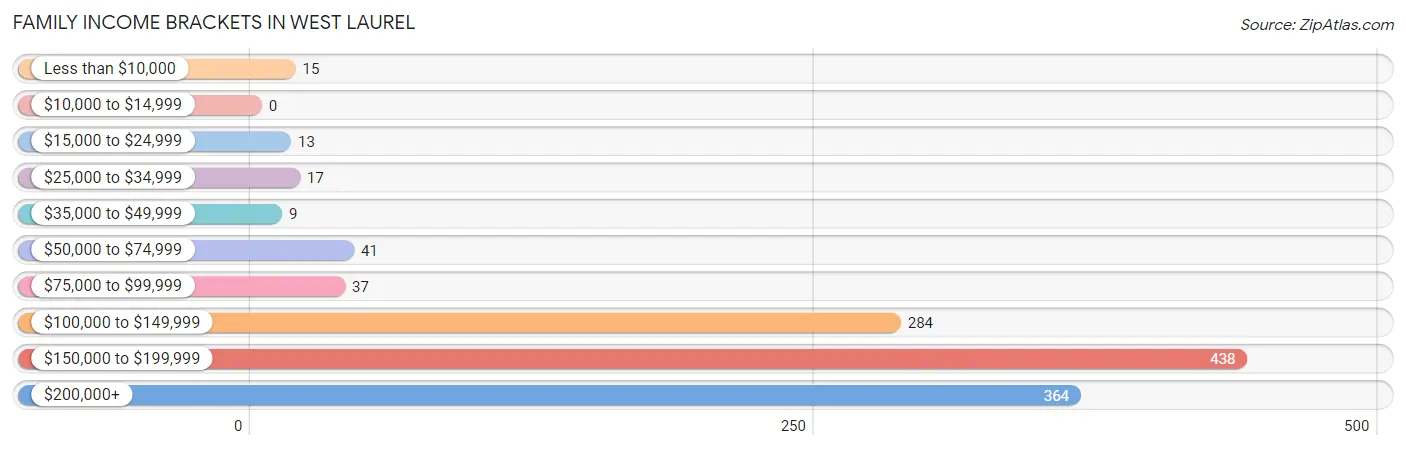
| Income Bracket | # Families | % Families |
| Less than $10,000 | 15 | 1.2% |
| $10,000 to $14,999 | 0 | 0.0% |
| $15,000 to $24,999 | 13 | 1.1% |
| $25,000 to $34,999 | 17 | 1.4% |
| $35,000 to $49,999 | 9 | 0.7% |
| $50,000 to $74,999 | 41 | 3.4% |
| $75,000 to $99,999 | 37 | 3.0% |
| $100,000 to $149,999 | 284 | 23.3% |
| $150,000 to $199,999 | 438 | 35.9% |
| $200,000+ | 364 | 29.9% |
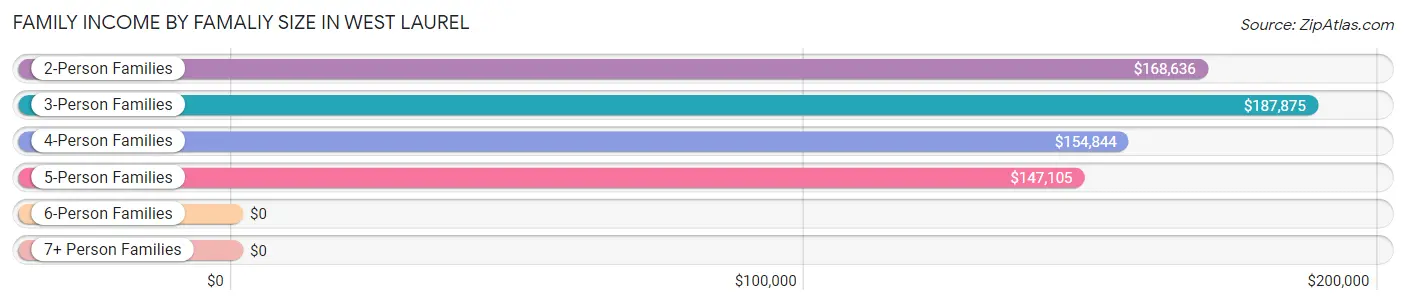
Family Income by Famaliy Size in West Laurel
3-person families (251 | 20.6%) account for the highest median family income in West Laurel with $187,875 per family, while 2-person families (544 | 44.6%) have the highest median income of $84,318 per family member.
| Income Bracket | # Families | Median Income |
| 2-Person Families | 544 (44.6%) | $168,636 |
| 3-Person Families | 251 (20.6%) | $187,875 |
| 4-Person Families | 326 (26.7%) | $154,844 |
| 5-Person Families | 86 (7.0%) | $147,105 |
| 6-Person Families | 12 (1.0%) | $0 |
| 7+ Person Families | 0 (0.0%) | $0 |
| Total | 1,219 (100.0%) | $167,827 |
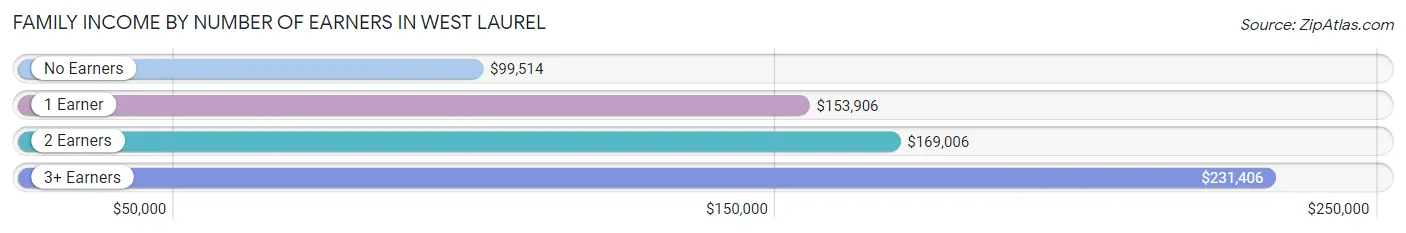
Family Income by Number of Earners in West Laurel
The median family income in West Laurel is $167,827, with families comprising 3+ earners (243) having the highest median family income of $231,406, while families with no earners (103) have the lowest median family income of $99,514, accounting for 19.9% and 8.5% of families, respectively.
| Number of Earners | # Families | Median Income |
| No Earners | 103 (8.5%) | $99,514 |
| 1 Earner | 259 (21.2%) | $153,906 |
| 2 Earners | 614 (50.4%) | $169,006 |
| 3+ Earners | 243 (19.9%) | $231,406 |
| Total | 1,219 (100.0%) | $167,827 |
Household Income in West Laurel
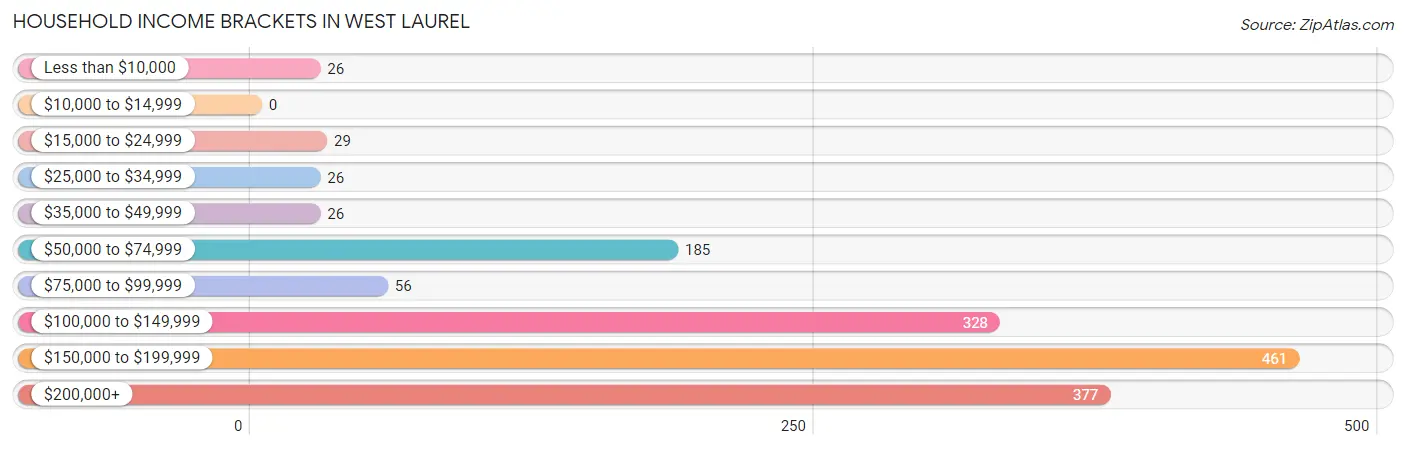
Household Income Brackets in West Laurel
With 461 households falling in the category, the $150,000 to $199,999 income range is the most frequent in West Laurel, accounting for 30.5% of all households.
| Income Bracket | # Households | % Households |
| Less than $10,000 | 26 | 1.7% |
| $10,000 to $14,999 | 0 | 0.0% |
| $15,000 to $24,999 | 29 | 1.9% |
| $25,000 to $34,999 | 26 | 1.7% |
| $35,000 to $49,999 | 26 | 1.7% |
| $50,000 to $74,999 | 185 | 12.2% |
| $75,000 to $99,999 | 56 | 3.7% |
| $100,000 to $149,999 | 328 | 21.7% |
| $150,000 to $199,999 | 461 | 30.5% |
| $200,000+ | 377 | 24.9% |
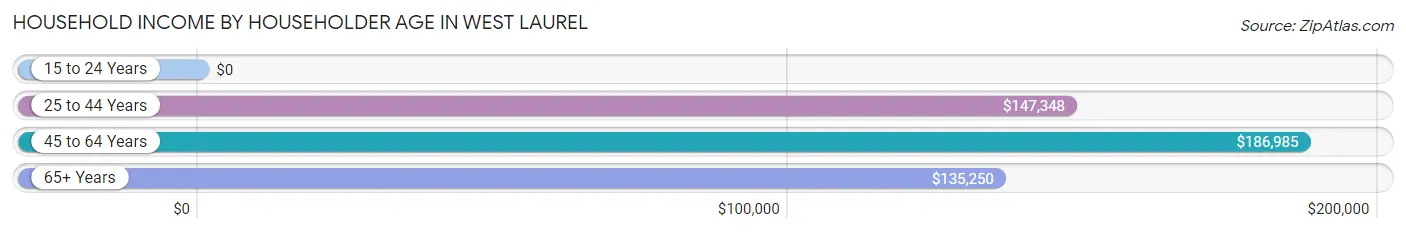
Household Income by Householder Age in West Laurel
The median household income in West Laurel is $154,014, with the highest median household income of $186,985 found in the 45 to 64 years age bracket for the primary householder. A total of 649 households (42.9%) fall into this category.
| Income Bracket | # Households | Median Income |
| 15 to 24 Years | 0 (0.0%) | $0 |
| 25 to 44 Years | 502 (33.2%) | $147,348 |
| 45 to 64 Years | 649 (42.9%) | $186,985 |
| 65+ Years | 362 (23.9%) | $135,250 |
| Total | 1,513 (100.0%) | $154,014 |
Poverty in West Laurel
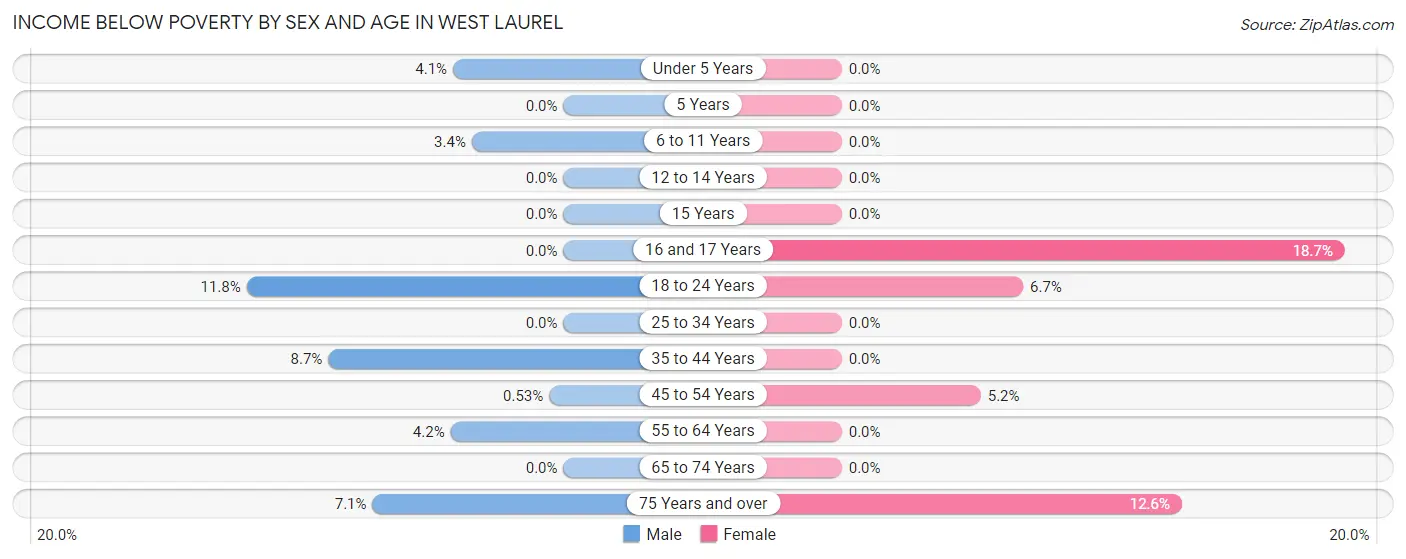
Income Below Poverty by Sex and Age in West Laurel
With 4.2% poverty level for males and 2.8% for females among the residents of West Laurel, 18 to 24 year old males and 16 and 17 year old females are the most vulnerable to poverty, with 6 males (11.8%) and 14 females (18.7%) in their respective age groups living below the poverty level.
| Age Bracket | Male | Female |
| Under 5 Years | 10 (4.1%) | 0 (0.0%) |
| 5 Years | 0 (0.0%) | 0 (0.0%) |
| 6 to 11 Years | 7 (3.4%) | 0 (0.0%) |
| 12 to 14 Years | 0 (0.0%) | 0 (0.0%) |
| 15 Years | 0 (0.0%) | 0 (0.0%) |
| 16 and 17 Years | 0 (0.0%) | 14 (18.7%) |
| 18 to 24 Years | 6 (11.8%) | 7 (6.7%) |
| 25 to 34 Years | 0 (0.0%) | 0 (0.0%) |
| 35 to 44 Years | 42 (8.7%) | 0 (0.0%) |
| 45 to 54 Years | 1 (0.5%) | 11 (5.2%) |
| 55 to 64 Years | 20 (4.2%) | 0 (0.0%) |
| 65 to 74 Years | 0 (0.0%) | 0 (0.0%) |
| 75 Years and over | 9 (7.1%) | 26 (12.6%) |
| Total | 95 (4.2%) | 58 (2.8%) |
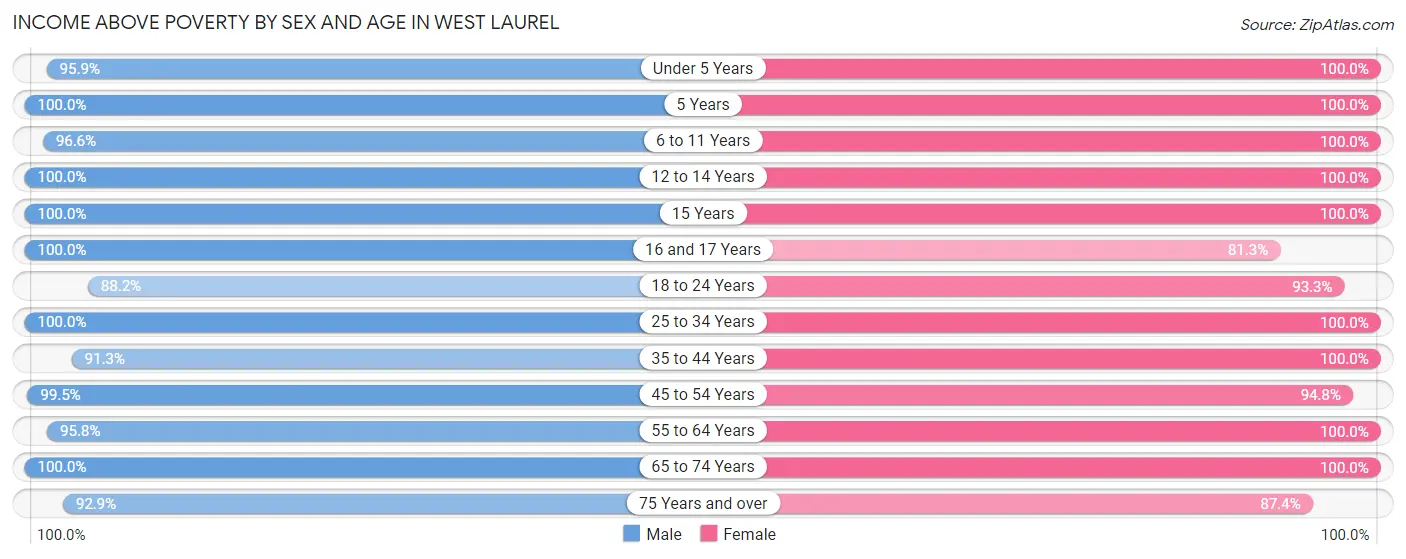
Income Above Poverty by Sex and Age in West Laurel
According to the poverty statistics in West Laurel, males aged 5 years and females aged under 5 years are the age groups that are most secure financially, with 100.0% of males and 100.0% of females in these age groups living above the poverty line.
| Age Bracket | Male | Female |
| Under 5 Years | 234 (95.9%) | 99 (100.0%) |
| 5 Years | 43 (100.0%) | 38 (100.0%) |
| 6 to 11 Years | 199 (96.6%) | 92 (100.0%) |
| 12 to 14 Years | 55 (100.0%) | 49 (100.0%) |
| 15 Years | 6 (100.0%) | 20 (100.0%) |
| 16 and 17 Years | 71 (100.0%) | 61 (81.3%) |
| 18 to 24 Years | 45 (88.2%) | 97 (93.3%) |
| 25 to 34 Years | 197 (100.0%) | 182 (100.0%) |
| 35 to 44 Years | 439 (91.3%) | 362 (100.0%) |
| 45 to 54 Years | 188 (99.5%) | 202 (94.8%) |
| 55 to 64 Years | 457 (95.8%) | 411 (100.0%) |
| 65 to 74 Years | 117 (100.0%) | 190 (100.0%) |
| 75 Years and over | 118 (92.9%) | 180 (87.4%) |
| Total | 2,169 (95.8%) | 1,983 (97.2%) |
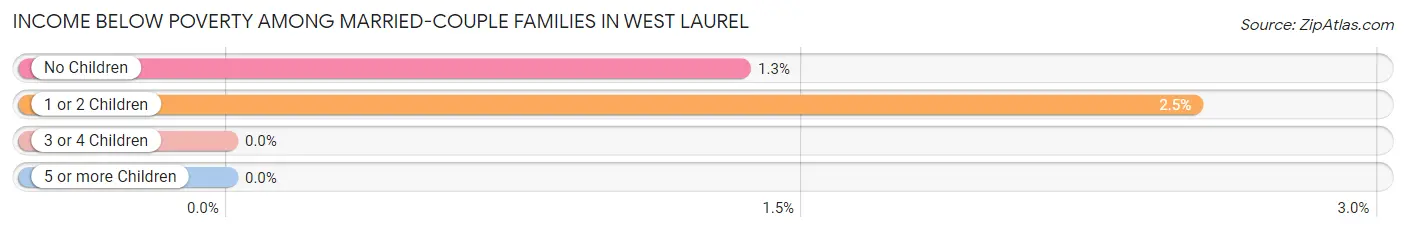
Income Below Poverty Among Married-Couple Families in West Laurel
The poverty statistics for married-couple families in West Laurel show that 1.7% or 17 of the total 1,010 families live below the poverty line. Families with 1 or 2 children have the highest poverty rate of 2.5%, comprising of 9 families. On the other hand, families with 3 or 4 children have the lowest poverty rate of 0.0%, which includes 0 families.
| Children | Above Poverty | Below Poverty |
| No Children | 588 (98.7%) | 8 (1.3%) |
| 1 or 2 Children | 348 (97.5%) | 9 (2.5%) |
| 3 or 4 Children | 57 (100.0%) | 0 (0.0%) |
| 5 or more Children | 0 (0.0%) | 0 (0.0%) |
| Total | 993 (98.3%) | 17 (1.7%) |
Income Below Poverty Among Single-Parent Households in West Laurel
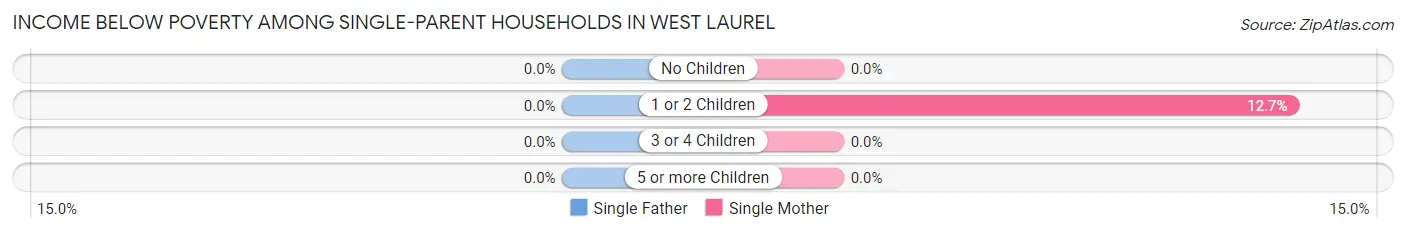
| Children | Single Father | Single Mother |
| No Children | 0 (0.0%) | 0 (0.0%) |
| 1 or 2 Children | 0 (0.0%) | 7 (12.7%) |
| 3 or 4 Children | 0 (0.0%) | 0 (0.0%) |
| 5 or more Children | 0 (0.0%) | 0 (0.0%) |
| Total | 0 (0.0%) | 7 (5.4%) |
Income Below Poverty Among Married-Couple vs Single-Parent Households in West Laurel
The poverty data for West Laurel shows that 17 of the married-couple family households (1.7%) and 7 of the single-parent households (3.4%) are living below the poverty level. Within the married-couple family households, those with 1 or 2 children have the highest poverty rate, with 9 households (2.5%) falling below the poverty line. Among the single-parent households, those with 1 or 2 children have the highest poverty rate, with 7 household (9.6%) living below poverty.
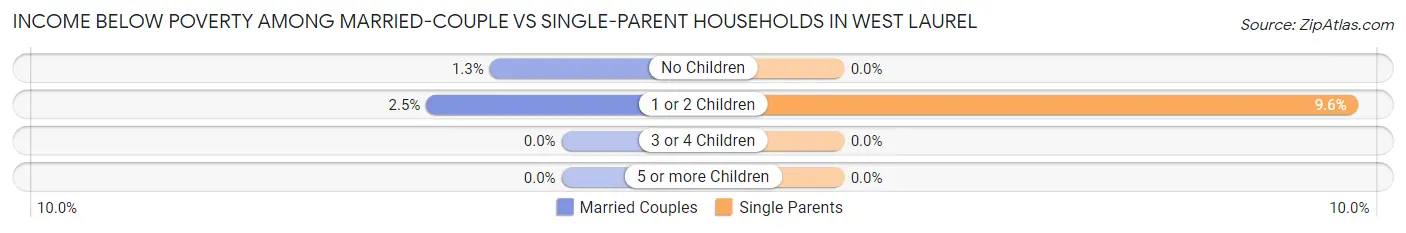
| Children | Married-Couple Families | Single-Parent Households |
| No Children | 8 (1.3%) | 0 (0.0%) |
| 1 or 2 Children | 9 (2.5%) | 7 (9.6%) |
| 3 or 4 Children | 0 (0.0%) | 0 (0.0%) |
| 5 or more Children | 0 (0.0%) | 0 (0.0%) |
| Total | 17 (1.7%) | 7 (3.4%) |
Employment Characteristics in West Laurel
Employment by Class of Employer in West Laurel
Among the 2,290 employed individuals in West Laurel, private company employees (1,089 | 47.5%), not-for-profit organizations (521 | 22.8%), and federal government employees (208 | 9.1%) make up the most common classes of employment.
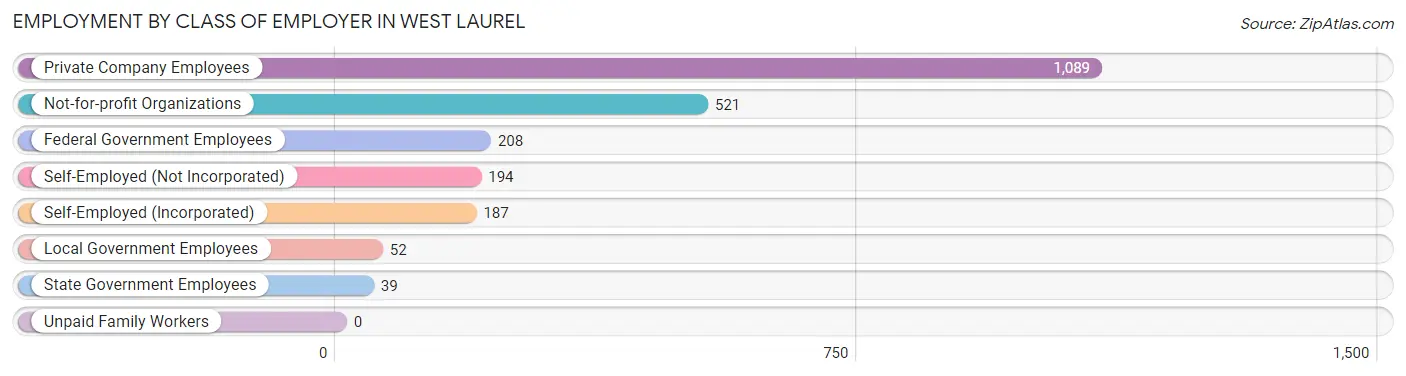
| Employer Class | # Employees | % Employees |
| Private Company Employees | 1,089 | 47.5% |
| Self-Employed (Incorporated) | 187 | 8.2% |
| Self-Employed (Not Incorporated) | 194 | 8.5% |
| Not-for-profit Organizations | 521 | 22.8% |
| Local Government Employees | 52 | 2.3% |
| State Government Employees | 39 | 1.7% |
| Federal Government Employees | 208 | 9.1% |
| Unpaid Family Workers | 0 | 0.0% |
| Total | 2,290 | 100.0% |
Employment Status by Age in West Laurel
According to the labor force statistics for West Laurel, out of the total population over 16 years of age (3,480), 72.1% or 2,509 individuals are in the labor force, with 2.8% or 70 of them unemployed. The age group with the highest labor force participation rate is 30 to 34 years, with 97.4% or 258 individuals in the labor force. Within the labor force, the 55 to 59 years age range has the highest percentage of unemployed individuals, with 7.8% or 35 of them being unemployed.
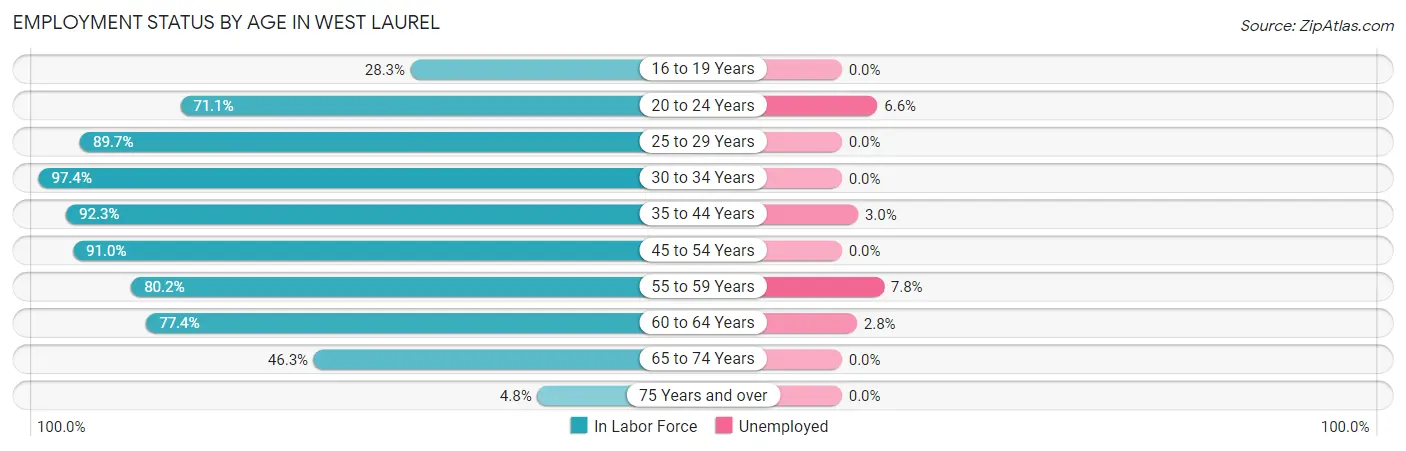
| Age Bracket | In Labor Force | Unemployed |
| 16 to 19 Years | 49 (28.3%) | 0 (0.0%) |
| 20 to 24 Years | 91 (71.1%) | 6 (6.6%) |
| 25 to 29 Years | 104 (89.7%) | 0 (0.0%) |
| 30 to 34 Years | 258 (97.4%) | 0 (0.0%) |
| 35 to 44 Years | 778 (92.3%) | 23 (3.0%) |
| 45 to 54 Years | 366 (91.0%) | 0 (0.0%) |
| 55 to 59 Years | 449 (80.2%) | 35 (7.8%) |
| 60 to 64 Years | 254 (77.4%) | 7 (2.8%) |
| 65 to 74 Years | 144 (46.3%) | 0 (0.0%) |
| 75 Years and over | 17 (4.8%) | 0 (0.0%) |
| Total | 2,509 (72.1%) | 70 (2.8%) |
Employment Status by Educational Attainment in West Laurel
According to labor force statistics for West Laurel, 87.9% of individuals (2,210) out of the total population between 25 and 64 years of age (2,514) are in the labor force, with 2.9% or 64 of them being unemployed. The group with the highest labor force participation rate are those with the educational attainment of bachelor's degree or higher, with 92.2% or 1,047 individuals in the labor force. Within the labor force, individuals with less than high school education have the highest percentage of unemployment, with 42.7% or 35 of them being unemployed.
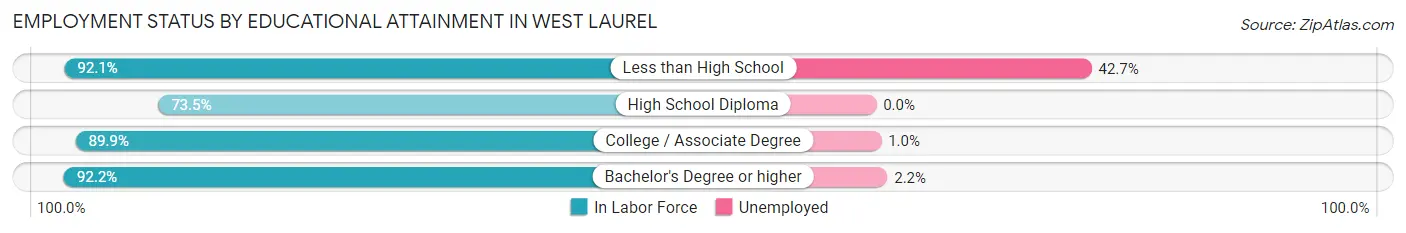
| Educational Attainment | In Labor Force | Unemployed |
| Less than High School | 82 (92.1%) | 38 (42.7%) |
| High School Diploma | 353 (73.5%) | 0 (0.0%) |
| College / Associate Degree | 727 (89.9%) | 8 (1.0%) |
| Bachelor's Degree or higher | 1,047 (92.2%) | 25 (2.2%) |
| Total | 2,210 (87.9%) | 73 (2.9%) |
Employment Occupations by Sex in West Laurel
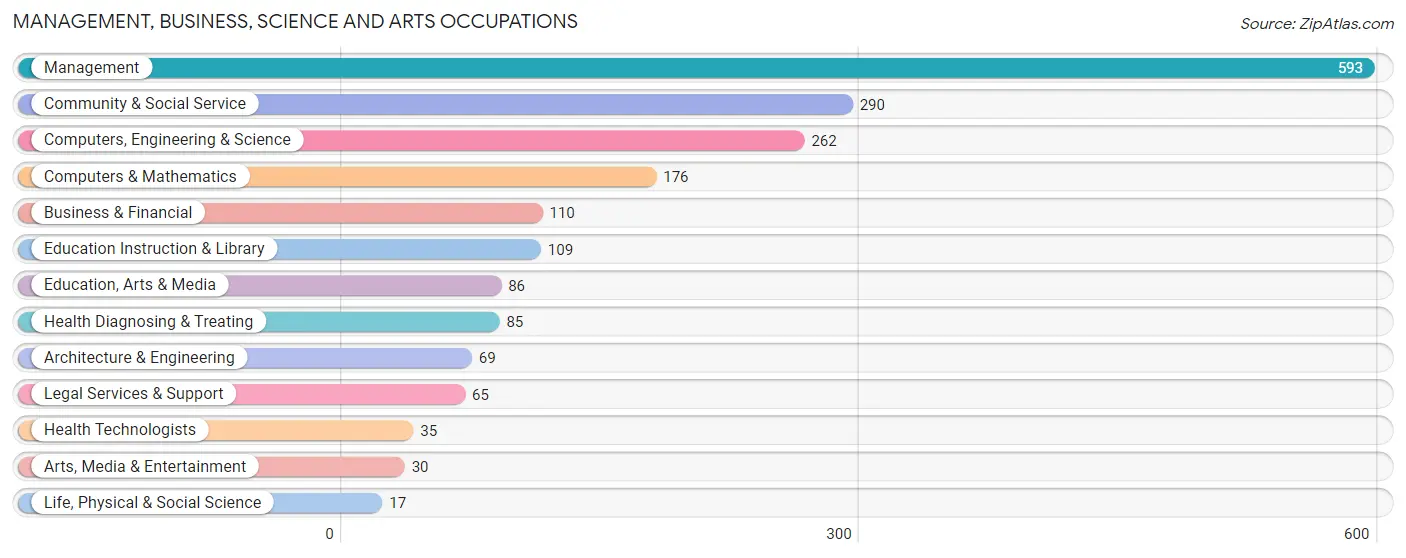
Management, Business, Science and Arts Occupations
The most common Management, Business, Science and Arts occupations in West Laurel are Management (593 | 24.3%), Community & Social Service (290 | 11.9%), Computers, Engineering & Science (262 | 10.7%), Computers & Mathematics (176 | 7.2%), and Business & Financial (110 | 4.5%).
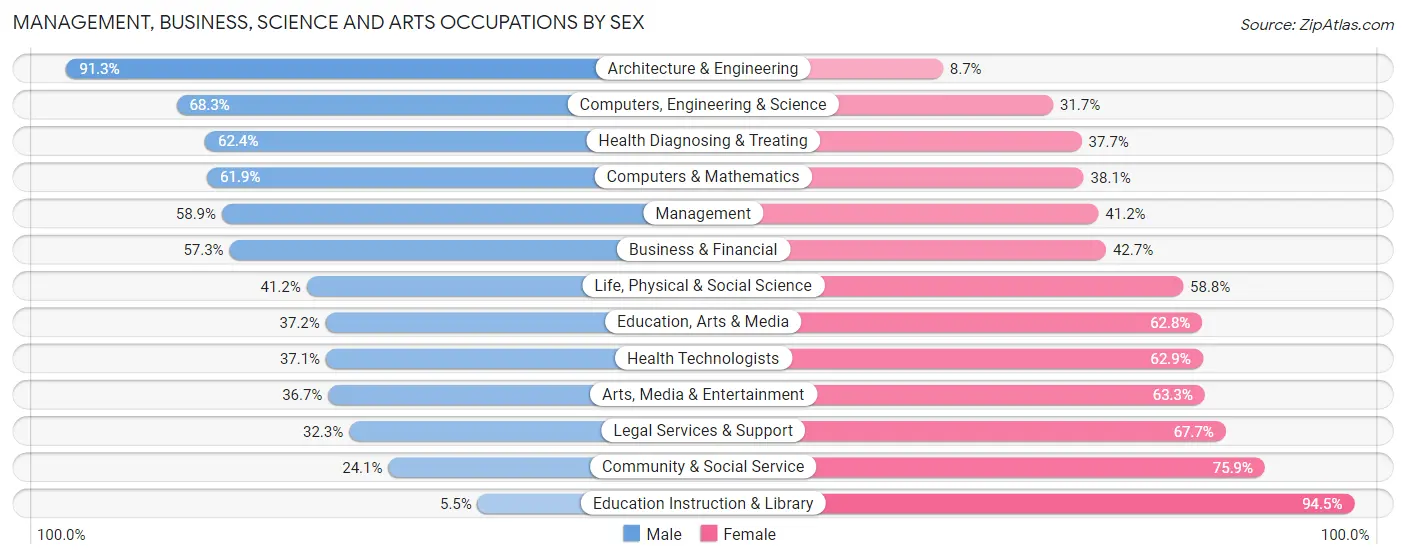
Management, Business, Science and Arts Occupations by Sex
Within the Management, Business, Science and Arts occupations in West Laurel, the most male-oriented occupations are Architecture & Engineering (91.3%), Computers, Engineering & Science (68.3%), and Health Diagnosing & Treating (62.4%), while the most female-oriented occupations are Education Instruction & Library (94.5%), Community & Social Service (75.9%), and Legal Services & Support (67.7%).
| Occupation | Male | Female |
| Management | 349 (58.9%) | 244 (41.1%) |
| Business & Financial | 63 (57.3%) | 47 (42.7%) |
| Computers, Engineering & Science | 179 (68.3%) | 83 (31.7%) |
| Computers & Mathematics | 109 (61.9%) | 67 (38.1%) |
| Architecture & Engineering | 63 (91.3%) | 6 (8.7%) |
| Life, Physical & Social Science | 7 (41.2%) | 10 (58.8%) |
| Community & Social Service | 70 (24.1%) | 220 (75.9%) |
| Education, Arts & Media | 32 (37.2%) | 54 (62.8%) |
| Legal Services & Support | 21 (32.3%) | 44 (67.7%) |
| Education Instruction & Library | 6 (5.5%) | 103 (94.5%) |
| Arts, Media & Entertainment | 11 (36.7%) | 19 (63.3%) |
| Health Diagnosing & Treating | 53 (62.4%) | 32 (37.7%) |
| Health Technologists | 13 (37.1%) | 22 (62.9%) |
| Total (Category) | 714 (53.3%) | 626 (46.7%) |
| Total (Overall) | 1,316 (54.0%) | 1,123 (46.0%) |
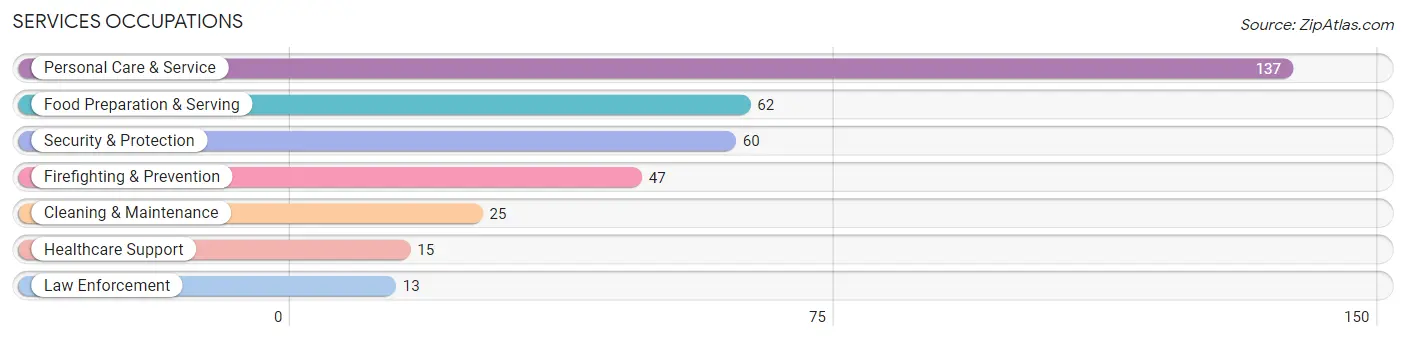
Services Occupations
The most common Services occupations in West Laurel are Personal Care & Service (137 | 5.6%), Food Preparation & Serving (62 | 2.5%), Security & Protection (60 | 2.5%), Firefighting & Prevention (47 | 1.9%), and Cleaning & Maintenance (25 | 1.0%).
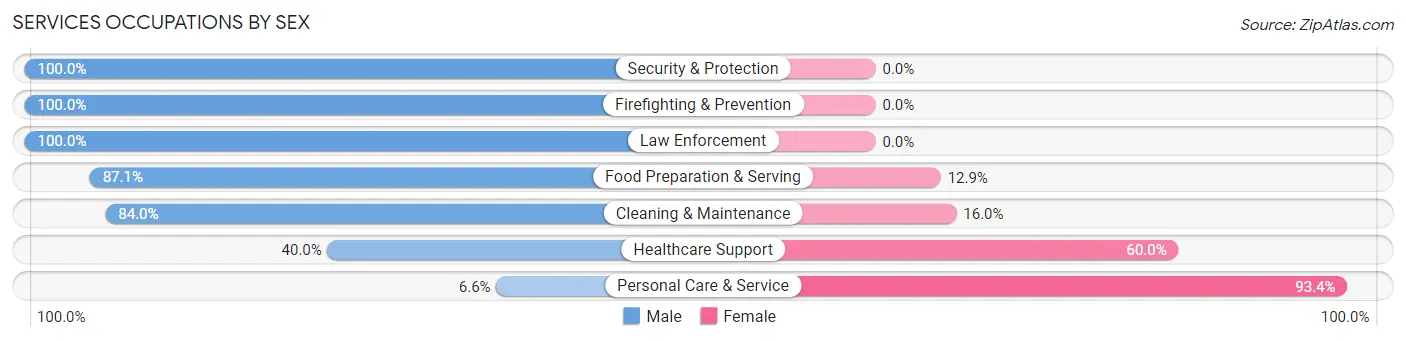
Services Occupations by Sex
Within the Services occupations in West Laurel, the most male-oriented occupations are Security & Protection (100.0%), Firefighting & Prevention (100.0%), and Law Enforcement (100.0%), while the most female-oriented occupations are Personal Care & Service (93.4%), Healthcare Support (60.0%), and Cleaning & Maintenance (16.0%).
| Occupation | Male | Female |
| Healthcare Support | 6 (40.0%) | 9 (60.0%) |
| Security & Protection | 60 (100.0%) | 0 (0.0%) |
| Firefighting & Prevention | 47 (100.0%) | 0 (0.0%) |
| Law Enforcement | 13 (100.0%) | 0 (0.0%) |
| Food Preparation & Serving | 54 (87.1%) | 8 (12.9%) |
| Cleaning & Maintenance | 21 (84.0%) | 4 (16.0%) |
| Personal Care & Service | 9 (6.6%) | 128 (93.4%) |
| Total (Category) | 150 (50.2%) | 149 (49.8%) |
| Total (Overall) | 1,316 (54.0%) | 1,123 (46.0%) |
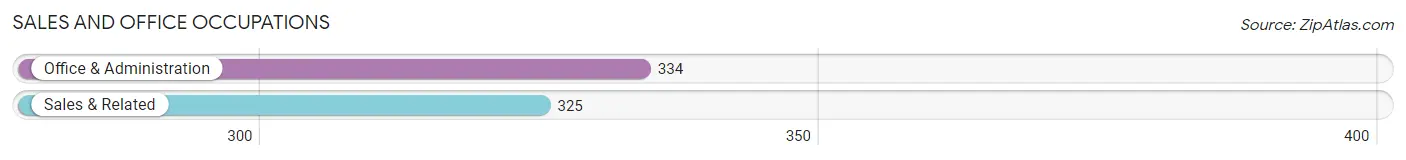
Sales and Office Occupations
The most common Sales and Office occupations in West Laurel are Office & Administration (334 | 13.7%), and Sales & Related (325 | 13.3%).
Sales and Office Occupations by Sex
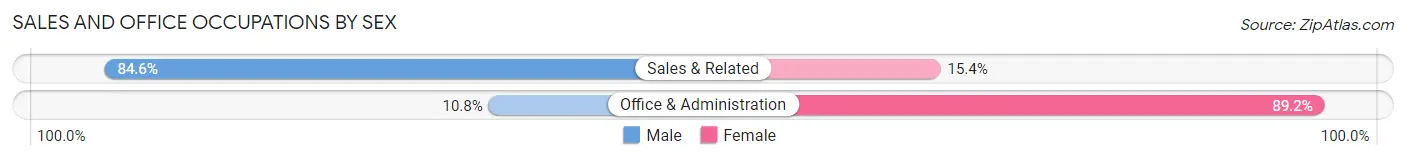
| Occupation | Male | Female |
| Sales & Related | 275 (84.6%) | 50 (15.4%) |
| Office & Administration | 36 (10.8%) | 298 (89.2%) |
| Total (Category) | 311 (47.2%) | 348 (52.8%) |
| Total (Overall) | 1,316 (54.0%) | 1,123 (46.0%) |
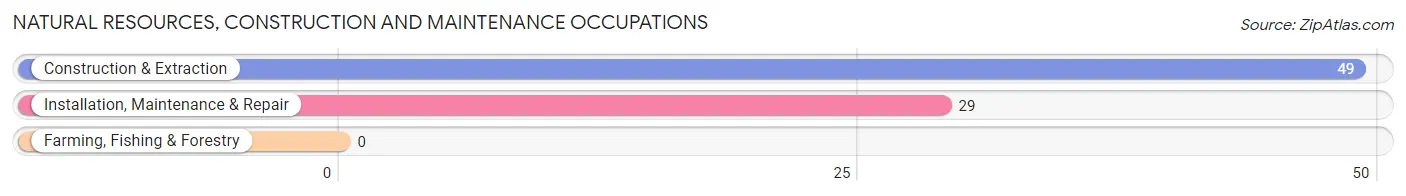
Natural Resources, Construction and Maintenance Occupations
The most common Natural Resources, Construction and Maintenance occupations in West Laurel are Construction & Extraction (49 | 2.0%), and Installation, Maintenance & Repair (29 | 1.2%).
Natural Resources, Construction and Maintenance Occupations by Sex
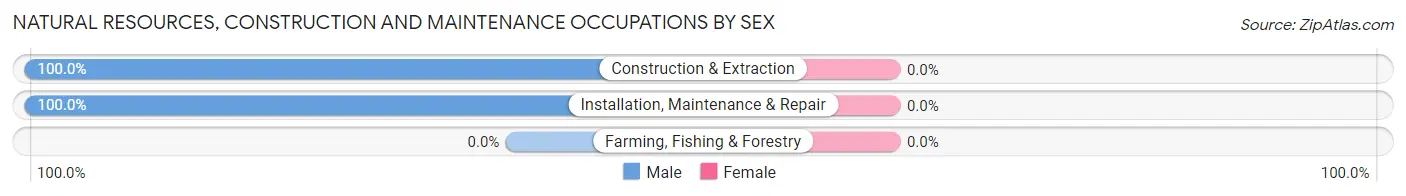
| Occupation | Male | Female |
| Farming, Fishing & Forestry | 0 (0.0%) | 0 (0.0%) |
| Construction & Extraction | 49 (100.0%) | 0 (0.0%) |
| Installation, Maintenance & Repair | 29 (100.0%) | 0 (0.0%) |
| Total (Category) | 78 (100.0%) | 0 (0.0%) |
| Total (Overall) | 1,316 (54.0%) | 1,123 (46.0%) |
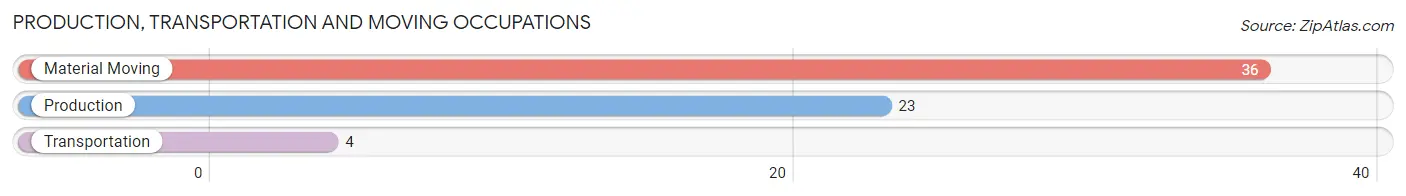
Production, Transportation and Moving Occupations
The most common Production, Transportation and Moving occupations in West Laurel are Material Moving (36 | 1.5%), Production (23 | 0.9%), and Transportation (4 | 0.2%).
Production, Transportation and Moving Occupations by Sex
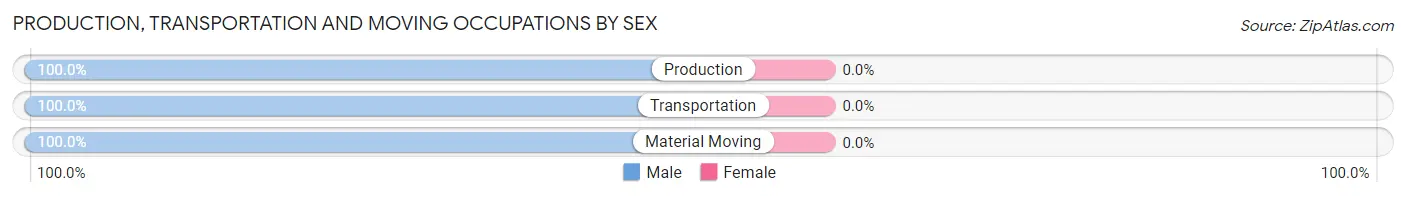
| Occupation | Male | Female |
| Production | 23 (100.0%) | 0 (0.0%) |
| Transportation | 4 (100.0%) | 0 (0.0%) |
| Material Moving | 36 (100.0%) | 0 (0.0%) |
| Total (Category) | 63 (100.0%) | 0 (0.0%) |
| Total (Overall) | 1,316 (54.0%) | 1,123 (46.0%) |
Employment Industries by Sex in West Laurel
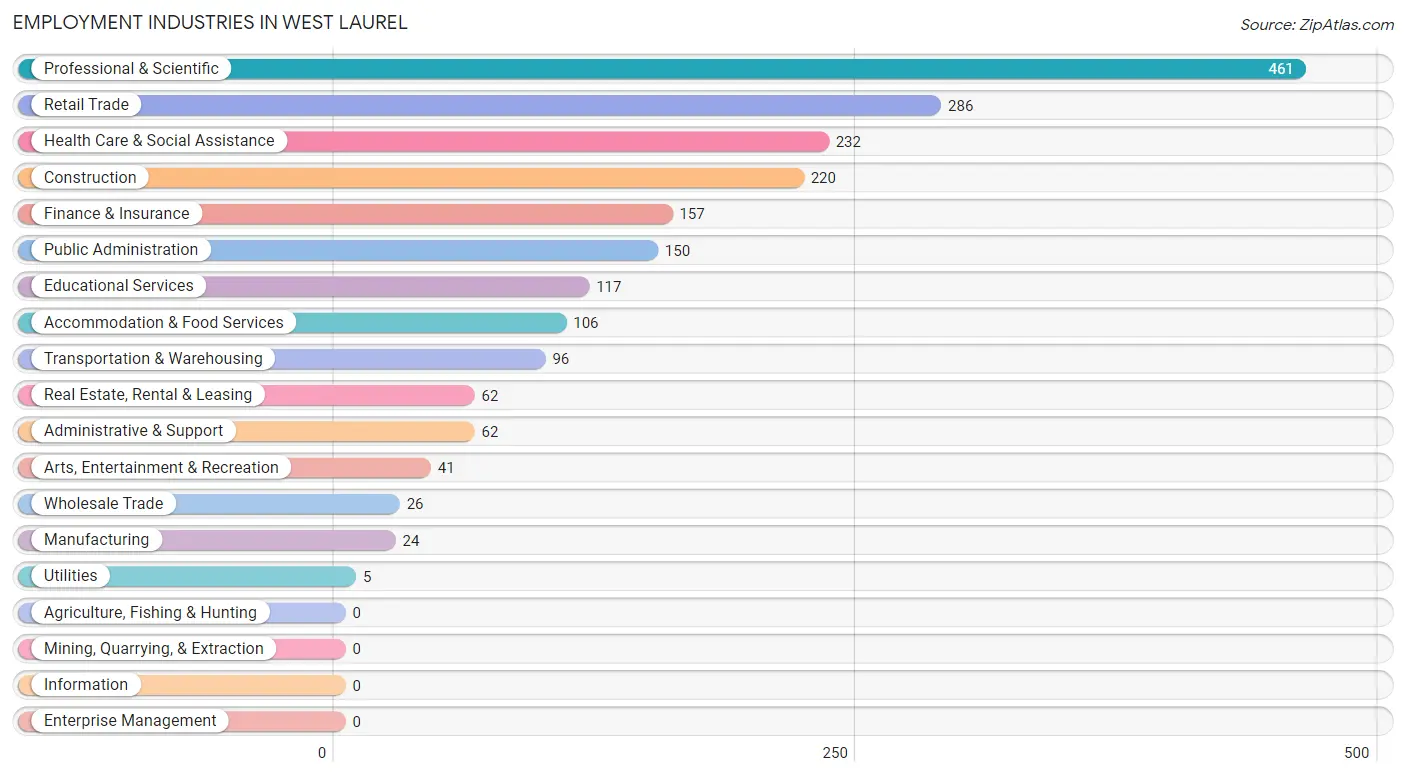
Employment Industries in West Laurel
The major employment industries in West Laurel include Professional & Scientific (461 | 18.9%), Retail Trade (286 | 11.7%), Health Care & Social Assistance (232 | 9.5%), Construction (220 | 9.0%), and Finance & Insurance (157 | 6.4%).
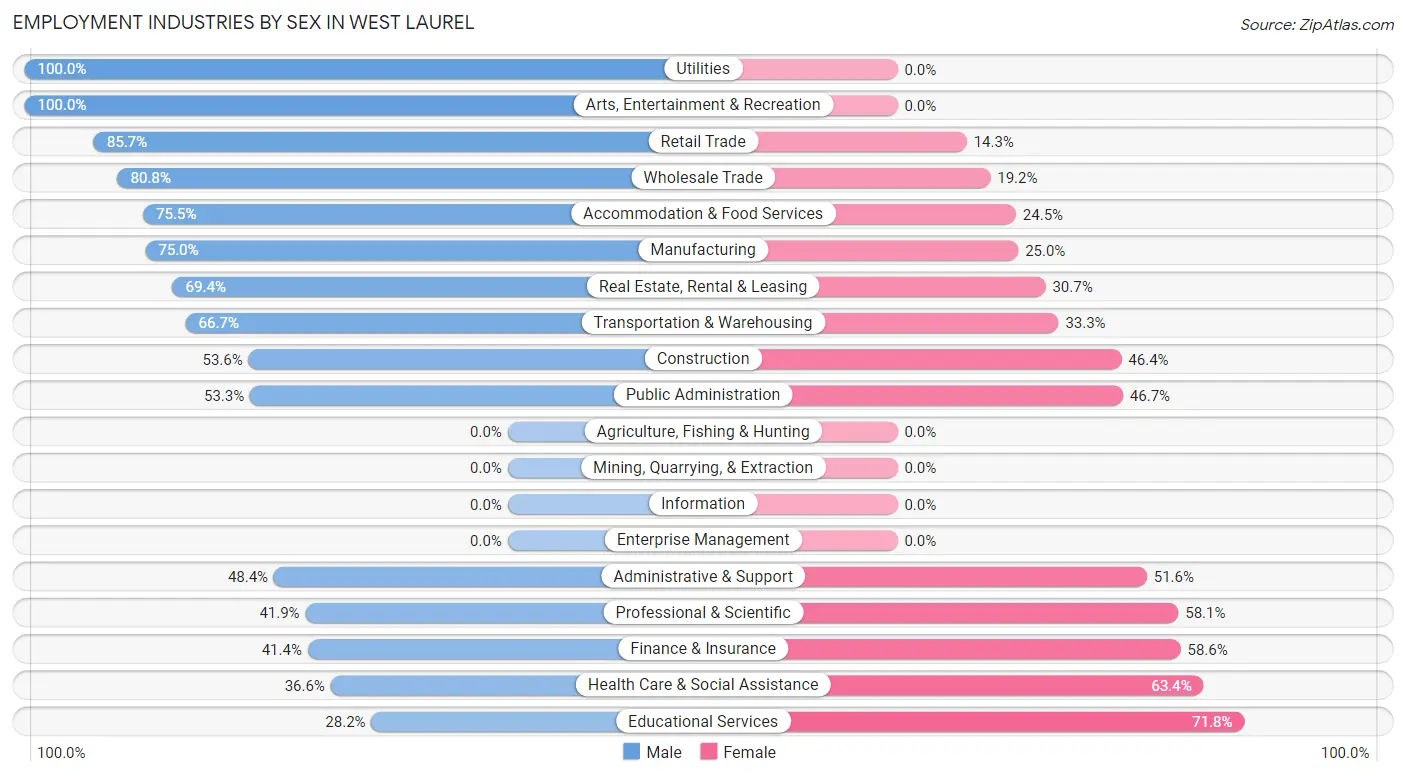
Employment Industries by Sex in West Laurel
The West Laurel industries that see more men than women are Utilities (100.0%), Arts, Entertainment & Recreation (100.0%), and Retail Trade (85.7%), whereas the industries that tend to have a higher number of women are Educational Services (71.8%), Health Care & Social Assistance (63.4%), and Finance & Insurance (58.6%).
| Industry | Male | Female |
| Agriculture, Fishing & Hunting | 0 (0.0%) | 0 (0.0%) |
| Mining, Quarrying, & Extraction | 0 (0.0%) | 0 (0.0%) |
| Construction | 118 (53.6%) | 102 (46.4%) |
| Manufacturing | 18 (75.0%) | 6 (25.0%) |
| Wholesale Trade | 21 (80.8%) | 5 (19.2%) |
| Retail Trade | 245 (85.7%) | 41 (14.3%) |
| Transportation & Warehousing | 64 (66.7%) | 32 (33.3%) |
| Utilities | 5 (100.0%) | 0 (0.0%) |
| Information | 0 (0.0%) | 0 (0.0%) |
| Finance & Insurance | 65 (41.4%) | 92 (58.6%) |
| Real Estate, Rental & Leasing | 43 (69.4%) | 19 (30.6%) |
| Professional & Scientific | 193 (41.9%) | 268 (58.1%) |
| Enterprise Management | 0 (0.0%) | 0 (0.0%) |
| Administrative & Support | 30 (48.4%) | 32 (51.6%) |
| Educational Services | 33 (28.2%) | 84 (71.8%) |
| Health Care & Social Assistance | 85 (36.6%) | 147 (63.4%) |
| Arts, Entertainment & Recreation | 41 (100.0%) | 0 (0.0%) |
| Accommodation & Food Services | 80 (75.5%) | 26 (24.5%) |
| Public Administration | 80 (53.3%) | 70 (46.7%) |
| Total | 1,316 (54.0%) | 1,123 (46.0%) |
Education in West Laurel
School Enrollment in West Laurel
The most common levels of schooling among the 1,015 students in West Laurel are elementary school (271 | 26.7%), nursery / preschool (222 | 21.9%), and high school (205 | 20.2%).
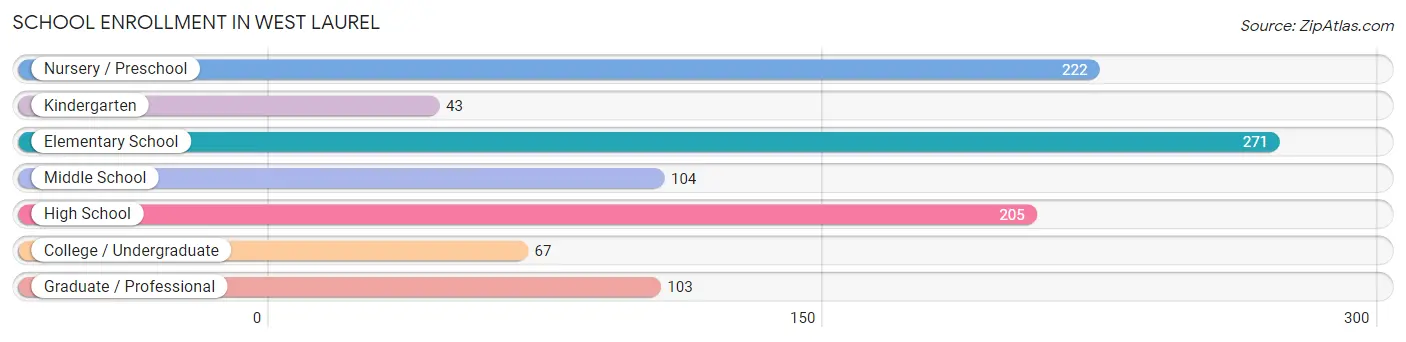
| School Level | # Students | % Students |
| Nursery / Preschool | 222 | 21.9% |
| Kindergarten | 43 | 4.2% |
| Elementary School | 271 | 26.7% |
| Middle School | 104 | 10.2% |
| High School | 205 | 20.2% |
| College / Undergraduate | 67 | 6.6% |
| Graduate / Professional | 103 | 10.2% |
| Total | 1,015 | 100.0% |
School Enrollment by Age by Funding Source in West Laurel
Out of a total of 1,015 students who are enrolled in schools in West Laurel, 349 (34.4%) attend a private institution, while the remaining 666 (65.6%) are enrolled in public schools. The age group of 3 to 4 year olds has the highest likelihood of being enrolled in private schools, with 168 (95.5% in the age bracket) enrolled. Conversely, the age group of 18 to 19 year olds has the lowest likelihood of being enrolled in a private school, with 27 (100.0% in the age bracket) attending a public institution.
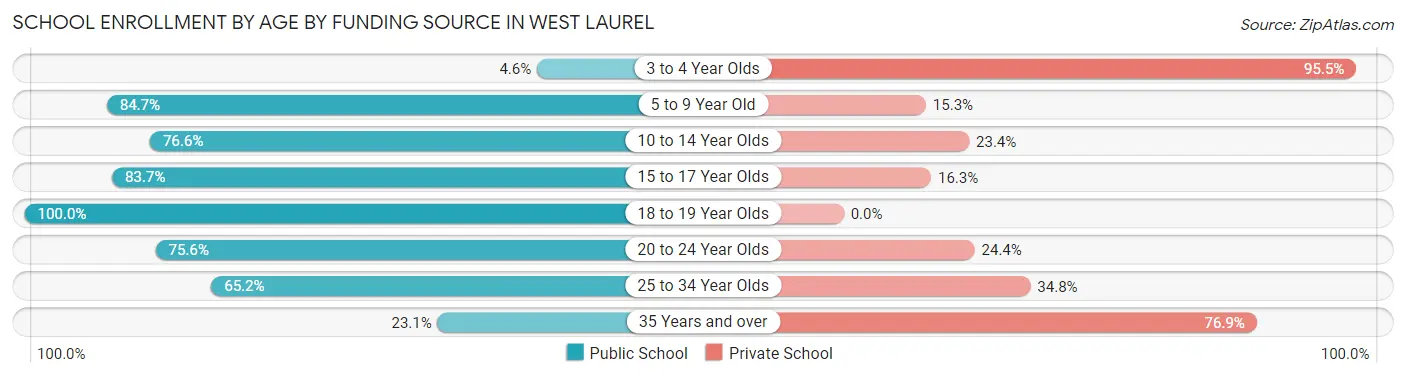
| Age Bracket | Public School | Private School |
| 3 to 4 Year Olds | 8 (4.5%) | 168 (95.5%) |
| 5 to 9 Year Old | 293 (84.7%) | 53 (15.3%) |
| 10 to 14 Year Olds | 105 (76.6%) | 32 (23.4%) |
| 15 to 17 Year Olds | 144 (83.7%) | 28 (16.3%) |
| 18 to 19 Year Olds | 27 (100.0%) | 0 (0.0%) |
| 20 to 24 Year Olds | 62 (75.6%) | 20 (24.4%) |
| 25 to 34 Year Olds | 15 (65.2%) | 8 (34.8%) |
| 35 Years and over | 12 (23.1%) | 40 (76.9%) |
| Total | 666 (65.6%) | 349 (34.4%) |
Educational Attainment by Field of Study in West Laurel
Business (248 | 15.9%), psychology (226 | 14.5%), social sciences (200 | 12.9%), education (120 | 7.7%), and computers & mathematics (115 | 7.4%) are the most common fields of study among 1,556 individuals in West Laurel who have obtained a bachelor's degree or higher.
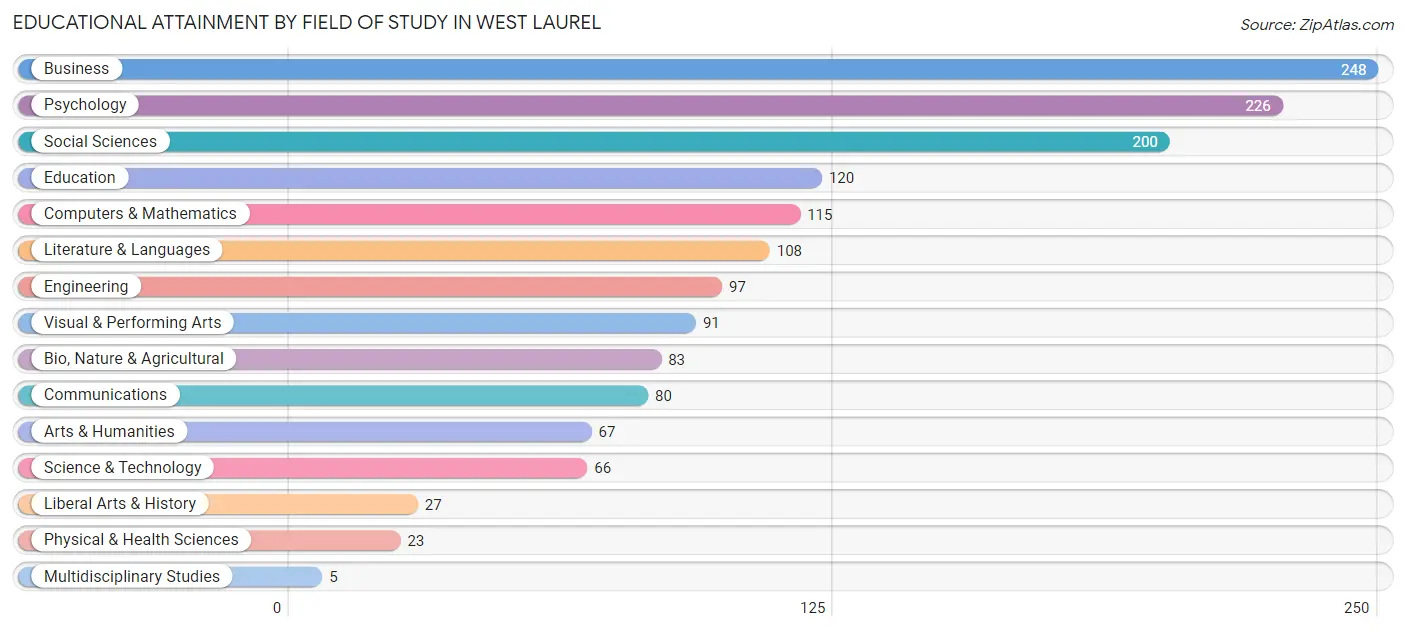
| Field of Study | # Graduates | % Graduates |
| Computers & Mathematics | 115 | 7.4% |
| Bio, Nature & Agricultural | 83 | 5.3% |
| Physical & Health Sciences | 23 | 1.5% |
| Psychology | 226 | 14.5% |
| Social Sciences | 200 | 12.9% |
| Engineering | 97 | 6.2% |
| Multidisciplinary Studies | 5 | 0.3% |
| Science & Technology | 66 | 4.2% |
| Business | 248 | 15.9% |
| Education | 120 | 7.7% |
| Literature & Languages | 108 | 6.9% |
| Liberal Arts & History | 27 | 1.7% |
| Visual & Performing Arts | 91 | 5.9% |
| Communications | 80 | 5.1% |
| Arts & Humanities | 67 | 4.3% |
| Total | 1,556 | 100.0% |
Transportation & Commute in West Laurel
Vehicle Availability by Sex in West Laurel
The most prevalent vehicle ownership categories in West Laurel are males with 2 vehicles (524, accounting for 40.8%) and females with 2 vehicles (344, making up 52.0%).
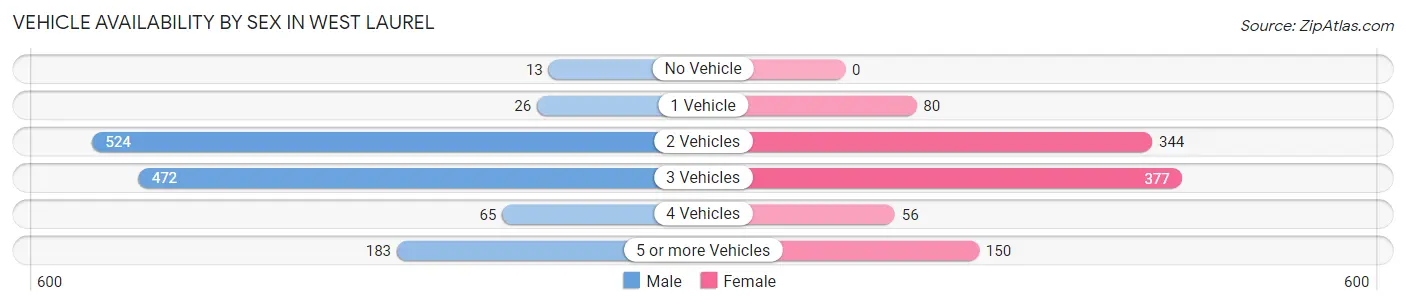
| Vehicles Available | Male | Female |
| No Vehicle | 13 (1.0%) | 0 (0.0%) |
| 1 Vehicle | 26 (2.0%) | 80 (7.9%) |
| 2 Vehicles | 524 (40.8%) | 344 (34.2%) |
| 3 Vehicles | 472 (36.8%) | 377 (37.4%) |
| 4 Vehicles | 65 (5.1%) | 56 (5.6%) |
| 5 or more Vehicles | 183 (14.3%) | 150 (14.9%) |
| Total | 1,283 (100.0%) | 1,007 (100.0%) |
Commute Time in West Laurel
The most frequently occuring commute durations in West Laurel are 30 to 34 minutes (458 commuters, 22.8%), 15 to 19 minutes (316 commuters, 15.7%), and 20 to 24 minutes (267 commuters, 13.3%).
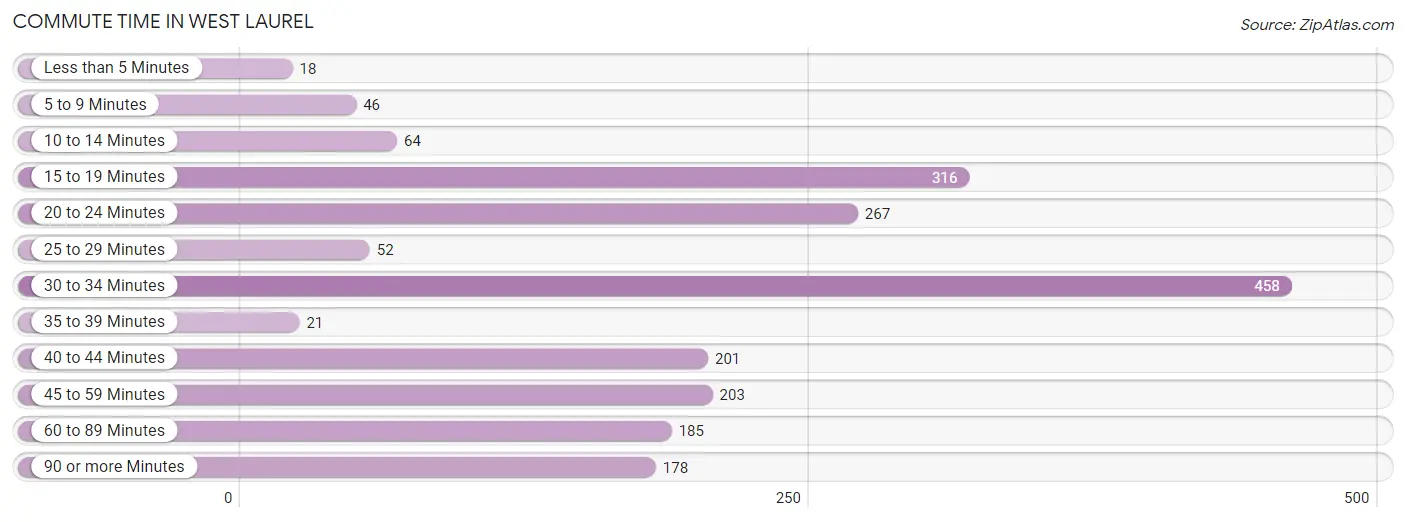
| Commute Time | # Commuters | % Commuters |
| Less than 5 Minutes | 18 | 0.9% |
| 5 to 9 Minutes | 46 | 2.3% |
| 10 to 14 Minutes | 64 | 3.2% |
| 15 to 19 Minutes | 316 | 15.7% |
| 20 to 24 Minutes | 267 | 13.3% |
| 25 to 29 Minutes | 52 | 2.6% |
| 30 to 34 Minutes | 458 | 22.8% |
| 35 to 39 Minutes | 21 | 1.1% |
| 40 to 44 Minutes | 201 | 10.0% |
| 45 to 59 Minutes | 203 | 10.1% |
| 60 to 89 Minutes | 185 | 9.2% |
| 90 or more Minutes | 178 | 8.9% |
Commute Time by Sex in West Laurel
The most common commute times in West Laurel are 30 to 34 minutes (377 commuters, 31.3%) for males and 15 to 19 minutes (158 commuters, 19.7%) for females.
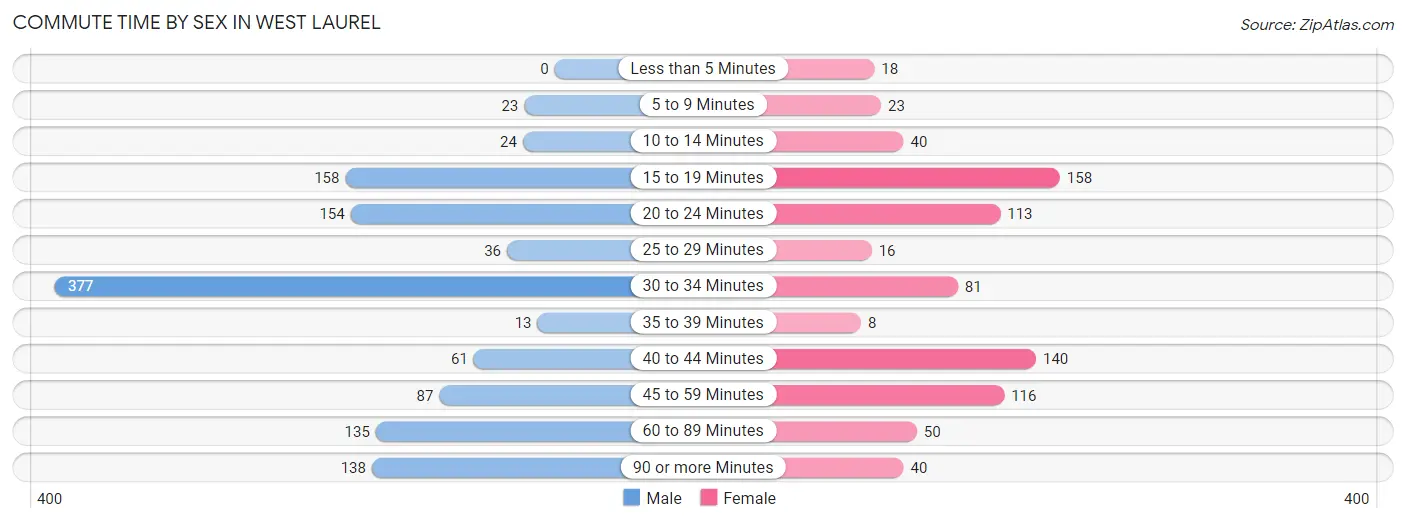
| Commute Time | Male | Female |
| Less than 5 Minutes | 0 (0.0%) | 18 (2.2%) |
| 5 to 9 Minutes | 23 (1.9%) | 23 (2.9%) |
| 10 to 14 Minutes | 24 (2.0%) | 40 (5.0%) |
| 15 to 19 Minutes | 158 (13.1%) | 158 (19.7%) |
| 20 to 24 Minutes | 154 (12.8%) | 113 (14.1%) |
| 25 to 29 Minutes | 36 (3.0%) | 16 (2.0%) |
| 30 to 34 Minutes | 377 (31.3%) | 81 (10.1%) |
| 35 to 39 Minutes | 13 (1.1%) | 8 (1.0%) |
| 40 to 44 Minutes | 61 (5.1%) | 140 (17.4%) |
| 45 to 59 Minutes | 87 (7.2%) | 116 (14.4%) |
| 60 to 89 Minutes | 135 (11.2%) | 50 (6.2%) |
| 90 or more Minutes | 138 (11.4%) | 40 (5.0%) |
Time of Departure to Work by Sex in West Laurel
The most frequent times of departure to work in West Laurel are 8:00 AM to 8:29 AM (208, 17.2%) for males and 7:00 AM to 7:29 AM (192, 23.9%) for females.
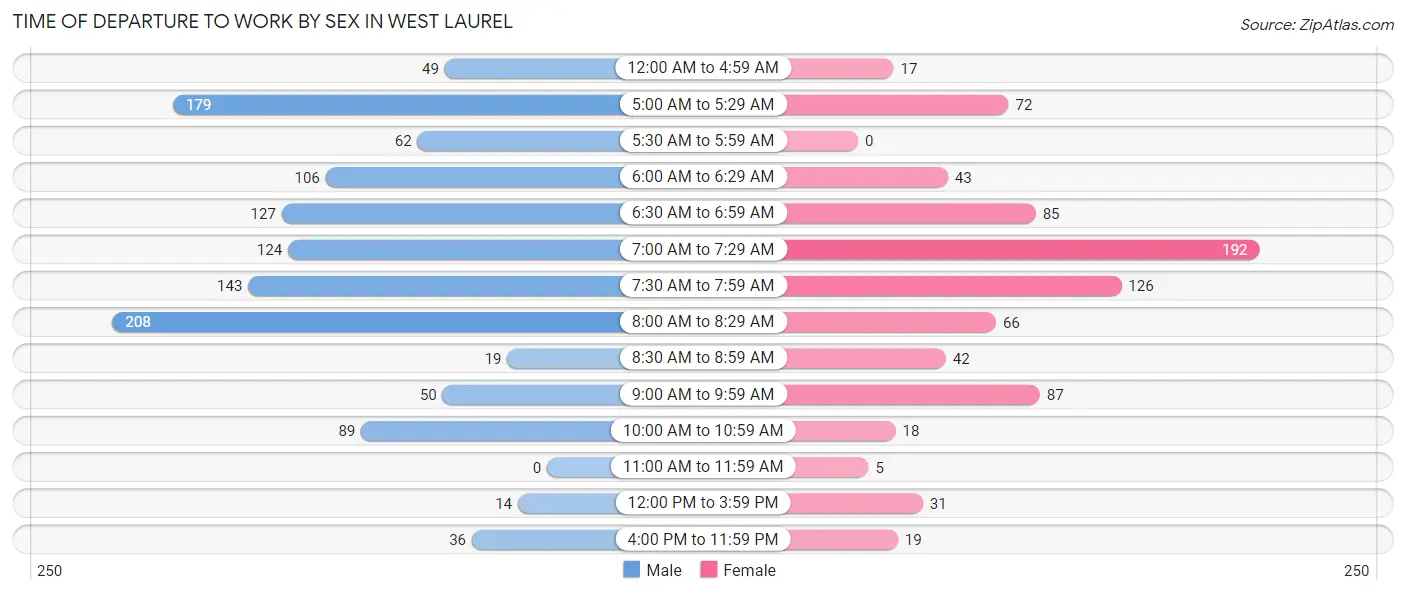
| Time of Departure | Male | Female |
| 12:00 AM to 4:59 AM | 49 (4.1%) | 17 (2.1%) |
| 5:00 AM to 5:29 AM | 179 (14.8%) | 72 (9.0%) |
| 5:30 AM to 5:59 AM | 62 (5.1%) | 0 (0.0%) |
| 6:00 AM to 6:29 AM | 106 (8.8%) | 43 (5.3%) |
| 6:30 AM to 6:59 AM | 127 (10.5%) | 85 (10.6%) |
| 7:00 AM to 7:29 AM | 124 (10.3%) | 192 (23.9%) |
| 7:30 AM to 7:59 AM | 143 (11.9%) | 126 (15.7%) |
| 8:00 AM to 8:29 AM | 208 (17.2%) | 66 (8.2%) |
| 8:30 AM to 8:59 AM | 19 (1.6%) | 42 (5.2%) |
| 9:00 AM to 9:59 AM | 50 (4.2%) | 87 (10.8%) |
| 10:00 AM to 10:59 AM | 89 (7.4%) | 18 (2.2%) |
| 11:00 AM to 11:59 AM | 0 (0.0%) | 5 (0.6%) |
| 12:00 PM to 3:59 PM | 14 (1.2%) | 31 (3.9%) |
| 4:00 PM to 11:59 PM | 36 (3.0%) | 19 (2.4%) |
| Total | 1,206 (100.0%) | 803 (100.0%) |
Housing Occupancy in West Laurel
Occupancy by Ownership in West Laurel
Of the total 1,513 dwellings in West Laurel, owner-occupied units account for 1,474 (97.4%), while renter-occupied units make up 39 (2.6%).
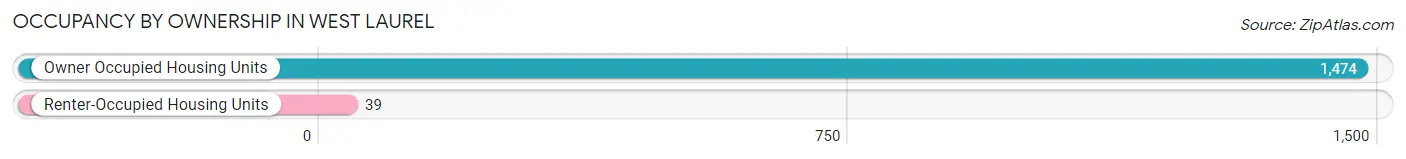
| Occupancy | # Housing Units | % Housing Units |
| Owner Occupied Housing Units | 1,474 | 97.4% |
| Renter-Occupied Housing Units | 39 | 2.6% |
| Total Occupied Housing Units | 1,513 | 100.0% |
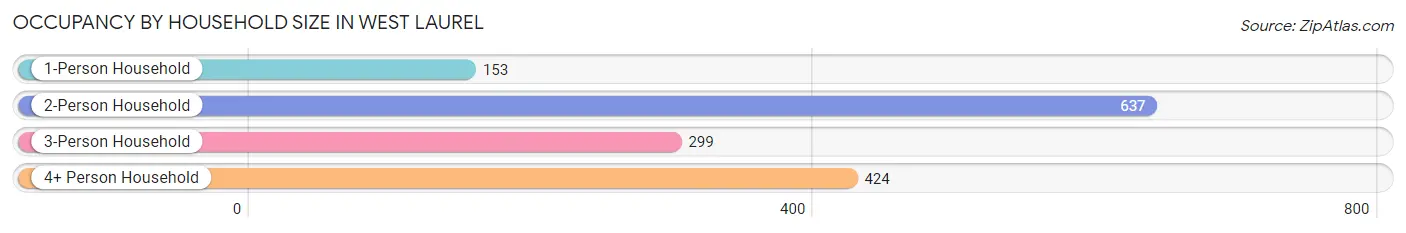
Occupancy by Household Size in West Laurel
| Household Size | # Housing Units | % Housing Units |
| 1-Person Household | 153 | 10.1% |
| 2-Person Household | 637 | 42.1% |
| 3-Person Household | 299 | 19.8% |
| 4+ Person Household | 424 | 28.0% |
| Total Housing Units | 1,513 | 100.0% |
Occupancy by Ownership by Household Size in West Laurel
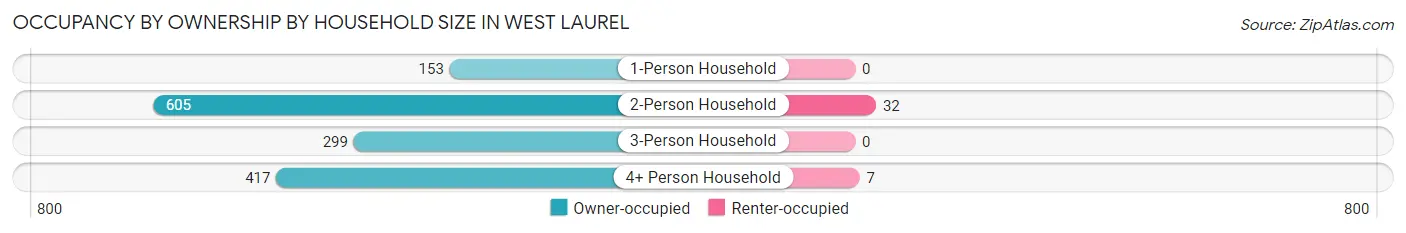
| Household Size | Owner-occupied | Renter-occupied |
| 1-Person Household | 153 (100.0%) | 0 (0.0%) |
| 2-Person Household | 605 (95.0%) | 32 (5.0%) |
| 3-Person Household | 299 (100.0%) | 0 (0.0%) |
| 4+ Person Household | 417 (98.4%) | 7 (1.7%) |
| Total Housing Units | 1,474 (97.4%) | 39 (2.6%) |
Occupancy by Educational Attainment in West Laurel
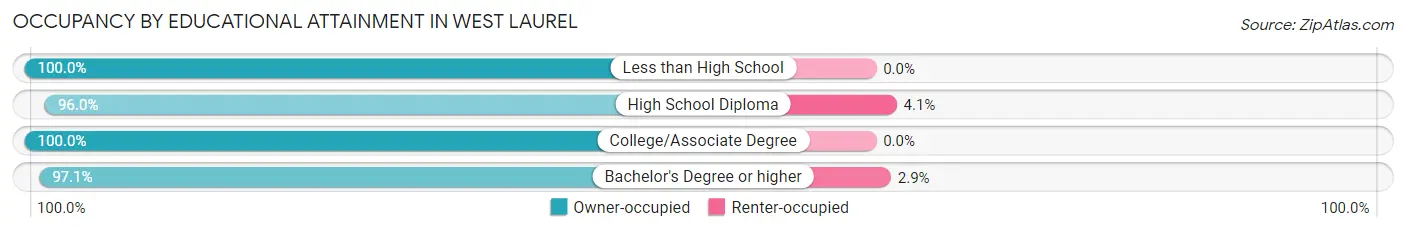
| Household Size | Owner-occupied | Renter-occupied |
| Less than High School | 46 (100.0%) | 0 (0.0%) |
| High School Diploma | 355 (96.0%) | 15 (4.1%) |
| College/Associate Degree | 271 (100.0%) | 0 (0.0%) |
| Bachelor's Degree or higher | 802 (97.1%) | 24 (2.9%) |
Occupancy by Age of Householder in West Laurel
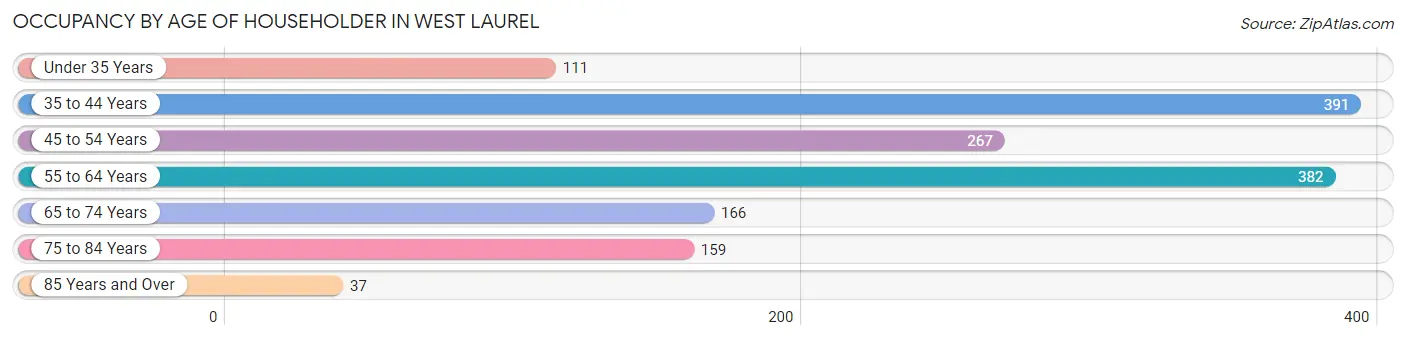
| Age Bracket | # Households | % Households |
| Under 35 Years | 111 | 7.3% |
| 35 to 44 Years | 391 | 25.8% |
| 45 to 54 Years | 267 | 17.6% |
| 55 to 64 Years | 382 | 25.3% |
| 65 to 74 Years | 166 | 11.0% |
| 75 to 84 Years | 159 | 10.5% |
| 85 Years and Over | 37 | 2.5% |
| Total | 1,513 | 100.0% |
Housing Finances in West Laurel
Median Income by Occupancy in West Laurel
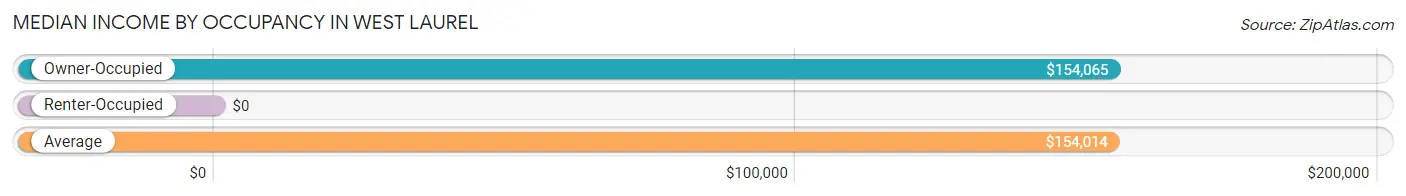
| Occupancy Type | # Households | Median Income |
| Owner-Occupied | 1,474 (97.4%) | $154,065 |
| Renter-Occupied | 39 (2.6%) | $0 |
| Average | 1,513 (100.0%) | $154,014 |
Occupancy by Householder Income Bracket in West Laurel
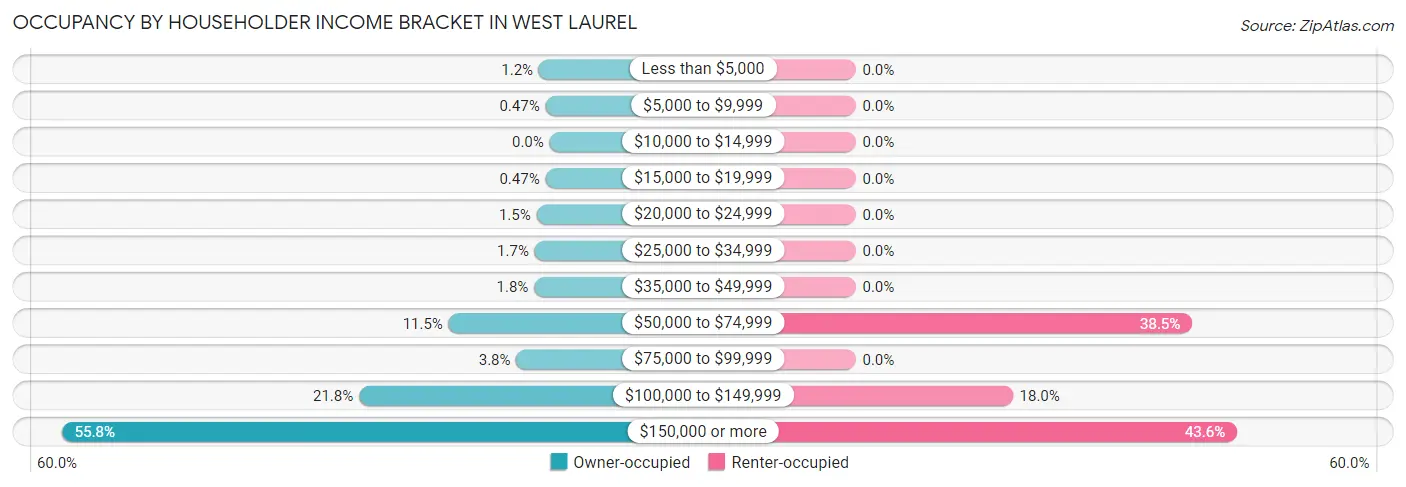
| Income Bracket | Owner-occupied | Renter-occupied |
| Less than $5,000 | 18 (1.2%) | 0 (0.0%) |
| $5,000 to $9,999 | 7 (0.5%) | 0 (0.0%) |
| $10,000 to $14,999 | 0 (0.0%) | 0 (0.0%) |
| $15,000 to $19,999 | 7 (0.5%) | 0 (0.0%) |
| $20,000 to $24,999 | 22 (1.5%) | 0 (0.0%) |
| $25,000 to $34,999 | 25 (1.7%) | 0 (0.0%) |
| $35,000 to $49,999 | 26 (1.8%) | 0 (0.0%) |
| $50,000 to $74,999 | 170 (11.5%) | 15 (38.5%) |
| $75,000 to $99,999 | 56 (3.8%) | 0 (0.0%) |
| $100,000 to $149,999 | 321 (21.8%) | 7 (17.9%) |
| $150,000 or more | 822 (55.8%) | 17 (43.6%) |
| Total | 1,474 (100.0%) | 39 (100.0%) |
Monthly Housing Cost Tiers in West Laurel
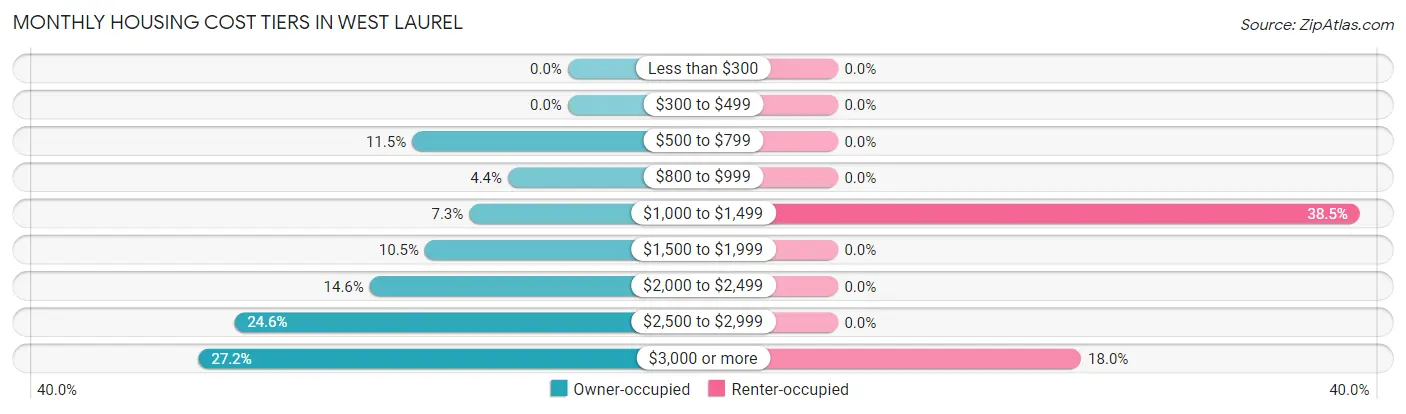
| Monthly Cost | Owner-occupied | Renter-occupied |
| Less than $300 | 0 (0.0%) | 0 (0.0%) |
| $300 to $499 | 0 (0.0%) | 0 (0.0%) |
| $500 to $799 | 169 (11.5%) | 0 (0.0%) |
| $800 to $999 | 65 (4.4%) | 0 (0.0%) |
| $1,000 to $1,499 | 107 (7.3%) | 15 (38.5%) |
| $1,500 to $1,999 | 155 (10.5%) | 0 (0.0%) |
| $2,000 to $2,499 | 215 (14.6%) | 0 (0.0%) |
| $2,500 to $2,999 | 362 (24.6%) | 0 (0.0%) |
| $3,000 or more | 401 (27.2%) | 7 (17.9%) |
| Total | 1,474 (100.0%) | 39 (100.0%) |
Physical Housing Characteristics in West Laurel
Housing Structures in West Laurel
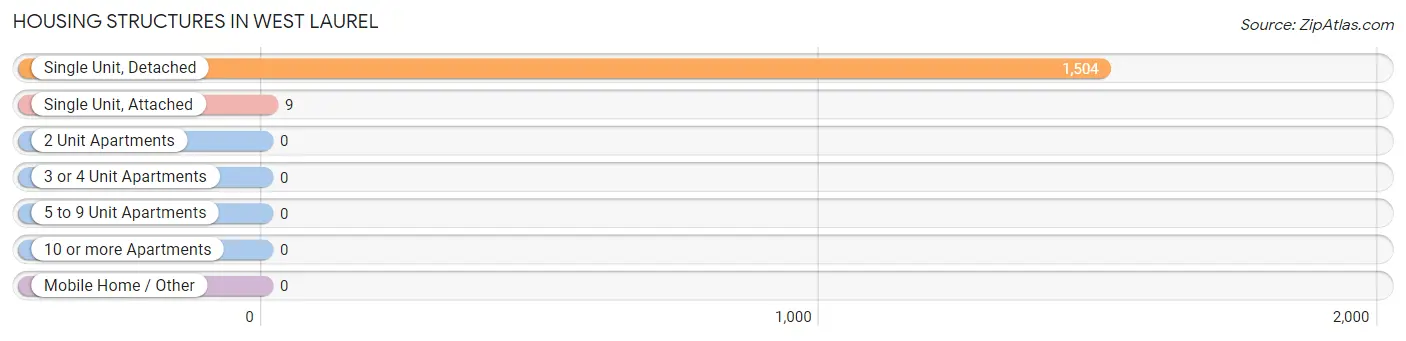
| Structure Type | # Housing Units | % Housing Units |
| Single Unit, Detached | 1,504 | 99.4% |
| Single Unit, Attached | 9 | 0.6% |
| 2 Unit Apartments | 0 | 0.0% |
| 3 or 4 Unit Apartments | 0 | 0.0% |
| 5 to 9 Unit Apartments | 0 | 0.0% |
| 10 or more Apartments | 0 | 0.0% |
| Mobile Home / Other | 0 | 0.0% |
| Total | 1,513 | 100.0% |
Housing Structures by Occupancy in West Laurel
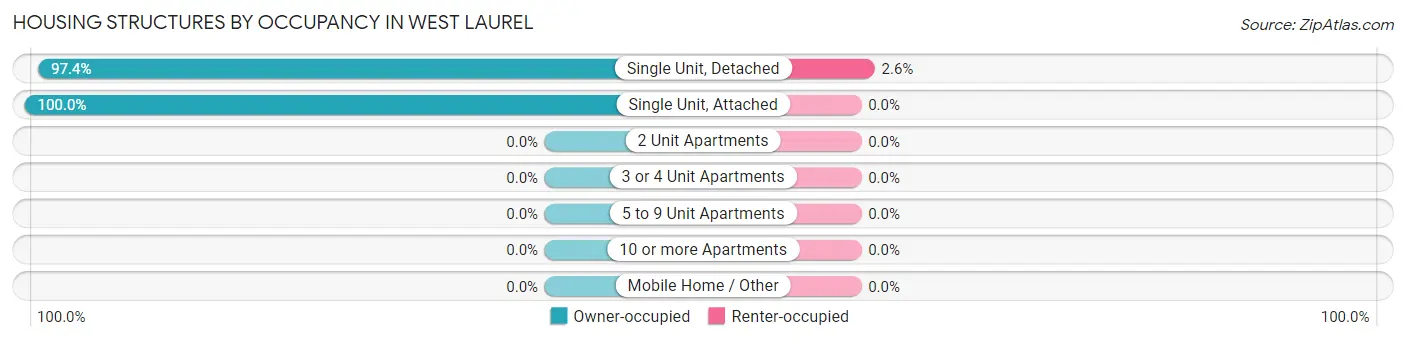
| Structure Type | Owner-occupied | Renter-occupied |
| Single Unit, Detached | 1,465 (97.4%) | 39 (2.6%) |
| Single Unit, Attached | 9 (100.0%) | 0 (0.0%) |
| 2 Unit Apartments | 0 (0.0%) | 0 (0.0%) |
| 3 or 4 Unit Apartments | 0 (0.0%) | 0 (0.0%) |
| 5 to 9 Unit Apartments | 0 (0.0%) | 0 (0.0%) |
| 10 or more Apartments | 0 (0.0%) | 0 (0.0%) |
| Mobile Home / Other | 0 (0.0%) | 0 (0.0%) |
| Total | 1,474 (97.4%) | 39 (2.6%) |
Housing Structures by Number of Rooms in West Laurel
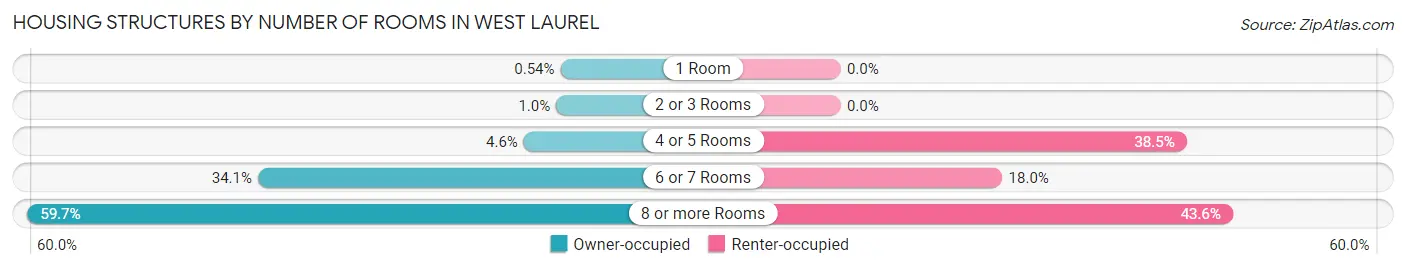
| Number of Rooms | Owner-occupied | Renter-occupied |
| 1 Room | 8 (0.5%) | 0 (0.0%) |
| 2 or 3 Rooms | 15 (1.0%) | 0 (0.0%) |
| 4 or 5 Rooms | 68 (4.6%) | 15 (38.5%) |
| 6 or 7 Rooms | 503 (34.1%) | 7 (17.9%) |
| 8 or more Rooms | 880 (59.7%) | 17 (43.6%) |
| Total | 1,474 (100.0%) | 39 (100.0%) |
Housing Structure by Heating Type in West Laurel
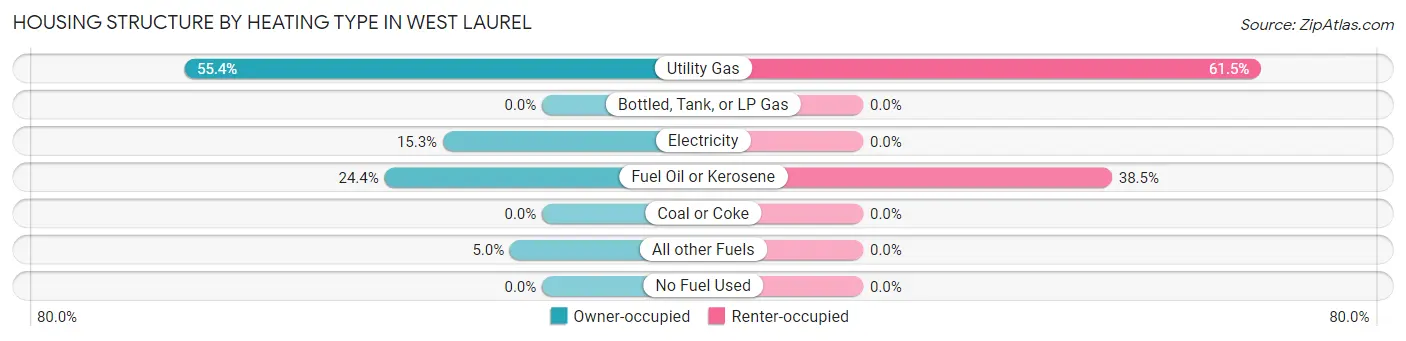
| Heating Type | Owner-occupied | Renter-occupied |
| Utility Gas | 816 (55.4%) | 24 (61.5%) |
| Bottled, Tank, or LP Gas | 0 (0.0%) | 0 (0.0%) |
| Electricity | 226 (15.3%) | 0 (0.0%) |
| Fuel Oil or Kerosene | 359 (24.4%) | 15 (38.5%) |
| Coal or Coke | 0 (0.0%) | 0 (0.0%) |
| All other Fuels | 73 (5.0%) | 0 (0.0%) |
| No Fuel Used | 0 (0.0%) | 0 (0.0%) |
| Total | 1,474 (100.0%) | 39 (100.0%) |
Household Vehicle Usage in West Laurel
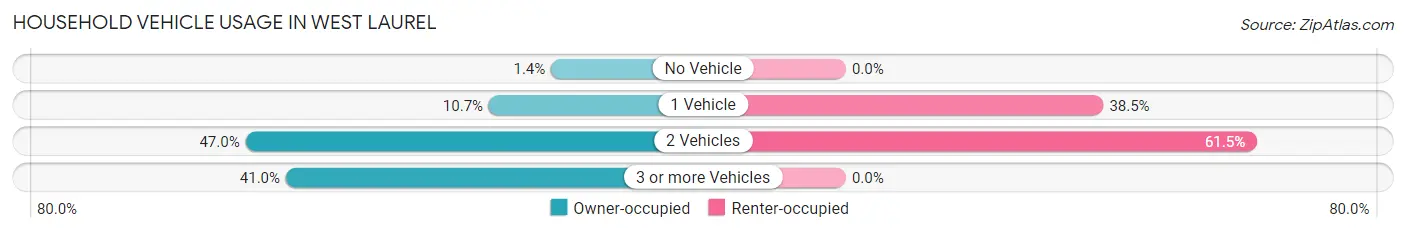
| Vehicles per Household | Owner-occupied | Renter-occupied |
| No Vehicle | 20 (1.4%) | 0 (0.0%) |
| 1 Vehicle | 157 (10.6%) | 15 (38.5%) |
| 2 Vehicles | 693 (47.0%) | 24 (61.5%) |
| 3 or more Vehicles | 604 (41.0%) | 0 (0.0%) |
| Total | 1,474 (100.0%) | 39 (100.0%) |
Real Estate & Mortgages in West Laurel
Real Estate and Mortgage Overview in West Laurel
| Characteristic | Without Mortgage | With Mortgage |
| Housing Units | 295 | 1,179 |
| Median Property Value | $449,200 | $448,200 |
| Median Household Income | $136,635 | $704 |
| Monthly Housing Costs | $777 | $401 |
| Real Estate Taxes | $4,958 | $18 |
Property Value by Mortgage Status in West Laurel
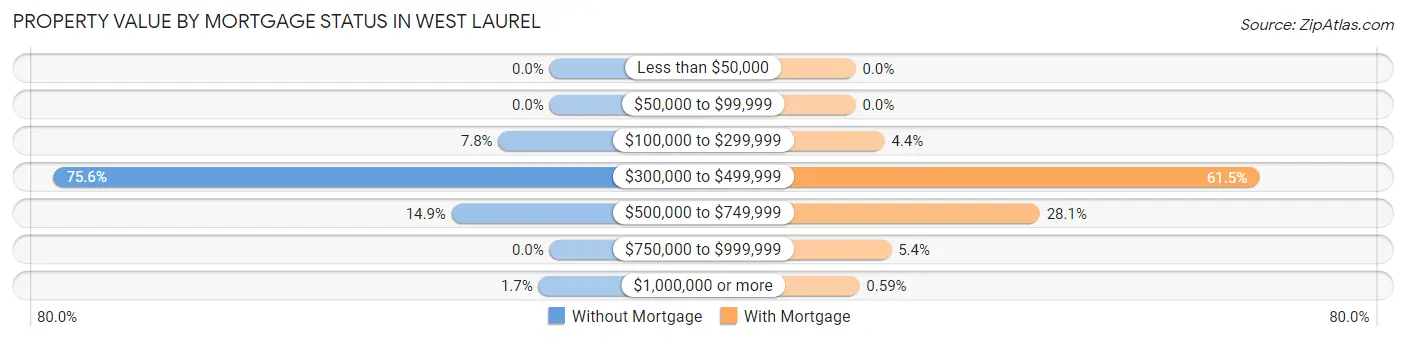
| Property Value | Without Mortgage | With Mortgage |
| Less than $50,000 | 0 (0.0%) | 0 (0.0%) |
| $50,000 to $99,999 | 0 (0.0%) | 0 (0.0%) |
| $100,000 to $299,999 | 23 (7.8%) | 52 (4.4%) |
| $300,000 to $499,999 | 223 (75.6%) | 725 (61.5%) |
| $500,000 to $749,999 | 44 (14.9%) | 331 (28.1%) |
| $750,000 to $999,999 | 0 (0.0%) | 64 (5.4%) |
| $1,000,000 or more | 5 (1.7%) | 7 (0.6%) |
| Total | 295 (100.0%) | 1,179 (100.0%) |
Household Income by Mortgage Status in West Laurel
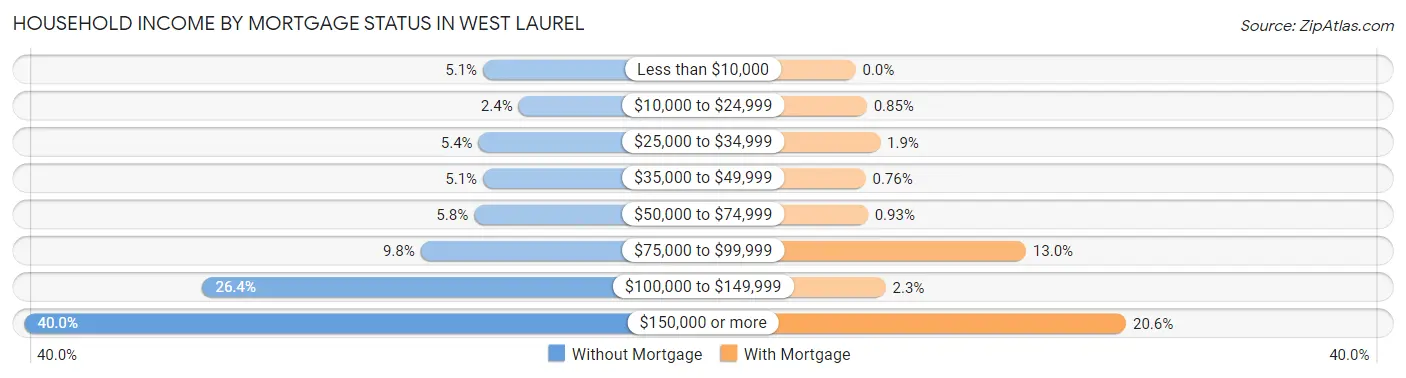
| Household Income | Without Mortgage | With Mortgage |
| Less than $10,000 | 15 (5.1%) | 0 (0.0%) |
| $10,000 to $24,999 | 7 (2.4%) | 10 (0.9%) |
| $25,000 to $34,999 | 16 (5.4%) | 22 (1.9%) |
| $35,000 to $49,999 | 15 (5.1%) | 9 (0.8%) |
| $50,000 to $74,999 | 17 (5.8%) | 11 (0.9%) |
| $75,000 to $99,999 | 29 (9.8%) | 153 (13.0%) |
| $100,000 to $149,999 | 78 (26.4%) | 27 (2.3%) |
| $150,000 or more | 118 (40.0%) | 243 (20.6%) |
| Total | 295 (100.0%) | 1,179 (100.0%) |
Property Value to Household Income Ratio in West Laurel
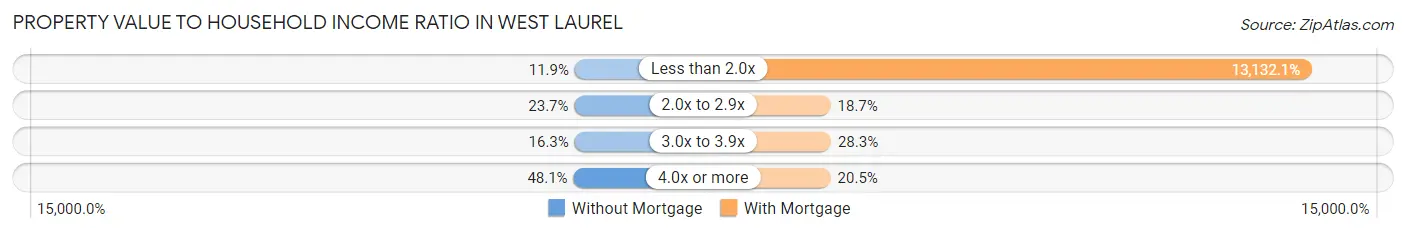
| Value-to-Income Ratio | Without Mortgage | With Mortgage |
| Less than 2.0x | 35 (11.9%) | 154,827 (13,132.1%) |
| 2.0x to 2.9x | 70 (23.7%) | 220 (18.7%) |
| 3.0x to 3.9x | 48 (16.3%) | 334 (28.3%) |
| 4.0x or more | 142 (48.1%) | 242 (20.5%) |
| Total | 295 (100.0%) | 1,179 (100.0%) |
Real Estate Taxes by Mortgage Status in West Laurel
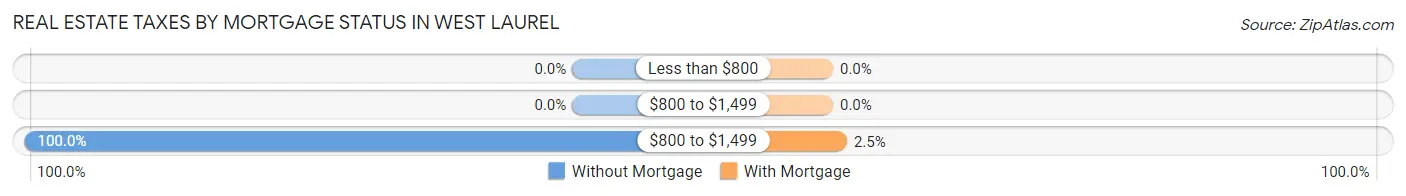
| Property Taxes | Without Mortgage | With Mortgage |
| Less than $800 | 0 (0.0%) | 0 (0.0%) |
| $800 to $1,499 | 0 (0.0%) | 0 (0.0%) |
| $800 to $1,499 | 295 (100.0%) | 30 (2.5%) |
| Total | 295 (100.0%) | 1,179 (100.0%) |
Health & Disability in West Laurel
Health Insurance Coverage by Age in West Laurel
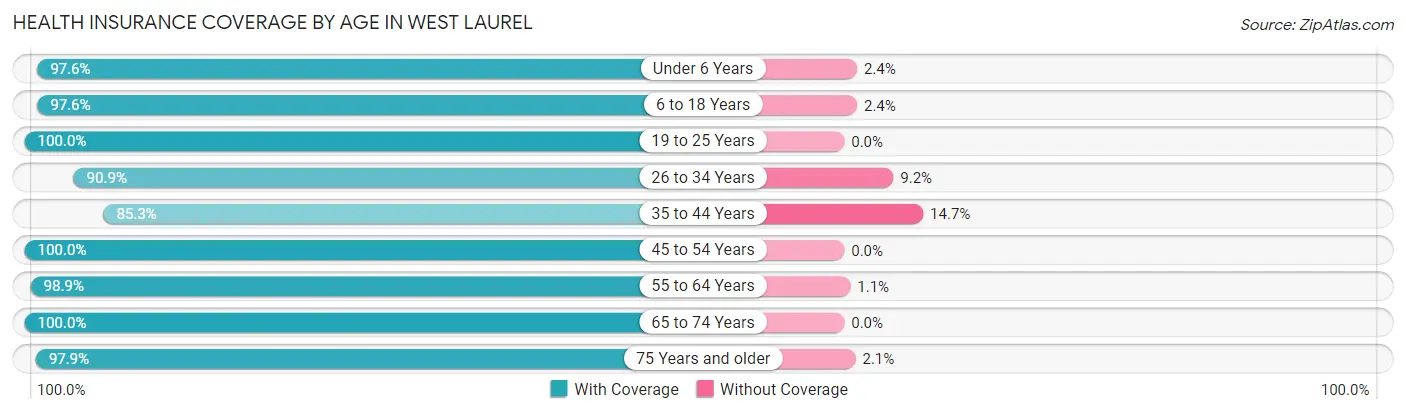
| Age Bracket | With Coverage | Without Coverage |
| Under 6 Years | 414 (97.6%) | 10 (2.4%) |
| 6 to 18 Years | 574 (97.6%) | 14 (2.4%) |
| 19 to 25 Years | 192 (100.0%) | 0 (0.0%) |
| 26 to 34 Years | 298 (90.8%) | 30 (9.1%) |
| 35 to 44 Years | 719 (85.3%) | 124 (14.7%) |
| 45 to 54 Years | 402 (100.0%) | 0 (0.0%) |
| 55 to 64 Years | 878 (98.9%) | 10 (1.1%) |
| 65 to 74 Years | 307 (100.0%) | 0 (0.0%) |
| 75 Years and older | 326 (97.9%) | 7 (2.1%) |
| Total | 4,110 (95.5%) | 195 (4.5%) |
Health Insurance Coverage by Citizenship Status in West Laurel
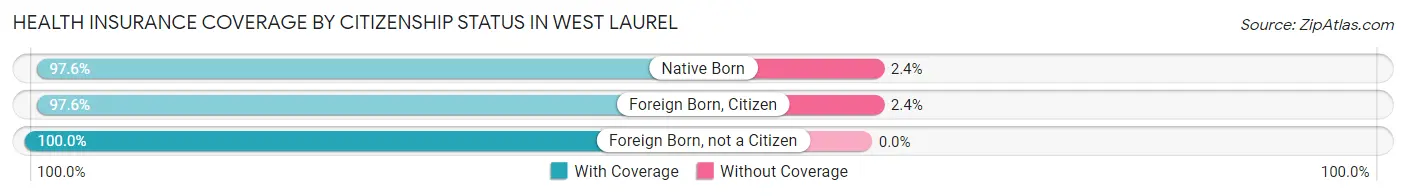
| Citizenship Status | With Coverage | Without Coverage |
| Native Born | 414 (97.6%) | 10 (2.4%) |
| Foreign Born, Citizen | 574 (97.6%) | 14 (2.4%) |
| Foreign Born, not a Citizen | 192 (100.0%) | 0 (0.0%) |
Health Insurance Coverage by Household Income in West Laurel
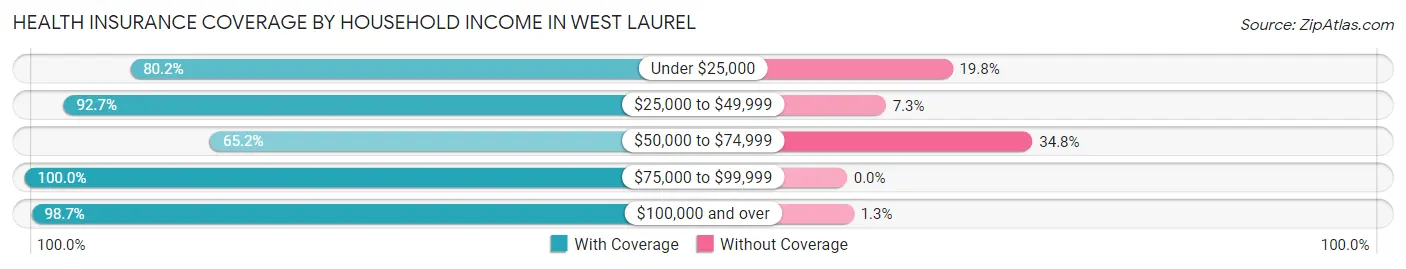
| Household Income | With Coverage | Without Coverage |
| Under $25,000 | 81 (80.2%) | 20 (19.8%) |
| $25,000 to $49,999 | 89 (92.7%) | 7 (7.3%) |
| $50,000 to $74,999 | 227 (65.2%) | 121 (34.8%) |
| $75,000 to $99,999 | 105 (100.0%) | 0 (0.0%) |
| $100,000 and over | 3,597 (98.7%) | 47 (1.3%) |
Public vs Private Health Insurance Coverage by Age in West Laurel
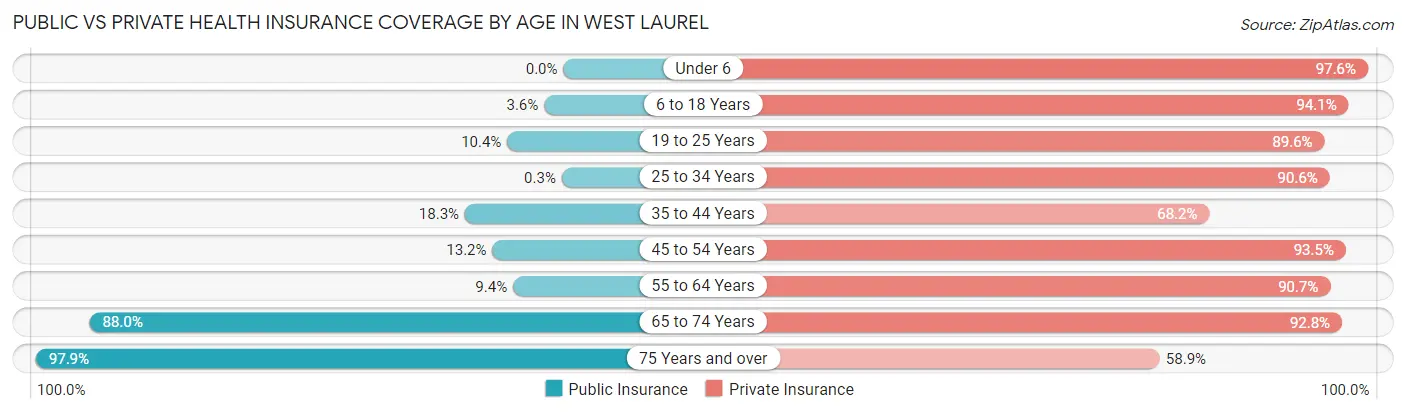
| Age Bracket | Public Insurance | Private Insurance |
| Under 6 | 0 (0.0%) | 414 (97.6%) |
| 6 to 18 Years | 21 (3.6%) | 553 (94.1%) |
| 19 to 25 Years | 20 (10.4%) | 172 (89.6%) |
| 25 to 34 Years | 1 (0.3%) | 297 (90.5%) |
| 35 to 44 Years | 154 (18.3%) | 575 (68.2%) |
| 45 to 54 Years | 53 (13.2%) | 376 (93.5%) |
| 55 to 64 Years | 83 (9.3%) | 805 (90.6%) |
| 65 to 74 Years | 270 (87.9%) | 285 (92.8%) |
| 75 Years and over | 326 (97.9%) | 196 (58.9%) |
| Total | 928 (21.6%) | 3,673 (85.3%) |
Disability Status by Sex by Age in West Laurel
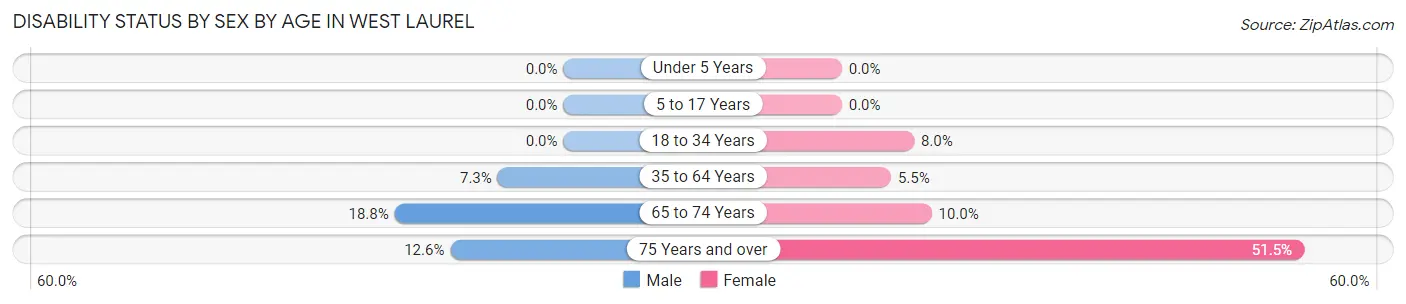
| Age Bracket | Male | Female |
| Under 5 Years | 0 (0.0%) | 0 (0.0%) |
| 5 to 17 Years | 0 (0.0%) | 0 (0.0%) |
| 18 to 34 Years | 0 (0.0%) | 23 (8.0%) |
| 35 to 64 Years | 84 (7.3%) | 54 (5.5%) |
| 65 to 74 Years | 22 (18.8%) | 19 (10.0%) |
| 75 Years and over | 16 (12.6%) | 106 (51.5%) |
Disability Class by Sex by Age in West Laurel
Disability Class: Hearing Difficulty
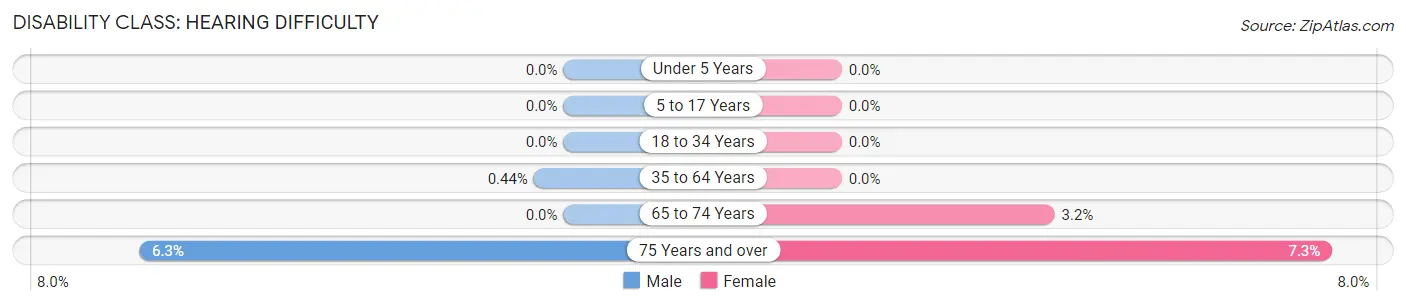
| Age Bracket | Male | Female |
| Under 5 Years | 0 (0.0%) | 0 (0.0%) |
| 5 to 17 Years | 0 (0.0%) | 0 (0.0%) |
| 18 to 34 Years | 0 (0.0%) | 0 (0.0%) |
| 35 to 64 Years | 5 (0.4%) | 0 (0.0%) |
| 65 to 74 Years | 0 (0.0%) | 6 (3.2%) |
| 75 Years and over | 8 (6.3%) | 15 (7.3%) |
Disability Class: Vision Difficulty
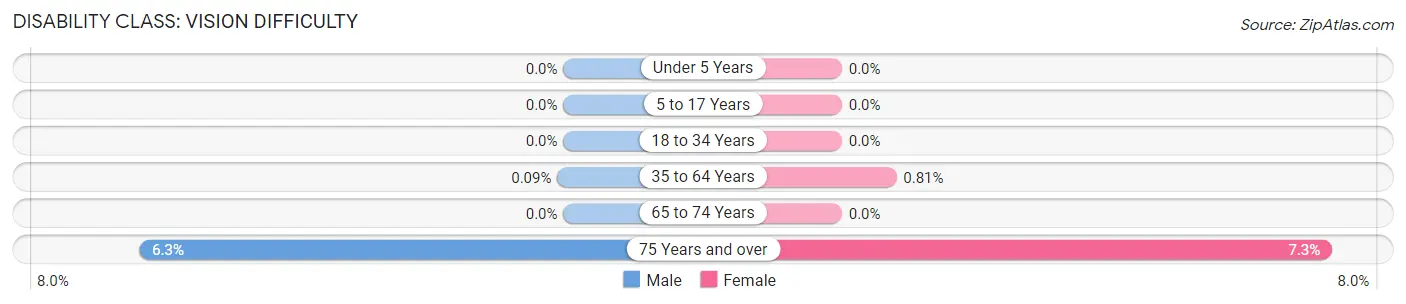
| Age Bracket | Male | Female |
| Under 5 Years | 0 (0.0%) | 0 (0.0%) |
| 5 to 17 Years | 0 (0.0%) | 0 (0.0%) |
| 18 to 34 Years | 0 (0.0%) | 0 (0.0%) |
| 35 to 64 Years | 1 (0.1%) | 8 (0.8%) |
| 65 to 74 Years | 0 (0.0%) | 0 (0.0%) |
| 75 Years and over | 8 (6.3%) | 15 (7.3%) |
Disability Class: Cognitive Difficulty
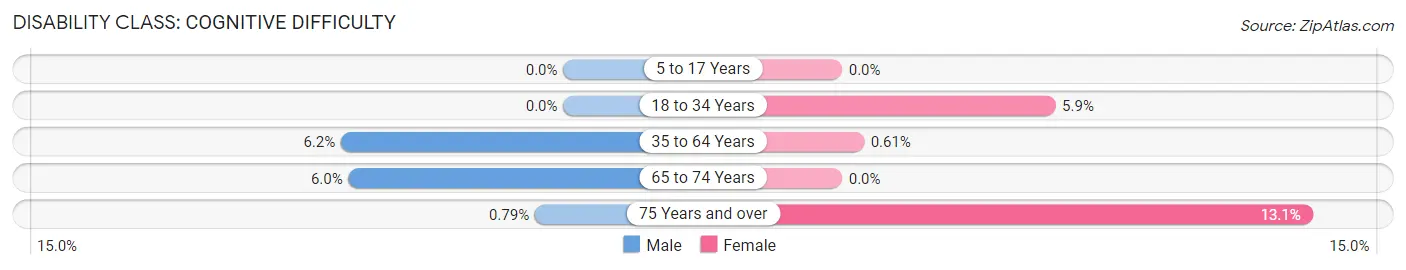
| Age Bracket | Male | Female |
| 5 to 17 Years | 0 (0.0%) | 0 (0.0%) |
| 18 to 34 Years | 0 (0.0%) | 17 (5.9%) |
| 35 to 64 Years | 71 (6.2%) | 6 (0.6%) |
| 65 to 74 Years | 7 (6.0%) | 0 (0.0%) |
| 75 Years and over | 1 (0.8%) | 27 (13.1%) |
Disability Class: Ambulatory Difficulty
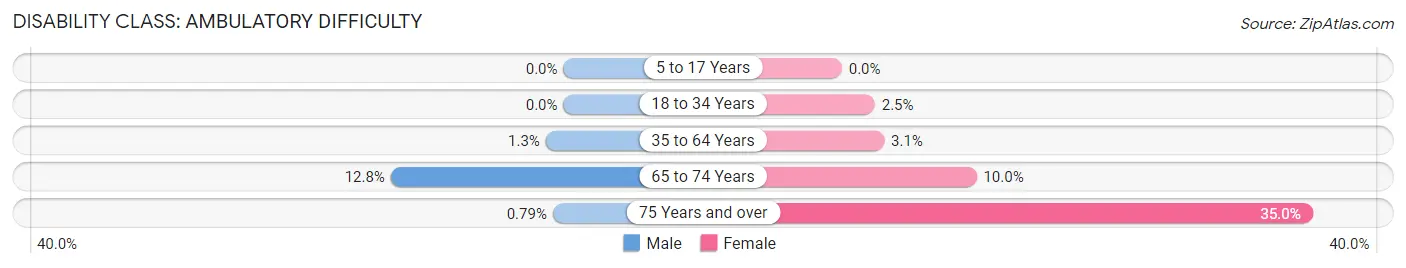
| Age Bracket | Male | Female |
| 5 to 17 Years | 0 (0.0%) | 0 (0.0%) |
| 18 to 34 Years | 0 (0.0%) | 7 (2.5%) |
| 35 to 64 Years | 15 (1.3%) | 31 (3.1%) |
| 65 to 74 Years | 15 (12.8%) | 19 (10.0%) |
| 75 Years and over | 1 (0.8%) | 72 (34.9%) |
Disability Class: Self-Care Difficulty
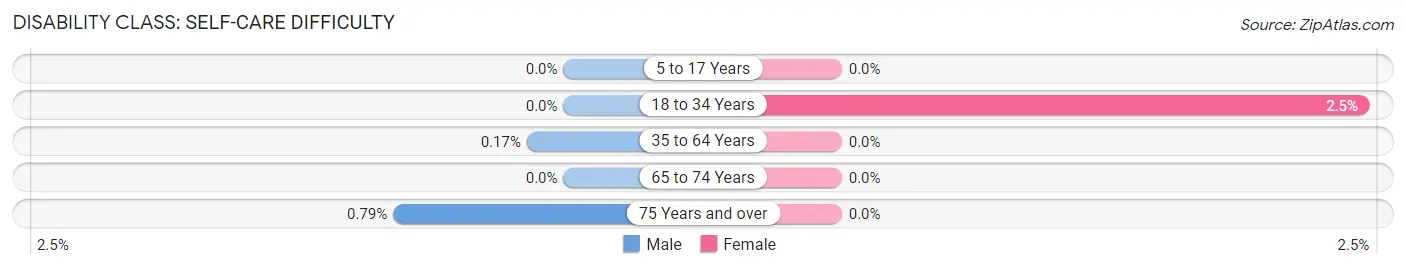
| Age Bracket | Male | Female |
| 5 to 17 Years | 0 (0.0%) | 0 (0.0%) |
| 18 to 34 Years | 0 (0.0%) | 7 (2.5%) |
| 35 to 64 Years | 2 (0.2%) | 0 (0.0%) |
| 65 to 74 Years | 0 (0.0%) | 0 (0.0%) |
| 75 Years and over | 1 (0.8%) | 0 (0.0%) |
Technology Access in West Laurel
Computing Device Access in West Laurel
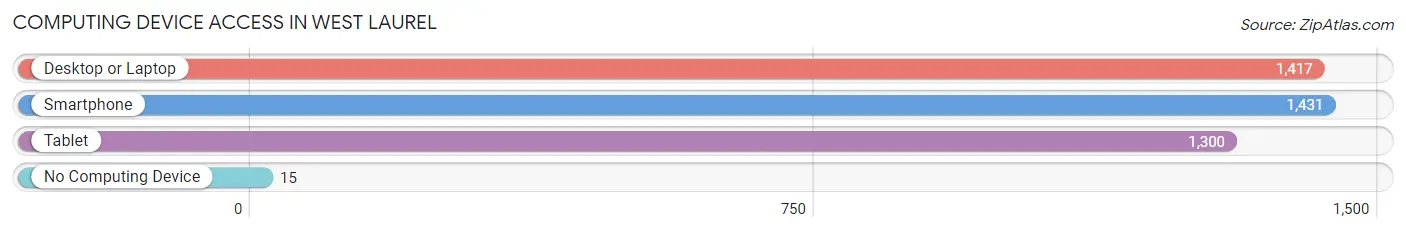
| Device Type | # Households | % Households |
| Desktop or Laptop | 1,417 | 93.6% |
| Smartphone | 1,431 | 94.6% |
| Tablet | 1,300 | 85.9% |
| No Computing Device | 15 | 1.0% |
| Total | 1,513 | 100.0% |
Internet Access in West Laurel
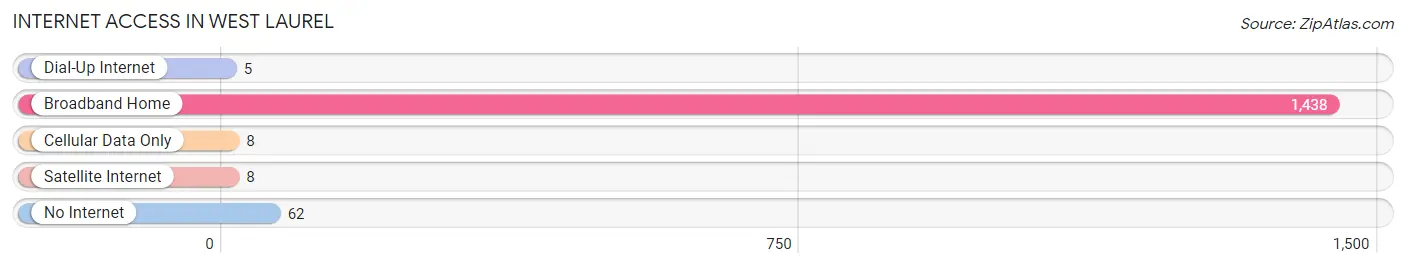
| Internet Type | # Households | % Households |
| Dial-Up Internet | 5 | 0.3% |
| Broadband Home | 1,438 | 95.0% |
| Cellular Data Only | 8 | 0.5% |
| Satellite Internet | 8 | 0.5% |
| No Internet | 62 | 4.1% |
| Total | 1,513 | 100.0% |
West Laurel Summary
History
West Laurel is a census-designated place (CDP) located in Prince George’s County, Maryland. It is a suburb of Washington, D.C. and is located approximately 10 miles northeast of the city. West Laurel was first settled in the late 1700s and was originally known as “Laurel Grove.” The area was primarily used for farming and was home to a few small businesses. In the early 1900s, the area began to grow and develop as a residential community. The population of West Laurel increased significantly in the 1950s and 1960s as the Washington, D.C. metropolitan area expanded.
Geography
West Laurel is located in Prince George’s County, Maryland. It is situated approximately 10 miles northeast of Washington, D.C. and is bordered by the towns of Beltsville, Burtonsville, and Laurel. The CDP has a total area of 4.2 square miles, all of which is land. The terrain is mostly flat and the area is heavily wooded. The Patuxent River runs through the western part of West Laurel.
Economy
West Laurel is primarily a residential community, but it does have a few businesses. The largest employer in the area is the U.S. Department of Agriculture, which has a research center located in the town. Other businesses in the area include a few small retail stores, restaurants, and professional services.
Demographics
As of the 2010 census, the population of West Laurel was 8,945. The population is primarily white (77.3%) and African American (17.2%). The median household income is $87,945 and the median age is 40. The town has a high rate of homeownership (83.3%) and a low rate of poverty (4.3%).
West Laurel is a diverse and vibrant community. It is a great place to live, work, and raise a family. The town has a strong sense of community and is a great place to call home.
Common Questions
What is the Total Population of West Laurel?
Total Population of West Laurel is 4,332.
What is the Total Male Population of West Laurel?
Total Male Population of West Laurel is 2,273.
What is the Total Female Population of West Laurel?
Total Female Population of West Laurel is 2,059.
What is the Ratio of Males per 100 Females in West Laurel?
There are 110.39 Males per 100 Females in West Laurel.
What is the Ratio of Females per 100 Males in West Laurel?
There are 90.59 Females per 100 Males in West Laurel.
What is the Median Population Age in West Laurel?
Median Population Age in West Laurel is 42.0 Years.
What is the Average Family Size in West Laurel
Average Family Size in West Laurel is 3.1 People.
What is the Average Household Size in West Laurel
Average Household Size in West Laurel is 2.8 People.
What is Per Capita Income in West Laurel?
Per Capita income in West Laurel is $57,923.
What is the Median Family Income in West Laurel?
Median Family Income in West Laurel is $167,827.
What is the Median Household income in West Laurel?
Median Household Income in West Laurel is $154,014.
What is Income or Wage Gap in West Laurel?
Income or Wage Gap in West Laurel is 21.5%.
Women in West Laurel earn 78.5 cents for every dollar earned by a man.
What is Inequality or Gini Index in West Laurel?
Inequality or Gini Index in West Laurel is 0.30.
How Large is the Labor Force in West Laurel?
There are 2,509 People in the Labor Forcein in West Laurel.
What is the Percentage of People in the Labor Force in West Laurel?
72.1% of People are in the Labor Force in West Laurel.
What is the Unemployment Rate in West Laurel?
Unemployment Rate in West Laurel is 2.8%.