Cities with the Highest Percentage of Scandinavian Population in Maryland
RELATED REPORTS & OPTIONS
Scandinavian
Maryland
Compare Cities
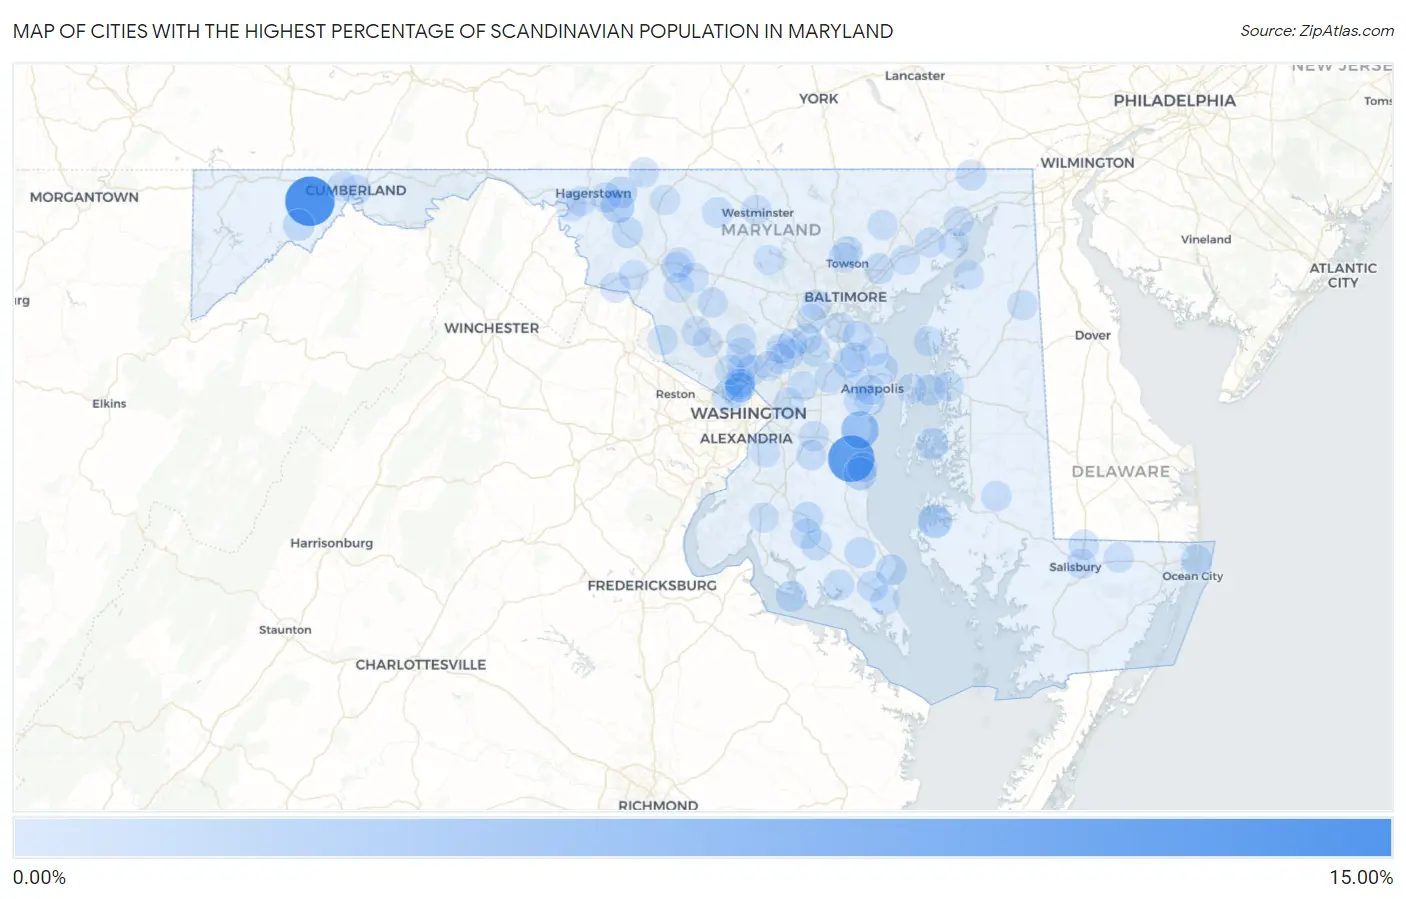
Map of Cities with the Highest Percentage of Scandinavian Population in Maryland
0.00%
15.00%
Cities with the Highest Percentage of Scandinavian Population in Maryland
| City | Scandinavian | vs State | vs National | |
| 1. | Klondike | 14.91% | 0.18%(+14.7)#1 | 0.30%(+14.6)#61 |
| 2. | Friendship | 12.58% | 0.18%(+12.4)#2 | 0.30%(+12.3)#80 |
| 3. | Galesville | 5.55% | 0.18%(+5.37)#3 | 0.30%(+5.24)#289 |
| 4. | Madison | 2.82% | 0.18%(+2.64)#4 | 0.30%(+2.51)#820 |
| 5. | Wildewood | 2.72% | 0.18%(+2.54)#5 | 0.30%(+2.41)#867 |
| 6. | Mount Aetna | 2.70% | 0.18%(+2.52)#6 | 0.30%(+2.40)#870 |
| 7. | Chesapeake Beach | 2.37% | 0.18%(+2.19)#7 | 0.30%(+2.07)#1,029 |
| 8. | St Michaels | 1.51% | 0.18%(+1.33)#8 | 0.30%(+1.21)#1,841 |
| 9. | Cavetown | 1.44% | 0.18%(+1.26)#9 | 0.30%(+1.13)#1,936 |
| 10. | Barton | 1.32% | 0.18%(+1.14)#10 | 0.30%(+1.02)#2,134 |
| 11. | Brookmont | 1.31% | 0.18%(+1.13)#11 | 0.30%(+1.01)#2,150 |
| 12. | Myersville | 1.16% | 0.18%(+0.982)#12 | 0.30%(+0.859)#2,452 |
| 13. | Hughesville | 1.13% | 0.18%(+0.950)#13 | 0.30%(+0.827)#2,526 |
| 14. | Chevy Chase Section Five | 1.13% | 0.18%(+0.949)#14 | 0.30%(+0.826)#2,528 |
| 15. | Chesapeake Ranch Estates | 1.13% | 0.18%(+0.947)#15 | 0.30%(+0.824)#2,534 |
| 16. | Cobb Island | 1.08% | 0.18%(+0.897)#16 | 0.30%(+0.774)#2,662 |
| 17. | Kent Narrows | 1.04% | 0.18%(+0.857)#17 | 0.30%(+0.734)#2,759 |
| 18. | North Chevy Chase | 1.03% | 0.18%(+0.847)#18 | 0.30%(+0.724)#2,791 |
| 19. | Arden On The Severn | 1.03% | 0.18%(+0.846)#19 | 0.30%(+0.723)#2,792 |
| 20. | Ocean City | 0.99% | 0.18%(+0.807)#20 | 0.30%(+0.684)#2,891 |
| 21. | Cape St Claire | 0.98% | 0.18%(+0.796)#21 | 0.30%(+0.673)#2,918 |
| 22. | Broomes Island | 0.95% | 0.18%(+0.773)#22 | 0.30%(+0.650)#2,971 |
| 23. | Mechanicsville | 0.95% | 0.18%(+0.772)#23 | 0.30%(+0.649)#2,975 |
| 24. | Fort Meade | 0.93% | 0.18%(+0.748)#24 | 0.30%(+0.625)#3,038 |
| 25. | California | 0.88% | 0.18%(+0.699)#25 | 0.30%(+0.576)#3,200 |
| 26. | Jessup | 0.81% | 0.18%(+0.631)#26 | 0.30%(+0.508)#3,450 |
| 27. | Crofton | 0.79% | 0.18%(+0.609)#27 | 0.30%(+0.486)#3,546 |
| 28. | Charlotte Hall | 0.78% | 0.18%(+0.599)#28 | 0.30%(+0.476)#3,589 |
| 29. | Abingdon | 0.76% | 0.18%(+0.582)#29 | 0.30%(+0.459)#3,664 |
| 30. | Rising Sun | 0.76% | 0.18%(+0.581)#30 | 0.30%(+0.458)#3,668 |
| 31. | Bartonsville | 0.72% | 0.18%(+0.535)#31 | 0.30%(+0.412)#3,856 |
| 32. | Leonardtown | 0.70% | 0.18%(+0.517)#32 | 0.30%(+0.393)#3,943 |
| 33. | White Marsh | 0.65% | 0.18%(+0.467)#33 | 0.30%(+0.344)#4,164 |
| 34. | Union Bridge | 0.64% | 0.18%(+0.458)#34 | 0.30%(+0.335)#4,216 |
| 35. | Ferndale | 0.64% | 0.18%(+0.455)#35 | 0.30%(+0.332)#4,232 |
| 36. | Robinwood | 0.60% | 0.18%(+0.419)#36 | 0.30%(+0.296)#4,403 |
| 37. | Kemp Mill | 0.59% | 0.18%(+0.407)#37 | 0.30%(+0.284)#4,460 |
| 38. | Pasadena | 0.58% | 0.18%(+0.397)#38 | 0.30%(+0.274)#4,519 |
| 39. | Green Valley | 0.54% | 0.18%(+0.358)#39 | 0.30%(+0.235)#4,741 |
| 40. | Delmar | 0.54% | 0.18%(+0.358)#40 | 0.30%(+0.235)#4,744 |
| 41. | Timonium | 0.51% | 0.18%(+0.328)#41 | 0.30%(+0.205)#4,926 |
| 42. | Parole | 0.49% | 0.18%(+0.310)#42 | 0.30%(+0.187)#5,051 |
| 43. | Lutherville | 0.49% | 0.18%(+0.304)#43 | 0.30%(+0.181)#5,095 |
| 44. | Highfield Cascade | 0.48% | 0.18%(+0.304)#44 | 0.30%(+0.181)#5,096 |
| 45. | Millington | 0.48% | 0.18%(+0.300)#45 | 0.30%(+0.177)#5,121 |
| 46. | Laurel | 0.48% | 0.18%(+0.295)#46 | 0.30%(+0.172)#5,159 |
| 47. | Poolesville | 0.47% | 0.18%(+0.294)#47 | 0.30%(+0.171)#5,177 |
| 48. | Secretary | 0.47% | 0.18%(+0.286)#48 | 0.30%(+0.163)#5,231 |
| 49. | Konterra | 0.45% | 0.18%(+0.270)#49 | 0.30%(+0.147)#5,355 |
| 50. | Wheaton | 0.44% | 0.18%(+0.258)#50 | 0.30%(+0.135)#5,453 |
| 51. | Damascus | 0.44% | 0.18%(+0.258)#51 | 0.30%(+0.135)#5,457 |
| 52. | Brunswick | 0.44% | 0.18%(+0.256)#52 | 0.30%(+0.133)#5,480 |
| 53. | Stevensville | 0.42% | 0.18%(+0.243)#53 | 0.30%(+0.120)#5,597 |
| 54. | Westminster | 0.42% | 0.18%(+0.242)#54 | 0.30%(+0.119)#5,608 |
| 55. | Croom | 0.42% | 0.18%(+0.241)#55 | 0.30%(+0.118)#5,614 |
| 56. | Williamsport | 0.42% | 0.18%(+0.237)#56 | 0.30%(+0.113)#5,653 |
| 57. | North Beach | 0.42% | 0.18%(+0.234)#57 | 0.30%(+0.111)#5,669 |
| 58. | Rock Hall | 0.41% | 0.18%(+0.231)#58 | 0.30%(+0.108)#5,705 |
| 59. | Chevy Chase | 0.41% | 0.18%(+0.227)#59 | 0.30%(+0.104)#5,741 |
| 60. | Riverside | 0.41% | 0.18%(+0.224)#60 | 0.30%(+0.101)#5,768 |
| 61. | Spring Ridge | 0.40% | 0.18%(+0.223)#61 | 0.30%(+0.100)#5,780 |
| 62. | Upper Marlboro | 0.40% | 0.18%(+0.214)#62 | 0.30%(+0.091)#5,847 |
| 63. | Catonsville | 0.39% | 0.18%(+0.207)#63 | 0.30%(+0.084)#5,912 |
| 64. | Annapolis Neck | 0.39% | 0.18%(+0.204)#64 | 0.30%(+0.081)#5,943 |
| 65. | Severna Park | 0.37% | 0.18%(+0.187)#65 | 0.30%(+0.064)#6,119 |
| 66. | Queenstown | 0.37% | 0.18%(+0.187)#66 | 0.30%(+0.064)#6,122 |
| 67. | Cumberland | 0.37% | 0.18%(+0.186)#67 | 0.30%(+0.063)#6,126 |
| 68. | Edgewater | 0.36% | 0.18%(+0.177)#68 | 0.30%(+0.054)#6,212 |
| 69. | Monrovia | 0.34% | 0.18%(+0.154)#69 | 0.30%(+0.031)#6,446 |
| 70. | Salisbury | 0.33% | 0.18%(+0.152)#70 | 0.30%(+0.029)#6,466 |
| 71. | Aberdeen Proving Ground | 0.33% | 0.18%(+0.152)#71 | 0.30%(+0.029)#6,475 |
| 72. | Glenn Dale | 0.33% | 0.18%(+0.147)#72 | 0.30%(+0.024)#6,526 |
| 73. | Halfway | 0.32% | 0.18%(+0.142)#73 | 0.30%(+0.019)#6,578 |
| 74. | Olney | 0.32% | 0.18%(+0.140)#74 | 0.30%(+0.017)#6,603 |
| 75. | North Laurel | 0.32% | 0.18%(+0.138)#75 | 0.30%(+0.015)#6,614 |
| 76. | Urbana | 0.31% | 0.18%(+0.125)#76 | 0.30%(+0.002)#6,739 |
| 77. | Eldersburg | 0.30% | 0.18%(+0.122)#77 | 0.30%(-0.001)#6,782 |
| 78. | Annapolis | 0.30% | 0.18%(+0.121)#78 | 0.30%(-0.002)#6,799 |
| 79. | Friendship Heights Village | 0.30% | 0.18%(+0.120)#79 | 0.30%(-0.003)#6,809 |
| 80. | North Bethesda | 0.30% | 0.18%(+0.118)#80 | 0.30%(-0.005)#6,838 |
| 81. | Chevy Chase Section Three | 0.29% | 0.18%(+0.111)#81 | 0.30%(-0.012)#6,921 |
| 82. | Lexington Park | 0.29% | 0.18%(+0.107)#82 | 0.30%(-0.016)#6,975 |
| 83. | Glenarden | 0.28% | 0.18%(+0.103)#83 | 0.30%(-0.020)#7,019 |
| 84. | Fallston | 0.28% | 0.18%(+0.100)#84 | 0.30%(-0.023)#7,054 |
| 85. | West Laurel | 0.28% | 0.18%(+0.096)#85 | 0.30%(-0.027)#7,103 |
| 86. | La Vale | 0.28% | 0.18%(+0.095)#86 | 0.30%(-0.029)#7,117 |
| 87. | Betterton | 0.28% | 0.18%(+0.094)#87 | 0.30%(-0.029)#7,122 |
| 88. | Pittsville | 0.27% | 0.18%(+0.091)#88 | 0.30%(-0.032)#7,165 |
| 89. | Havre De Grace | 0.26% | 0.18%(+0.083)#89 | 0.30%(-0.040)#7,268 |
| 90. | Calverton | 0.26% | 0.18%(+0.075)#90 | 0.30%(-0.048)#7,397 |
| 91. | Jefferson | 0.26% | 0.18%(+0.074)#91 | 0.30%(-0.049)#7,416 |
| 92. | Friendly | 0.25% | 0.18%(+0.073)#92 | 0.30%(-0.051)#7,444 |
| 93. | Thurmont | 0.25% | 0.18%(+0.072)#93 | 0.30%(-0.051)#7,452 |
| 94. | Ilchester | 0.25% | 0.18%(+0.068)#94 | 0.30%(-0.055)#7,510 |
| 95. | Gaithersburg | 0.25% | 0.18%(+0.065)#95 | 0.30%(-0.058)#7,552 |
| 96. | Leisure World | 0.25% | 0.18%(+0.064)#96 | 0.30%(-0.059)#7,576 |
| 97. | Lake Shore | 0.24% | 0.18%(+0.062)#97 | 0.30%(-0.061)#7,601 |
| 98. | La Plata | 0.23% | 0.18%(+0.052)#98 | 0.30%(-0.071)#7,747 |
| 99. | Joppatowne | 0.22% | 0.18%(+0.043)#99 | 0.30%(-0.080)#7,888 |
| 100. | Germantown | 0.22% | 0.18%(+0.036)#100 | 0.30%(-0.087)#7,988 |
Common Questions
What are the Top 10 Cities with the Highest Percentage of Scandinavian Population in Maryland?
Top 10 Cities with the Highest Percentage of Scandinavian Population in Maryland are:
#1
14.91%
#2
12.58%
#3
5.55%
#4
2.82%
#5
2.70%
#6
2.37%
#7
1.51%
#8
1.44%
#9
1.32%
#10
1.31%
What city has the Highest Percentage of Scandinavian Population in Maryland?
Klondike has the Highest Percentage of Scandinavian Population in Maryland with 14.91%.
What is the Percentage of Scandinavian Population in the State of Maryland?
Percentage of Scandinavian Population in Maryland is 0.18%.
What is the Percentage of Scandinavian Population in the United States?
Percentage of Scandinavian Population in the United States is 0.30%.