Cities with the Highest Percentage of Immigrants from Italy in Maryland
RELATED REPORTS & OPTIONS
Italy
Maryland
Compare Cities
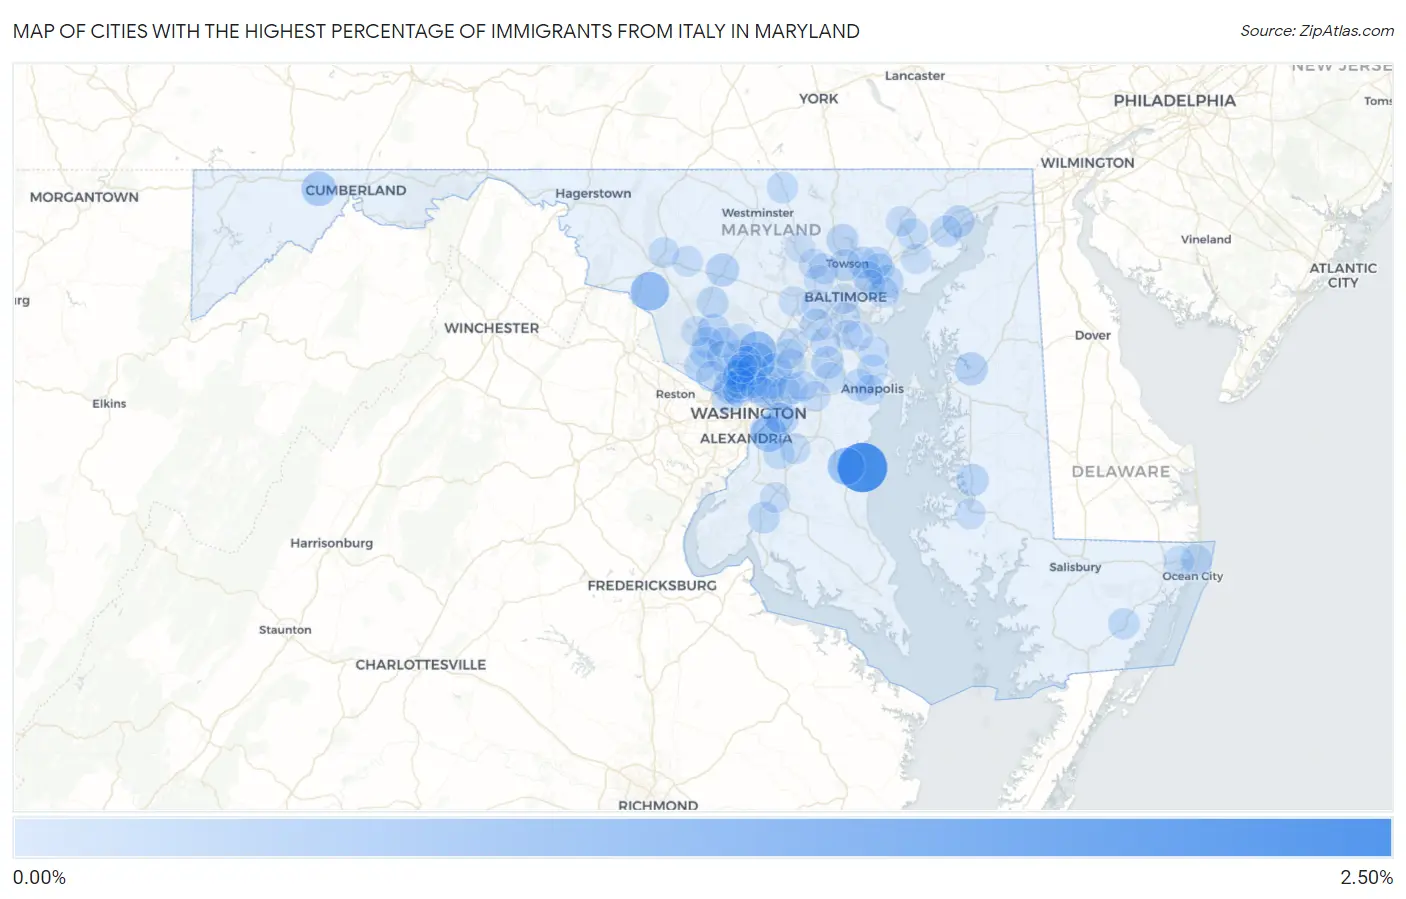
Map of Cities with the Highest Percentage of Immigrants from Italy in Maryland
0.00%
2.50%
Cities with the Highest Percentage of Immigrants from Italy in Maryland
| City | Italy | vs State | vs National | |
| 1. | North Beach | 2.49% | 0.075%(+2.42)#1 | 0.095%(+2.40)#72 |
| 2. | Burnt Mills | 1.22% | 0.075%(+1.15)#2 | 0.095%(+1.13)#251 |
| 3. | Adamstown | 1.04% | 0.075%(+0.970)#3 | 0.095%(+0.950)#310 |
| 4. | Colesville | 0.90% | 0.075%(+0.823)#4 | 0.095%(+0.803)#398 |
| 5. | Owings | 0.88% | 0.075%(+0.809)#5 | 0.095%(+0.789)#402 |
| 6. | Cloverly | 0.88% | 0.075%(+0.802)#6 | 0.095%(+0.782)#411 |
| 7. | Marlow Heights | 0.75% | 0.075%(+0.677)#7 | 0.095%(+0.657)#495 |
| 8. | Frostburg | 0.56% | 0.075%(+0.487)#8 | 0.095%(+0.467)#705 |
| 9. | Beltsville | 0.41% | 0.075%(+0.336)#9 | 0.095%(+0.317)#971 |
| 10. | Mount Airy | 0.39% | 0.075%(+0.319)#10 | 0.095%(+0.299)#1,005 |
| 11. | Centreville | 0.38% | 0.075%(+0.308)#11 | 0.095%(+0.288)#1,035 |
| 12. | Chevy Chase Section Five | 0.38% | 0.075%(+0.302)#12 | 0.095%(+0.282)#1,055 |
| 13. | Bethesda | 0.37% | 0.075%(+0.298)#13 | 0.095%(+0.278)#1,066 |
| 14. | Brookmont | 0.35% | 0.075%(+0.274)#14 | 0.095%(+0.254)#1,123 |
| 15. | South Kensington | 0.35% | 0.075%(+0.272)#15 | 0.095%(+0.252)#1,127 |
| 16. | Elkridge | 0.31% | 0.075%(+0.234)#16 | 0.095%(+0.214)#1,259 |
| 17. | Trappe | 0.29% | 0.075%(+0.220)#17 | 0.095%(+0.200)#1,319 |
| 18. | Odenton | 0.29% | 0.075%(+0.219)#18 | 0.095%(+0.199)#1,323 |
| 19. | Middle River | 0.27% | 0.075%(+0.198)#19 | 0.095%(+0.178)#1,397 |
| 20. | Cockeysville | 0.26% | 0.075%(+0.188)#20 | 0.095%(+0.168)#1,443 |
| 21. | Walker Mill | 0.26% | 0.075%(+0.186)#21 | 0.095%(+0.166)#1,454 |
| 22. | Montgomery Village | 0.25% | 0.075%(+0.176)#22 | 0.095%(+0.156)#1,492 |
| 23. | College Park | 0.25% | 0.075%(+0.172)#23 | 0.095%(+0.152)#1,504 |
| 24. | Havre De Grace | 0.24% | 0.075%(+0.170)#24 | 0.095%(+0.150)#1,512 |
| 25. | Hyattsville | 0.24% | 0.075%(+0.160)#25 | 0.095%(+0.140)#1,560 |
| 26. | Towson | 0.23% | 0.075%(+0.160)#26 | 0.095%(+0.140)#1,562 |
| 27. | Aberdeen | 0.23% | 0.075%(+0.151)#27 | 0.095%(+0.131)#1,604 |
| 28. | Parole | 0.22% | 0.075%(+0.147)#28 | 0.095%(+0.127)#1,618 |
| 29. | La Plata | 0.21% | 0.075%(+0.139)#29 | 0.095%(+0.119)#1,661 |
| 30. | North Kensington | 0.21% | 0.075%(+0.138)#30 | 0.095%(+0.118)#1,669 |
| 31. | Travilah | 0.21% | 0.075%(+0.137)#31 | 0.095%(+0.118)#1,673 |
| 32. | Perry Hall | 0.20% | 0.075%(+0.124)#32 | 0.095%(+0.104)#1,766 |
| 33. | New Carrollton | 0.19% | 0.075%(+0.117)#33 | 0.095%(+0.097)#1,806 |
| 34. | Gaithersburg | 0.19% | 0.075%(+0.117)#34 | 0.095%(+0.097)#1,809 |
| 35. | Damascus | 0.19% | 0.075%(+0.115)#35 | 0.095%(+0.095)#1,816 |
| 36. | Carney | 0.19% | 0.075%(+0.113)#36 | 0.095%(+0.093)#1,828 |
| 37. | Manchester | 0.19% | 0.075%(+0.110)#37 | 0.095%(+0.091)#1,844 |
| 38. | North Bethesda | 0.18% | 0.075%(+0.104)#38 | 0.095%(+0.084)#1,888 |
| 39. | Kensington | 0.18% | 0.075%(+0.104)#39 | 0.095%(+0.084)#1,889 |
| 40. | Chevy Chase View | 0.18% | 0.075%(+0.104)#40 | 0.095%(+0.084)#1,893 |
| 41. | Snow Hill | 0.17% | 0.075%(+0.095)#41 | 0.095%(+0.075)#1,936 |
| 42. | Chevy Chase Village | 0.16% | 0.075%(+0.085)#42 | 0.095%(+0.065)#2,012 |
| 43. | North Potomac | 0.15% | 0.075%(+0.071)#43 | 0.095%(+0.051)#2,077 |
| 44. | Ocean City | 0.15% | 0.075%(+0.071)#44 | 0.095%(+0.051)#2,080 |
| 45. | Takoma Park | 0.14% | 0.075%(+0.062)#45 | 0.095%(+0.042)#2,136 |
| 46. | White Marsh | 0.13% | 0.075%(+0.051)#46 | 0.095%(+0.031)#2,236 |
| 47. | Bel Air South | 0.12% | 0.075%(+0.050)#47 | 0.095%(+0.030)#2,251 |
| 48. | Clinton | 0.12% | 0.075%(+0.050)#48 | 0.095%(+0.030)#2,252 |
| 49. | Frederick | 0.12% | 0.075%(+0.049)#49 | 0.095%(+0.029)#2,260 |
| 50. | Green Valley | 0.12% | 0.075%(+0.049)#50 | 0.095%(+0.029)#2,263 |
| 51. | Rockville | 0.12% | 0.075%(+0.046)#51 | 0.095%(+0.026)#2,289 |
| 52. | North Laurel | 0.12% | 0.075%(+0.044)#52 | 0.095%(+0.024)#2,305 |
| 53. | Arnold | 0.11% | 0.075%(+0.038)#53 | 0.095%(+0.018)#2,355 |
| 54. | Silver Spring | 0.11% | 0.075%(+0.033)#54 | 0.095%(+0.013)#2,391 |
| 55. | Aspen Hill | 0.10% | 0.075%(+0.029)#55 | 0.095%(+0.009)#2,432 |
| 56. | Kemp Mill | 0.099% | 0.075%(+0.025)#56 | 0.095%(+0.005)#2,459 |
| 57. | Crofton | 0.095% | 0.075%(+0.021)#57 | 0.095%(+0.001)#2,489 |
| 58. | Essex | 0.093% | 0.075%(+0.018)#58 | 0.095%(-0.001)#2,510 |
| 59. | Olney | 0.093% | 0.075%(+0.018)#59 | 0.095%(-0.002)#2,512 |
| 60. | Linganore | 0.093% | 0.075%(+0.018)#60 | 0.095%(-0.002)#2,513 |
| 61. | Cambridge | 0.092% | 0.075%(+0.017)#61 | 0.095%(-0.003)#2,518 |
| 62. | Seabrook | 0.088% | 0.075%(+0.013)#62 | 0.095%(-0.007)#2,563 |
| 63. | Redland | 0.082% | 0.075%(+0.007)#63 | 0.095%(-0.013)#2,619 |
| 64. | Chevy Chase | 0.082% | 0.075%(+0.007)#64 | 0.095%(-0.013)#2,620 |
| 65. | Ocean Pines | 0.081% | 0.075%(+0.007)#65 | 0.095%(-0.013)#2,626 |
| 66. | Overlea | 0.078% | 0.075%(+0.004)#66 | 0.095%(-0.016)#2,657 |
| 67. | Brooklyn Park | 0.075% | 0.075%(+0.001)#67 | 0.095%(-0.019)#2,685 |
| 68. | Rosaryville | 0.075% | 0.075%(+0.000)#68 | 0.095%(-0.020)#2,697 |
| 69. | Annapolis | 0.074% | 0.075%(-0.001)#69 | 0.095%(-0.021)#2,707 |
| 70. | Woodlawn Cdp Baltimore County | 0.073% | 0.075%(-0.001)#70 | 0.095%(-0.021)#2,714 |
| 71. | Glenn Dale | 0.072% | 0.075%(-0.002)#71 | 0.095%(-0.022)#2,723 |
| 72. | Edgewood | 0.072% | 0.075%(-0.003)#72 | 0.095%(-0.023)#2,733 |
| 73. | Pikesville | 0.070% | 0.075%(-0.004)#73 | 0.095%(-0.024)#2,750 |
| 74. | Lake Shore | 0.069% | 0.075%(-0.006)#74 | 0.095%(-0.026)#2,765 |
| 75. | Glenmont | 0.066% | 0.075%(-0.008)#75 | 0.095%(-0.028)#2,803 |
| 76. | Rosedale | 0.065% | 0.075%(-0.010)#76 | 0.095%(-0.030)#2,819 |
| 77. | Waldorf | 0.064% | 0.075%(-0.010)#77 | 0.095%(-0.030)#2,827 |
| 78. | Bel Air North | 0.064% | 0.075%(-0.011)#78 | 0.095%(-0.031)#2,832 |
| 79. | Potomac | 0.060% | 0.075%(-0.014)#79 | 0.095%(-0.034)#2,870 |
| 80. | Pasadena | 0.053% | 0.075%(-0.022)#80 | 0.095%(-0.042)#2,955 |
| 81. | Bowie | 0.052% | 0.075%(-0.023)#81 | 0.095%(-0.043)#2,970 |
| 82. | Ellicott City | 0.052% | 0.075%(-0.023)#82 | 0.095%(-0.043)#2,973 |
| 83. | Catonsville | 0.051% | 0.075%(-0.023)#83 | 0.095%(-0.043)#2,978 |
| 84. | Severn | 0.046% | 0.075%(-0.029)#84 | 0.095%(-0.048)#3,038 |
| 85. | South Laurel | 0.046% | 0.075%(-0.029)#85 | 0.095%(-0.049)#3,041 |
| 86. | Baltimore | 0.045% | 0.075%(-0.029)#86 | 0.095%(-0.049)#3,049 |
| 87. | Reisterstown | 0.043% | 0.075%(-0.031)#87 | 0.095%(-0.051)#3,077 |
| 88. | Garrison | 0.041% | 0.075%(-0.034)#88 | 0.095%(-0.054)#3,110 |
| 89. | Chillum | 0.036% | 0.075%(-0.038)#89 | 0.095%(-0.058)#3,168 |
| 90. | Wheaton | 0.036% | 0.075%(-0.039)#90 | 0.095%(-0.059)#3,171 |
| 91. | Germantown | 0.028% | 0.075%(-0.047)#91 | 0.095%(-0.067)#3,295 |
| 92. | Capitol Heights | 0.025% | 0.075%(-0.050)#92 | 0.095%(-0.070)#3,341 |
| 93. | Laurel | 0.020% | 0.075%(-0.054)#93 | 0.095%(-0.074)#3,407 |
| 94. | Glen Burnie | 0.011% | 0.075%(-0.063)#94 | 0.095%(-0.083)#3,531 |
| 95. | Hillcrest Heights | 0.0061% | 0.075%(-0.069)#95 | 0.095%(-0.088)#3,592 |
| 96. | Lochearn | 0.0037% | 0.075%(-0.071)#96 | 0.095%(-0.091)#3,614 |
Common Questions
What are the Top 10 Cities with the Highest Percentage of Immigrants from Italy in Maryland?
Top 10 Cities with the Highest Percentage of Immigrants from Italy in Maryland are:
#1
2.49%
#2
1.04%
#3
0.90%
#4
0.88%
#5
0.88%
#6
0.75%
#7
0.56%
#8
0.41%
#9
0.39%
#10
0.38%
What city has the Highest Percentage of Immigrants from Italy in Maryland?
North Beach has the Highest Percentage of Immigrants from Italy in Maryland with 2.49%.
What is the Percentage of Immigrants from Italy in the State of Maryland?
Percentage of Immigrants from Italy in Maryland is 0.075%.
What is the Percentage of Immigrants from Italy in the United States?
Percentage of Immigrants from Italy in the United States is 0.095%.