Cities with the Highest Percentage of Immigrants from Bangladesh in Maryland
RELATED REPORTS & OPTIONS
Bangladesh
Maryland
Compare Cities
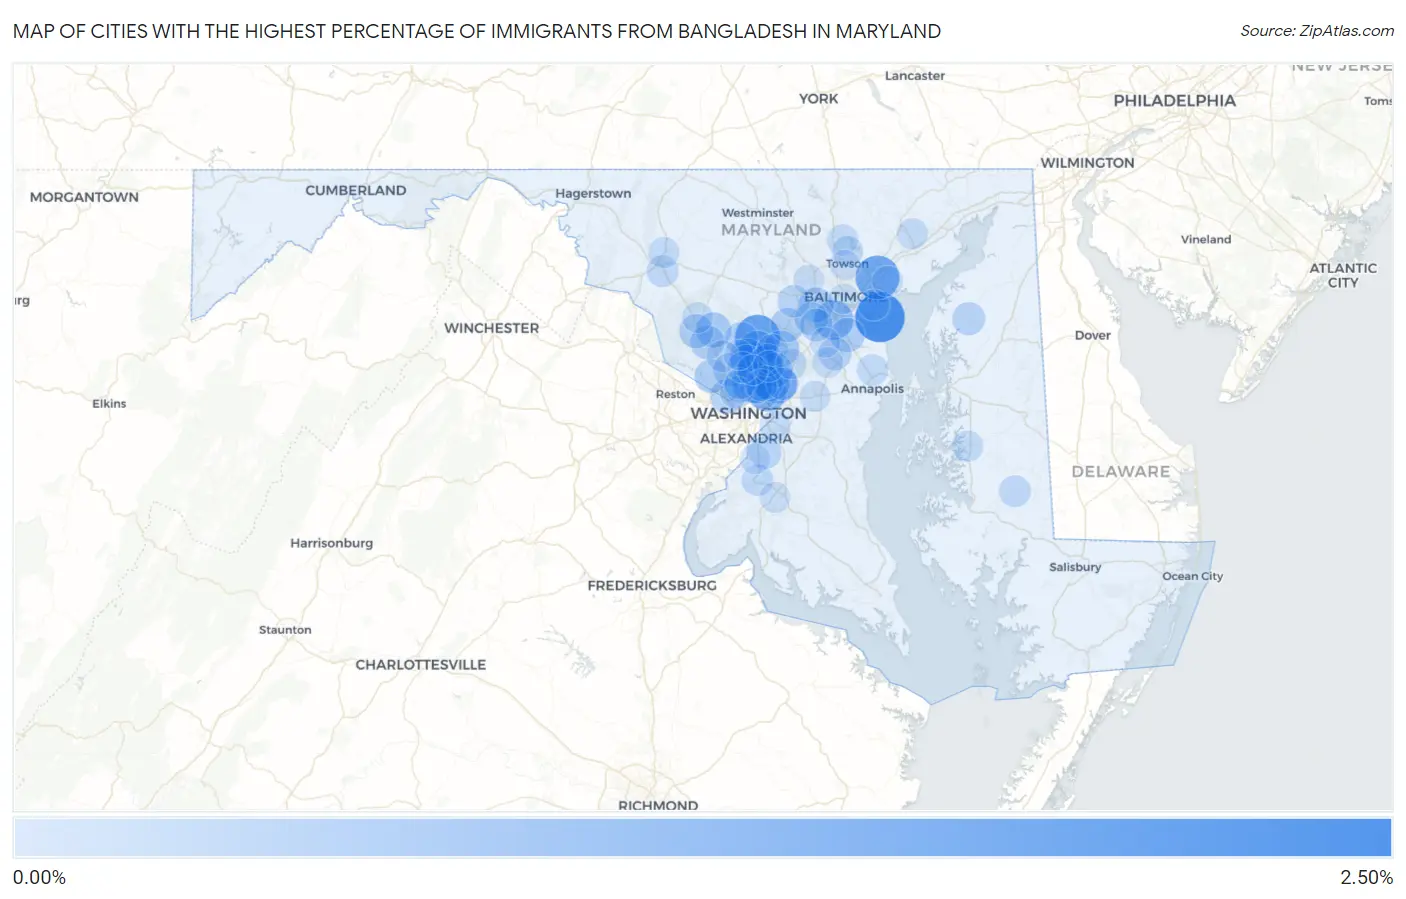
Map of Cities with the Highest Percentage of Immigrants from Bangladesh in Maryland
0.00%
2.50%
Cities with the Highest Percentage of Immigrants from Bangladesh in Maryland
| City | Bangladesh | vs State | vs National | |
| 1. | Edgemere | 2.04% | 0.12%(+1.92)#1 | 0.082%(+1.96)#46 |
| 2. | Burnt Mills | 1.85% | 0.12%(+1.74)#2 | 0.082%(+1.77)#52 |
| 3. | Ashton Sandy Spring | 1.58% | 0.12%(+1.46)#3 | 0.082%(+1.50)#65 |
| 4. | Rossville | 1.44% | 0.12%(+1.32)#4 | 0.082%(+1.36)#73 |
| 5. | White Oak | 1.39% | 0.12%(+1.27)#5 | 0.082%(+1.31)#79 |
| 6. | Silver Spring | 1.05% | 0.12%(+0.936)#6 | 0.082%(+0.969)#108 |
| 7. | Linthicum | 0.94% | 0.12%(+0.826)#7 | 0.082%(+0.859)#126 |
| 8. | Berwyn Heights | 0.94% | 0.12%(+0.820)#8 | 0.082%(+0.854)#128 |
| 9. | Woodlawn Cdp Baltimore County | 0.90% | 0.12%(+0.784)#9 | 0.082%(+0.818)#135 |
| 10. | Colesville | 0.88% | 0.12%(+0.767)#10 | 0.082%(+0.801)#141 |
| 11. | Hyattsville | 0.85% | 0.12%(+0.738)#11 | 0.082%(+0.772)#150 |
| 12. | Cloverly | 0.84% | 0.12%(+0.724)#12 | 0.082%(+0.758)#154 |
| 13. | College Park | 0.74% | 0.12%(+0.628)#13 | 0.082%(+0.662)#178 |
| 14. | West Laurel | 0.60% | 0.12%(+0.485)#14 | 0.082%(+0.518)#212 |
| 15. | Layhill | 0.54% | 0.12%(+0.427)#15 | 0.082%(+0.461)#238 |
| 16. | Montgomery Village | 0.50% | 0.12%(+0.382)#16 | 0.082%(+0.416)#250 |
| 17. | Catonsville | 0.49% | 0.12%(+0.375)#17 | 0.082%(+0.409)#254 |
| 18. | Beltsville | 0.49% | 0.12%(+0.372)#18 | 0.082%(+0.405)#256 |
| 19. | Brookmont | 0.46% | 0.12%(+0.340)#19 | 0.082%(+0.374)#276 |
| 20. | Glen Burnie | 0.44% | 0.12%(+0.324)#20 | 0.082%(+0.358)#286 |
| 21. | Gaithersburg | 0.41% | 0.12%(+0.296)#21 | 0.082%(+0.330)#302 |
| 22. | Germantown | 0.41% | 0.12%(+0.292)#22 | 0.082%(+0.326)#307 |
| 23. | Columbia | 0.39% | 0.12%(+0.277)#23 | 0.082%(+0.310)#319 |
| 24. | Potomac | 0.37% | 0.12%(+0.259)#24 | 0.082%(+0.292)#338 |
| 25. | North Bethesda | 0.37% | 0.12%(+0.256)#25 | 0.082%(+0.290)#340 |
| 26. | Ilchester | 0.34% | 0.12%(+0.225)#26 | 0.082%(+0.259)#366 |
| 27. | Adelphi | 0.32% | 0.12%(+0.209)#27 | 0.082%(+0.243)#382 |
| 28. | Olney | 0.32% | 0.12%(+0.200)#28 | 0.082%(+0.233)#394 |
| 29. | Chestertown | 0.29% | 0.12%(+0.174)#29 | 0.082%(+0.208)#423 |
| 30. | Gambrills | 0.29% | 0.12%(+0.174)#30 | 0.082%(+0.207)#424 |
| 31. | Glenmont | 0.28% | 0.12%(+0.161)#31 | 0.082%(+0.195)#441 |
| 32. | Elkridge | 0.27% | 0.12%(+0.154)#32 | 0.082%(+0.187)#455 |
| 33. | Chevy Chase Section Five | 0.25% | 0.12%(+0.136)#33 | 0.082%(+0.169)#477 |
| 34. | Ellicott City | 0.24% | 0.12%(+0.129)#34 | 0.082%(+0.163)#490 |
| 35. | Friendly | 0.24% | 0.12%(+0.129)#35 | 0.082%(+0.162)#491 |
| 36. | Chillum | 0.23% | 0.12%(+0.118)#36 | 0.082%(+0.152)#508 |
| 37. | Fairland | 0.22% | 0.12%(+0.108)#37 | 0.082%(+0.141)#522 |
| 38. | Takoma Park | 0.22% | 0.12%(+0.107)#38 | 0.082%(+0.140)#524 |
| 39. | Greenbelt | 0.22% | 0.12%(+0.103)#39 | 0.082%(+0.137)#528 |
| 40. | Friendship Heights Village | 0.21% | 0.12%(+0.093)#40 | 0.082%(+0.127)#542 |
| 41. | Ballenger Creek | 0.18% | 0.12%(+0.061)#41 | 0.082%(+0.095)#602 |
| 42. | Hurlock | 0.18% | 0.12%(+0.060)#42 | 0.082%(+0.093)#605 |
| 43. | Langley Park | 0.17% | 0.12%(+0.059)#43 | 0.082%(+0.092)#608 |
| 44. | Accokeek | 0.16% | 0.12%(+0.041)#44 | 0.082%(+0.075)#645 |
| 45. | Rockville | 0.16% | 0.12%(+0.041)#45 | 0.082%(+0.074)#648 |
| 46. | Burtonsville | 0.16% | 0.12%(+0.039)#46 | 0.082%(+0.073)#649 |
| 47. | Arnold | 0.14% | 0.12%(+0.025)#47 | 0.082%(+0.059)#682 |
| 48. | Easton | 0.12% | 0.12%(+0.007)#48 | 0.082%(+0.041)#731 |
| 49. | Chevy Chase | 0.12% | 0.12%(+0.007)#49 | 0.082%(+0.041)#733 |
| 50. | Frederick | 0.12% | 0.12%(+0.002)#50 | 0.082%(+0.035)#745 |
| 51. | Wheaton | 0.11% | 0.12%(-0.008)#51 | 0.082%(+0.026)#786 |
| 52. | Cockeysville | 0.11% | 0.12%(-0.008)#52 | 0.082%(+0.026)#787 |
| 53. | Bel Air South | 0.11% | 0.12%(-0.009)#53 | 0.082%(+0.025)#791 |
| 54. | Dundalk | 0.11% | 0.12%(-0.010)#54 | 0.082%(+0.024)#796 |
| 55. | Calverton | 0.10% | 0.12%(-0.012)#55 | 0.082%(+0.022)#806 |
| 56. | Suitland | 0.085% | 0.12%(-0.030)#56 | 0.082%(+0.003)#875 |
| 57. | Timonium | 0.083% | 0.12%(-0.032)#57 | 0.082%(+0.001)#879 |
| 58. | Clarksburg | 0.081% | 0.12%(-0.034)#58 | 0.082%(-0.001)#887 |
| 59. | Middle River | 0.077% | 0.12%(-0.039)#59 | 0.082%(-0.005)#901 |
| 60. | Bowie | 0.076% | 0.12%(-0.040)#60 | 0.082%(-0.006)#906 |
| 61. | South Laurel | 0.063% | 0.12%(-0.052)#61 | 0.082%(-0.019)#965 |
| 62. | Milford Mill | 0.054% | 0.12%(-0.062)#62 | 0.082%(-0.028)#1,013 |
| 63. | Waldorf | 0.051% | 0.12%(-0.065)#63 | 0.082%(-0.031)#1,027 |
| 64. | Odenton | 0.047% | 0.12%(-0.069)#64 | 0.082%(-0.035)#1,056 |
| 65. | Kemp Mill | 0.035% | 0.12%(-0.080)#65 | 0.082%(-0.047)#1,125 |
| 66. | Towson | 0.035% | 0.12%(-0.081)#66 | 0.082%(-0.047)#1,132 |
| 67. | Fort Washington | 0.031% | 0.12%(-0.085)#67 | 0.082%(-0.051)#1,164 |
| 68. | Severn | 0.027% | 0.12%(-0.089)#68 | 0.082%(-0.055)#1,195 |
| 69. | Aspen Hill | 0.024% | 0.12%(-0.092)#69 | 0.082%(-0.058)#1,207 |
| 70. | Baltimore | 0.019% | 0.12%(-0.097)#70 | 0.082%(-0.063)#1,250 |
Common Questions
What are the Top 10 Cities with the Highest Percentage of Immigrants from Bangladesh in Maryland?
Top 10 Cities with the Highest Percentage of Immigrants from Bangladesh in Maryland are:
#1
2.04%
#2
1.58%
#3
1.44%
#4
1.39%
#5
1.05%
#6
0.94%
#7
0.94%
#8
0.88%
#9
0.85%
#10
0.84%
What city has the Highest Percentage of Immigrants from Bangladesh in Maryland?
Edgemere has the Highest Percentage of Immigrants from Bangladesh in Maryland with 2.04%.
What is the Percentage of Immigrants from Bangladesh in the State of Maryland?
Percentage of Immigrants from Bangladesh in Maryland is 0.12%.
What is the Percentage of Immigrants from Bangladesh in the United States?
Percentage of Immigrants from Bangladesh in the United States is 0.082%.