Cities with the Most Immigrants from Malaysia in Maryland
RELATED REPORTS & OPTIONS
Malaysia
Maryland
Compare Cities
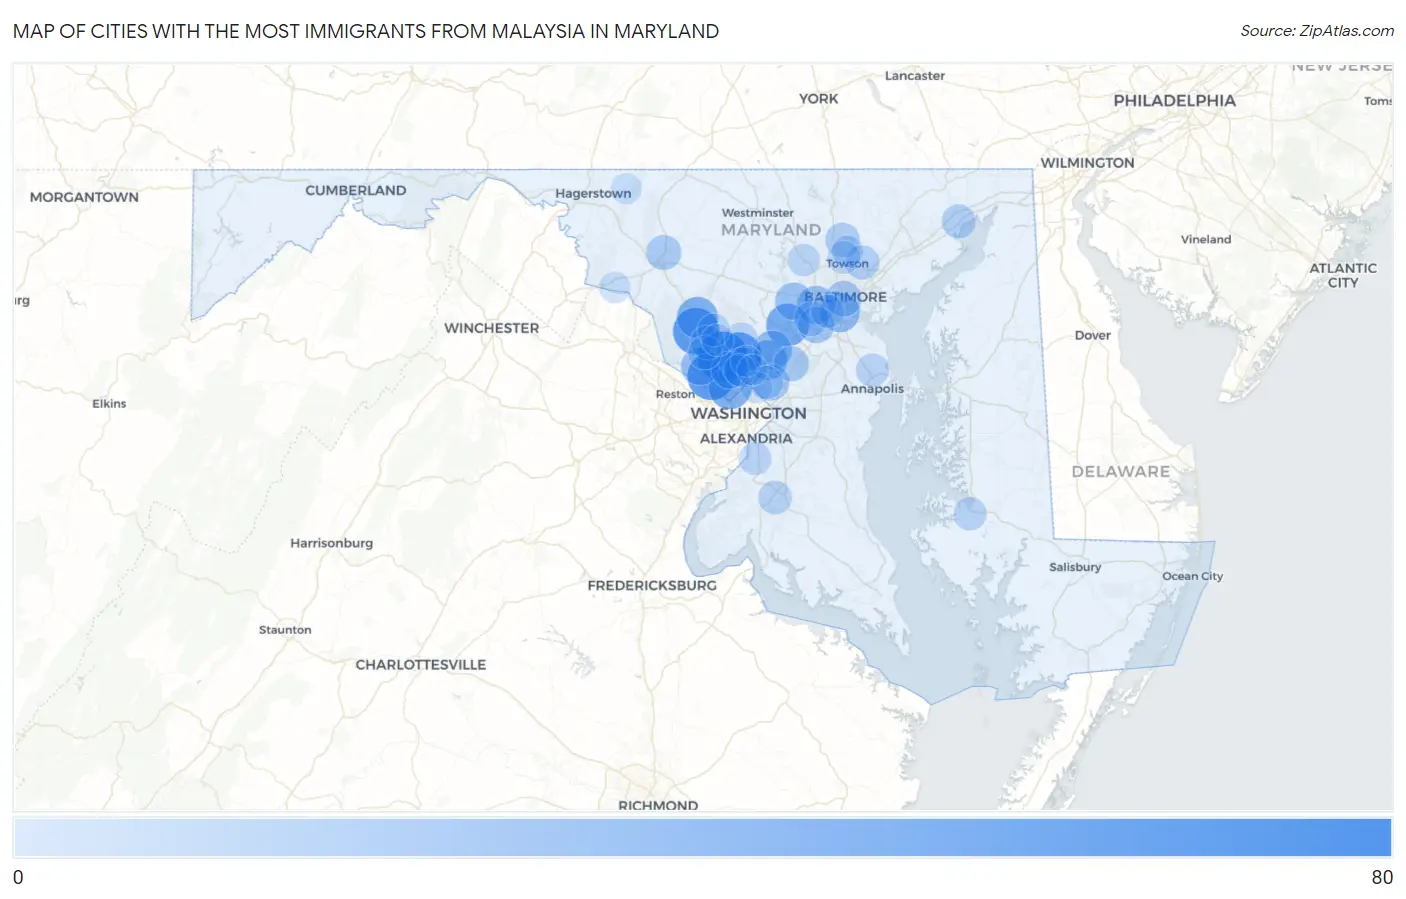
Map of Cities with the Most Immigrants from Malaysia in Maryland
0
80
Cities with the Most Immigrants from Malaysia in Maryland
| City | Malaysia | vs State | vs National | |
| 1. | Rockville | 76 | 1,206(6.30%)#1 | 82,574(0.09%)#182 |
| 2. | Potomac | 68 | 1,206(5.64%)#2 | 82,574(0.08%)#204 |
| 3. | Germantown | 64 | 1,206(5.31%)#3 | 82,574(0.08%)#222 |
| 4. | Aspen Hill | 60 | 1,206(4.98%)#4 | 82,574(0.07%)#245 |
| 5. | Bethesda | 50 | 1,206(4.15%)#5 | 82,574(0.06%)#289 |
| 6. | Columbia | 49 | 1,206(4.06%)#6 | 82,574(0.06%)#294 |
| 7. | Clarksburg | 43 | 1,206(3.57%)#7 | 82,574(0.05%)#331 |
| 8. | Wheaton | 38 | 1,206(3.15%)#8 | 82,574(0.05%)#374 |
| 9. | Woodlawn Cdp Baltimore County | 37 | 1,206(3.07%)#9 | 82,574(0.04%)#380 |
| 10. | Fairland | 36 | 1,206(2.99%)#10 | 82,574(0.04%)#396 |
| 11. | Baltimore Highlands | 36 | 1,206(2.99%)#11 | 82,574(0.04%)#398 |
| 12. | Burtonsville | 33 | 1,206(2.74%)#12 | 82,574(0.04%)#432 |
| 13. | Catonsville | 31 | 1,206(2.57%)#13 | 82,574(0.04%)#457 |
| 14. | Travilah | 30 | 1,206(2.49%)#14 | 82,574(0.04%)#464 |
| 15. | Ellicott City | 28 | 1,206(2.32%)#15 | 82,574(0.03%)#479 |
| 16. | North Bethesda | 28 | 1,206(2.32%)#16 | 82,574(0.03%)#481 |
| 17. | Flower Hill | 25 | 1,206(2.07%)#17 | 82,574(0.03%)#522 |
| 18. | Elkridge | 24 | 1,206(1.99%)#18 | 82,574(0.03%)#537 |
| 19. | College Park | 23 | 1,206(1.91%)#19 | 82,574(0.03%)#550 |
| 20. | Baltimore | 22 | 1,206(1.82%)#20 | 82,574(0.03%)#564 |
| 21. | Frederick | 19 | 1,206(1.58%)#21 | 82,574(0.02%)#615 |
| 22. | South Laurel | 19 | 1,206(1.58%)#22 | 82,574(0.02%)#619 |
| 23. | Ilchester | 17 | 1,206(1.41%)#23 | 82,574(0.02%)#669 |
| 24. | Cockeysville | 17 | 1,206(1.41%)#24 | 82,574(0.02%)#670 |
| 25. | Gaithersburg | 15 | 1,206(1.24%)#25 | 82,574(0.02%)#727 |
| 26. | Carney | 15 | 1,206(1.24%)#26 | 82,574(0.02%)#737 |
| 27. | Havre De Grace | 15 | 1,206(1.24%)#27 | 82,574(0.02%)#742 |
| 28. | North Potomac | 14 | 1,206(1.16%)#28 | 82,574(0.02%)#771 |
| 29. | Waldorf | 13 | 1,206(1.08%)#29 | 82,574(0.02%)#800 |
| 30. | Arnold | 12 | 1,206(1.00%)#30 | 82,574(0.01%)#852 |
| 31. | Arbutus | 12 | 1,206(1.00%)#31 | 82,574(0.01%)#856 |
| 32. | Adelphi | 12 | 1,206(1.00%)#32 | 82,574(0.01%)#861 |
| 33. | Cambridge | 12 | 1,206(1.00%)#33 | 82,574(0.01%)#865 |
| 34. | Olney | 10 | 1,206(0.83%)#34 | 82,574(0.01%)#936 |
| 35. | Montgomery Village | 10 | 1,206(0.83%)#35 | 82,574(0.01%)#937 |
| 36. | Fort Washington | 10 | 1,206(0.83%)#36 | 82,574(0.01%)#943 |
| 37. | Lutherville | 10 | 1,206(0.83%)#37 | 82,574(0.01%)#955 |
| 38. | Owings Mills | 9 | 1,206(0.75%)#38 | 82,574(0.01%)#982 |
| 39. | North Kensington | 7 | 1,206(0.58%)#39 | 82,574(0.01%)#1,084 |
| 40. | Washington Grove | 7 | 1,206(0.58%)#40 | 82,574(0.01%)#1,094 |
| 41. | Takoma Park | 6 | 1,206(0.50%)#41 | 82,574(0.01%)#1,114 |
| 42. | Timonium | 6 | 1,206(0.50%)#42 | 82,574(0.01%)#1,116 |
| 43. | Brunswick | 5 | 1,206(0.41%)#43 | 82,574(0.01%)#1,172 |
| 44. | Glenmont | 4 | 1,206(0.33%)#44 | 82,574(0.00%)#1,201 |
| 45. | Smithsburg | 4 | 1,206(0.33%)#45 | 82,574(0.00%)#1,212 |
| 46. | Kemp Mill | 2 | 1,206(0.17%)#46 | 82,574(0.00%)#1,264 |
Common Questions
What are the Top 10 Cities with the Most Immigrants from Malaysia in Maryland?
Top 10 Cities with the Most Immigrants from Malaysia in Maryland are:
#1
76
#2
68
#3
64
#4
60
#5
50
#6
49
#7
43
#8
38
#9
36
#10
36
What city has the Most Immigrants from Malaysia in Maryland?
Rockville has the Most Immigrants from Malaysia in Maryland with 76.
What is the Total Immigrants from Malaysia in the State of Maryland?
Total Immigrants from Malaysia in Maryland is 1,206.
What is the Total Immigrants from Malaysia in the United States?
Total Immigrants from Malaysia in the United States is 82,574.