Cities with the Most Immigrants from Poland in Maryland
RELATED REPORTS & OPTIONS
Poland
Maryland
Compare Cities
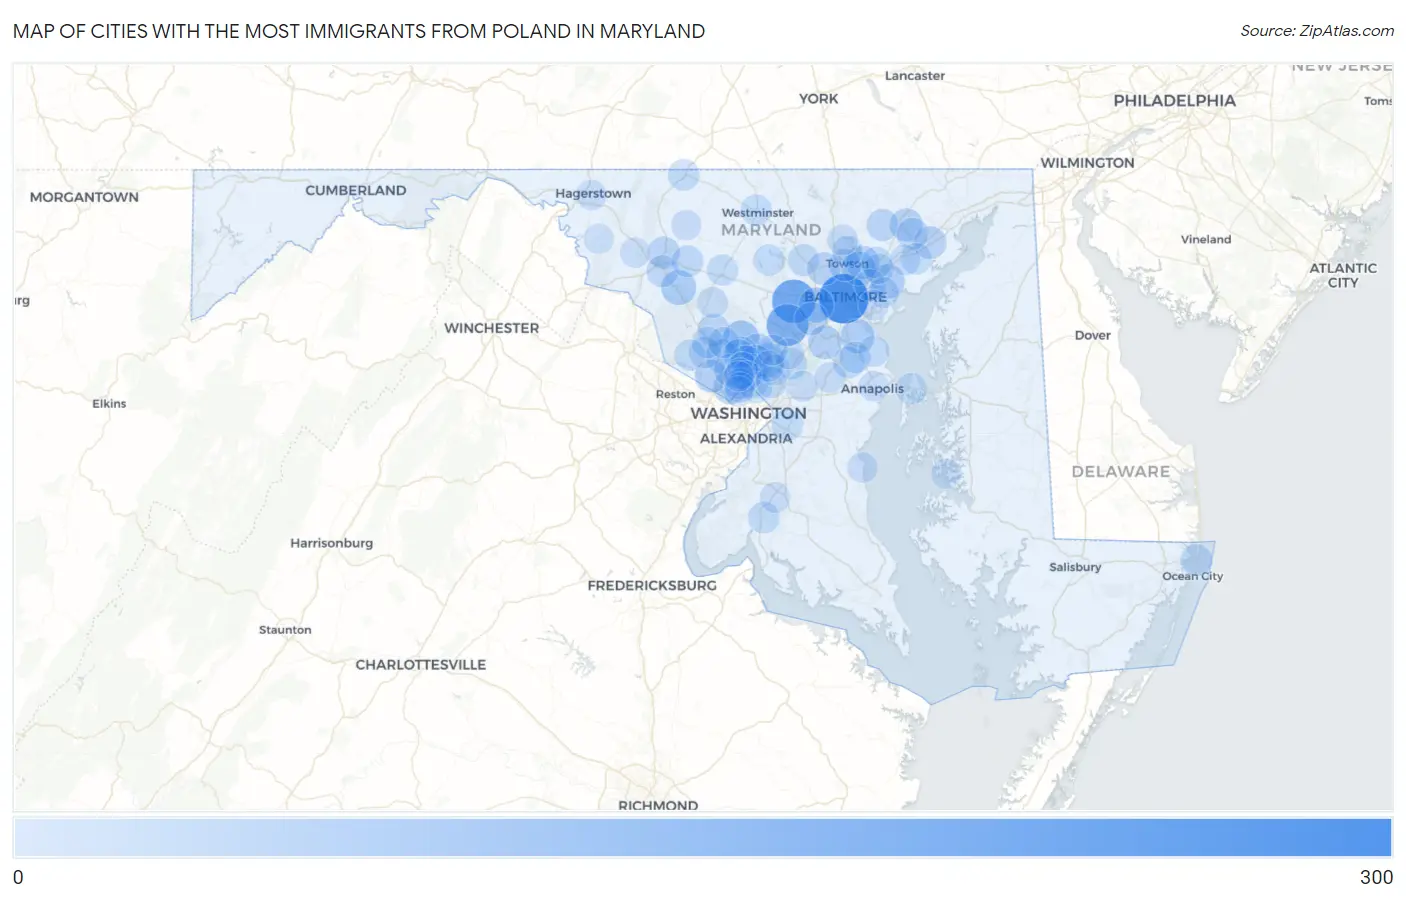
Map of Cities with the Most Immigrants from Poland in Maryland
0
300
Cities with the Most Immigrants from Poland in Maryland
| City | Poland | vs State | vs National | |
| 1. | Baltimore | 296 | 3,418(8.66%)#1 | 408,899(0.07%)#164 |
| 2. | Ellicott City | 200 | 3,418(5.85%)#2 | 408,899(0.05%)#255 |
| 3. | Columbia | 175 | 3,418(5.12%)#3 | 408,899(0.04%)#283 |
| 4. | Olney | 92 | 3,418(2.69%)#4 | 408,899(0.02%)#579 |
| 5. | Catonsville | 73 | 3,418(2.14%)#5 | 408,899(0.02%)#726 |
| 6. | Urbana | 71 | 3,418(2.08%)#6 | 408,899(0.02%)#747 |
| 7. | Middle River | 59 | 3,418(1.73%)#7 | 408,899(0.01%)#848 |
| 8. | Pasadena | 58 | 3,418(1.70%)#8 | 408,899(0.01%)#855 |
| 9. | Fairland | 55 | 3,418(1.61%)#9 | 408,899(0.01%)#895 |
| 10. | Rockville | 54 | 3,418(1.58%)#10 | 408,899(0.01%)#905 |
| 11. | Severn | 51 | 3,418(1.49%)#11 | 408,899(0.01%)#947 |
| 12. | Parkville | 51 | 3,418(1.49%)#12 | 408,899(0.01%)#949 |
| 13. | Bethesda | 50 | 3,418(1.46%)#13 | 408,899(0.01%)#964 |
| 14. | Carney | 48 | 3,418(1.40%)#14 | 408,899(0.01%)#1,006 |
| 15. | Ilchester | 44 | 3,418(1.29%)#15 | 408,899(0.01%)#1,069 |
| 16. | Bel Air | 42 | 3,418(1.23%)#16 | 408,899(0.01%)#1,114 |
| 17. | Potomac | 41 | 3,418(1.20%)#17 | 408,899(0.01%)#1,125 |
| 18. | Pikesville | 41 | 3,418(1.20%)#18 | 408,899(0.01%)#1,129 |
| 19. | Riverside | 40 | 3,418(1.17%)#19 | 408,899(0.01%)#1,159 |
| 20. | Cloverly | 39 | 3,418(1.14%)#20 | 408,899(0.01%)#1,181 |
| 21. | Colesville | 39 | 3,418(1.14%)#21 | 408,899(0.01%)#1,185 |
| 22. | Towson | 32 | 3,418(0.94%)#22 | 408,899(0.01%)#1,340 |
| 23. | North Bethesda | 32 | 3,418(0.94%)#23 | 408,899(0.01%)#1,341 |
| 24. | Frederick | 31 | 3,418(0.91%)#24 | 408,899(0.01%)#1,365 |
| 25. | Montgomery Village | 30 | 3,418(0.88%)#25 | 408,899(0.01%)#1,407 |
| 26. | Fallston | 28 | 3,418(0.82%)#26 | 408,899(0.01%)#1,475 |
| 27. | Leisure World | 27 | 3,418(0.79%)#27 | 408,899(0.01%)#1,509 |
| 28. | Silver Spring | 26 | 3,418(0.76%)#28 | 408,899(0.01%)#1,524 |
| 29. | North Potomac | 26 | 3,418(0.76%)#29 | 408,899(0.01%)#1,532 |
| 30. | Ballenger Creek | 26 | 3,418(0.76%)#30 | 408,899(0.01%)#1,533 |
| 31. | Arden On The Severn | 26 | 3,418(0.76%)#31 | 408,899(0.01%)#1,560 |
| 32. | Bel Air South | 25 | 3,418(0.73%)#32 | 408,899(0.01%)#1,570 |
| 33. | Kemp Mill | 25 | 3,418(0.73%)#33 | 408,899(0.01%)#1,585 |
| 34. | Linganore | 25 | 3,418(0.73%)#34 | 408,899(0.01%)#1,588 |
| 35. | Ocean City | 23 | 3,418(0.67%)#35 | 408,899(0.01%)#1,670 |
| 36. | Owings Mills | 22 | 3,418(0.64%)#36 | 408,899(0.01%)#1,697 |
| 37. | Severna Park | 21 | 3,418(0.61%)#37 | 408,899(0.01%)#1,750 |
| 38. | Perry Hall | 21 | 3,418(0.61%)#38 | 408,899(0.01%)#1,754 |
| 39. | La Plata | 21 | 3,418(0.61%)#39 | 408,899(0.01%)#1,768 |
| 40. | Emmitsburg | 21 | 3,418(0.61%)#40 | 408,899(0.01%)#1,783 |
| 41. | Gaithersburg | 19 | 3,418(0.56%)#41 | 408,899(0.00%)#1,836 |
| 42. | Aspen Hill | 19 | 3,418(0.56%)#42 | 408,899(0.00%)#1,839 |
| 43. | Glenmont | 19 | 3,418(0.56%)#43 | 408,899(0.00%)#1,860 |
| 44. | South Laurel | 18 | 3,418(0.53%)#44 | 408,899(0.00%)#1,905 |
| 45. | Rosedale | 18 | 3,418(0.53%)#45 | 408,899(0.00%)#1,911 |
| 46. | Eldersburg | 17 | 3,418(0.50%)#46 | 408,899(0.00%)#1,955 |
| 47. | Edgewood | 17 | 3,418(0.50%)#47 | 408,899(0.00%)#1,960 |
| 48. | Takoma Park | 17 | 3,418(0.50%)#48 | 408,899(0.00%)#1,971 |
| 49. | College Park | 16 | 3,418(0.47%)#49 | 408,899(0.00%)#2,018 |
| 50. | Westminster | 16 | 3,418(0.47%)#50 | 408,899(0.00%)#2,023 |
| 51. | Forestville | 16 | 3,418(0.47%)#51 | 408,899(0.00%)#2,040 |
| 52. | Stevensville | 16 | 3,418(0.47%)#52 | 408,899(0.00%)#2,043 |
| 53. | Darnestown | 16 | 3,418(0.47%)#53 | 408,899(0.00%)#2,049 |
| 54. | Lake Shore | 15 | 3,418(0.44%)#54 | 408,899(0.00%)#2,103 |
| 55. | Redland | 15 | 3,418(0.44%)#55 | 408,899(0.00%)#2,104 |
| 56. | Mount Airy | 15 | 3,418(0.44%)#56 | 408,899(0.00%)#2,113 |
| 57. | Beltsville | 12 | 3,418(0.35%)#57 | 408,899(0.00%)#2,280 |
| 58. | Wheaton | 11 | 3,418(0.32%)#58 | 408,899(0.00%)#2,332 |
| 59. | Essex | 11 | 3,418(0.32%)#59 | 408,899(0.00%)#2,337 |
| 60. | Joppatowne | 11 | 3,418(0.32%)#60 | 408,899(0.00%)#2,361 |
| 61. | Chevy Chase | 11 | 3,418(0.32%)#61 | 408,899(0.00%)#2,369 |
| 62. | Crofton | 10 | 3,418(0.29%)#62 | 408,899(0.00%)#2,434 |
| 63. | Calverton | 10 | 3,418(0.29%)#63 | 408,899(0.00%)#2,445 |
| 64. | Damascus | 10 | 3,418(0.29%)#64 | 408,899(0.00%)#2,446 |
| 65. | Glenn Dale | 10 | 3,418(0.29%)#65 | 408,899(0.00%)#2,450 |
| 66. | Timonium | 10 | 3,418(0.29%)#66 | 408,899(0.00%)#2,461 |
| 67. | Laurel | 9 | 3,418(0.26%)#67 | 408,899(0.00%)#2,525 |
| 68. | Burtonsville | 9 | 3,418(0.26%)#68 | 408,899(0.00%)#2,558 |
| 69. | Forest Glen | 9 | 3,418(0.26%)#69 | 408,899(0.00%)#2,575 |
| 70. | Cockeysville | 8 | 3,418(0.23%)#70 | 408,899(0.00%)#2,640 |
| 71. | Abingdon | 8 | 3,418(0.23%)#71 | 408,899(0.00%)#2,669 |
| 72. | Waldorf | 6 | 3,418(0.18%)#72 | 408,899(0.00%)#2,800 |
| 73. | Dundalk | 6 | 3,418(0.18%)#73 | 408,899(0.00%)#2,802 |
| 74. | Hagerstown | 5 | 3,418(0.15%)#74 | 408,899(0.00%)#2,883 |
| 75. | Green Valley | 5 | 3,418(0.15%)#75 | 408,899(0.00%)#2,909 |
| 76. | Kensington | 5 | 3,418(0.15%)#76 | 408,899(0.00%)#2,951 |
| 77. | Naval Academy | 4 | 3,418(0.12%)#77 | 408,899(0.00%)#3,024 |
| 78. | Chevy Chase Village | 4 | 3,418(0.12%)#78 | 408,899(0.00%)#3,026 |
| 79. | Woodsboro | 4 | 3,418(0.12%)#79 | 408,899(0.00%)#3,043 |
| 80. | Chevy Chase Section Three | 4 | 3,418(0.12%)#80 | 408,899(0.00%)#3,048 |
| 81. | White Marsh | 3 | 3,418(0.09%)#81 | 408,899(0.00%)#3,084 |
| 82. | Middletown | 3 | 3,418(0.09%)#82 | 408,899(0.00%)#3,088 |
| 83. | North Beach | 3 | 3,418(0.09%)#83 | 408,899(0.00%)#3,091 |
| 84. | South Kensington | 2 | 3,418(0.06%)#84 | 408,899(0.00%)#3,151 |
| 85. | Keedysville | 2 | 3,418(0.06%)#85 | 408,899(0.00%)#3,174 |
| 86. | Oxford | 2 | 3,418(0.06%)#86 | 408,899(0.00%)#3,182 |
Common Questions
What are the Top 10 Cities with the Most Immigrants from Poland in Maryland?
Top 10 Cities with the Most Immigrants from Poland in Maryland are:
#1
296
#2
200
#3
175
#4
92
#5
73
#6
71
#7
59
#8
58
#9
55
#10
54
What city has the Most Immigrants from Poland in Maryland?
Baltimore has the Most Immigrants from Poland in Maryland with 296.
What is the Total Immigrants from Poland in the State of Maryland?
Total Immigrants from Poland in Maryland is 3,418.
What is the Total Immigrants from Poland in the United States?
Total Immigrants from Poland in the United States is 408,899.