Cities with the Highest Percentage of Immigrants from China in Maryland
RELATED REPORTS & OPTIONS
China
Maryland
Compare Cities
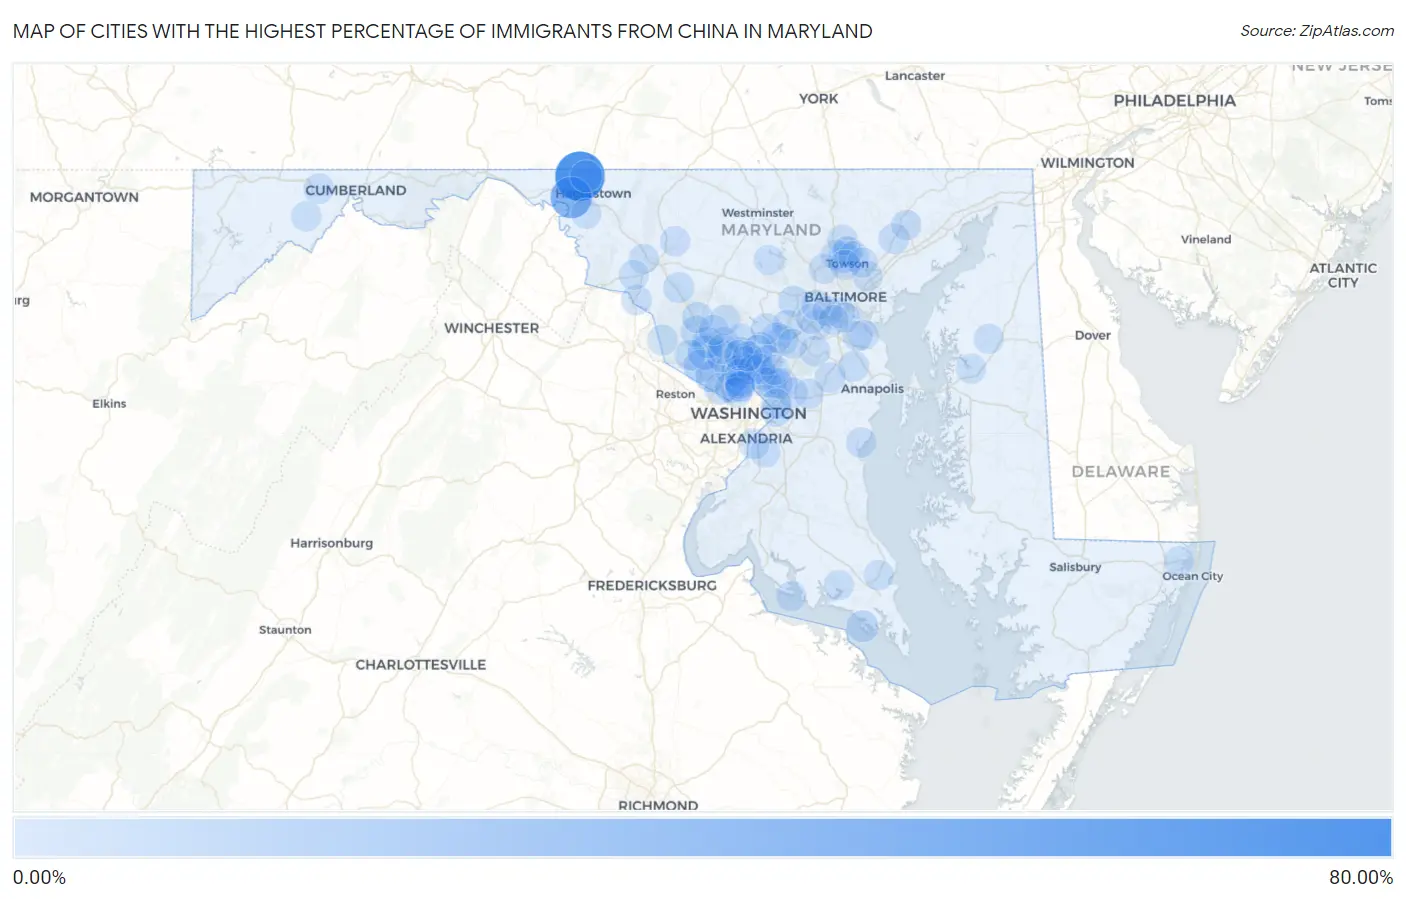
Map of Cities with the Highest Percentage of Immigrants from China in Maryland
0.00%
80.00%
Cities with the Highest Percentage of Immigrants from China in Maryland
| City | China | vs State | vs National | |
| 1. | Cearfoss | 70.75% | 0.93%(+69.8)#1 | 0.85%(+69.9)#2 |
| 2. | Kemps Mill | 40.74% | 0.93%(+39.8)#2 | 0.85%(+39.9)#3 |
| 3. | North Potomac | 14.32% | 0.93%(+13.4)#3 | 0.85%(+13.5)#34 |
| 4. | Travilah | 10.01% | 0.93%(+9.08)#4 | 0.85%(+9.16)#73 |
| 5. | Maugansville | 7.51% | 0.93%(+6.58)#5 | 0.85%(+6.65)#130 |
| 6. | Potomac | 6.53% | 0.93%(+5.60)#6 | 0.85%(+5.67)#170 |
| 7. | Rockville | 6.29% | 0.93%(+5.36)#7 | 0.85%(+5.44)#181 |
| 8. | Tall Timbers | 6.25% | 0.93%(+5.32)#8 | 0.85%(+5.40)#184 |
| 9. | Cabin John | 6.15% | 0.93%(+5.22)#9 | 0.85%(+5.29)#189 |
| 10. | Lutherville | 4.85% | 0.93%(+3.92)#10 | 0.85%(+4.00)#265 |
| 11. | Germantown | 4.70% | 0.93%(+3.76)#11 | 0.85%(+3.84)#285 |
| 12. | Gaithersburg | 4.67% | 0.93%(+3.73)#12 | 0.85%(+3.81)#286 |
| 13. | Clarksburg | 4.10% | 0.93%(+3.17)#13 | 0.85%(+3.25)#351 |
| 14. | Ellicott City | 3.98% | 0.93%(+3.05)#14 | 0.85%(+3.12)#365 |
| 15. | Scaggsville | 3.72% | 0.93%(+2.79)#15 | 0.85%(+2.87)#403 |
| 16. | Urbana | 3.72% | 0.93%(+2.79)#16 | 0.85%(+2.86)#404 |
| 17. | Highland | 3.56% | 0.93%(+2.63)#17 | 0.85%(+2.71)#428 |
| 18. | Spencerville | 3.45% | 0.93%(+2.51)#18 | 0.85%(+2.59)#445 |
| 19. | Redland | 3.35% | 0.93%(+2.42)#19 | 0.85%(+2.50)#463 |
| 20. | Darnestown | 3.30% | 0.93%(+2.37)#20 | 0.85%(+2.44)#475 |
| 21. | Fairmount Heights | 3.02% | 0.93%(+2.09)#21 | 0.85%(+2.17)#532 |
| 22. | Poolesville | 2.87% | 0.93%(+1.94)#22 | 0.85%(+2.01)#570 |
| 23. | Elkridge | 2.81% | 0.93%(+1.88)#23 | 0.85%(+1.96)#594 |
| 24. | College Park | 2.76% | 0.93%(+1.83)#24 | 0.85%(+1.91)#606 |
| 25. | Brown Station | 2.60% | 0.93%(+1.67)#25 | 0.85%(+1.75)#641 |
| 26. | Herald Harbor | 2.60% | 0.93%(+1.67)#26 | 0.85%(+1.75)#642 |
| 27. | Greenbelt | 2.58% | 0.93%(+1.65)#27 | 0.85%(+1.73)#649 |
| 28. | National Harbor | 2.55% | 0.93%(+1.62)#28 | 0.85%(+1.70)#654 |
| 29. | North Bethesda | 2.52% | 0.93%(+1.59)#29 | 0.85%(+1.67)#665 |
| 30. | Leisure World | 2.51% | 0.93%(+1.58)#30 | 0.85%(+1.65)#669 |
| 31. | Columbia | 2.49% | 0.93%(+1.56)#31 | 0.85%(+1.63)#676 |
| 32. | Point Of Rocks | 2.25% | 0.93%(+1.31)#32 | 0.85%(+1.39)#755 |
| 33. | Pleasant Hills | 2.24% | 0.93%(+1.31)#33 | 0.85%(+1.39)#757 |
| 34. | Garrett Park | 2.21% | 0.93%(+1.27)#34 | 0.85%(+1.35)#768 |
| 35. | Derwood | 2.16% | 0.93%(+1.23)#35 | 0.85%(+1.31)#791 |
| 36. | Mays Chapel | 2.06% | 0.93%(+1.13)#36 | 0.85%(+1.21)#829 |
| 37. | Bethesda | 2.05% | 0.93%(+1.12)#37 | 0.85%(+1.20)#839 |
| 38. | Hillandale | 1.96% | 0.93%(+1.03)#38 | 0.85%(+1.10)#893 |
| 39. | Olney | 1.93% | 0.93%(+0.997)#39 | 0.85%(+1.07)#911 |
| 40. | Frostburg | 1.92% | 0.93%(+0.993)#40 | 0.85%(+1.07)#915 |
| 41. | Flower Hill | 1.83% | 0.93%(+0.900)#41 | 0.85%(+0.977)#962 |
| 42. | Fort Meade | 1.80% | 0.93%(+0.867)#42 | 0.85%(+0.944)#982 |
| 43. | Bel Air | 1.79% | 0.93%(+0.856)#43 | 0.85%(+0.933)#994 |
| 44. | Crofton | 1.77% | 0.93%(+0.843)#44 | 0.85%(+0.920)#1,000 |
| 45. | Colesville | 1.71% | 0.93%(+0.776)#45 | 0.85%(+0.853)#1,043 |
| 46. | Cockeysville | 1.64% | 0.93%(+0.712)#46 | 0.85%(+0.789)#1,094 |
| 47. | Glenmont | 1.61% | 0.93%(+0.674)#47 | 0.85%(+0.751)#1,113 |
| 48. | Timonium | 1.52% | 0.93%(+0.588)#48 | 0.85%(+0.665)#1,181 |
| 49. | Laytonsville | 1.49% | 0.93%(+0.563)#49 | 0.85%(+0.640)#1,204 |
| 50. | Fulton | 1.47% | 0.93%(+0.541)#50 | 0.85%(+0.618)#1,224 |
| 51. | Cobb Island | 1.46% | 0.93%(+0.533)#51 | 0.85%(+0.609)#1,234 |
| 52. | Lonaconing | 1.40% | 0.93%(+0.469)#52 | 0.85%(+0.546)#1,285 |
| 53. | Wheaton | 1.37% | 0.93%(+0.443)#53 | 0.85%(+0.519)#1,312 |
| 54. | Chevy Chase Section Three | 1.36% | 0.93%(+0.433)#54 | 0.85%(+0.510)#1,321 |
| 55. | Berwyn Heights | 1.33% | 0.93%(+0.397)#55 | 0.85%(+0.474)#1,356 |
| 56. | Riviera Beach | 1.33% | 0.93%(+0.397)#56 | 0.85%(+0.474)#1,357 |
| 57. | Cloverly | 1.31% | 0.93%(+0.383)#57 | 0.85%(+0.460)#1,374 |
| 58. | Romancoke | 1.31% | 0.93%(+0.375)#58 | 0.85%(+0.452)#1,387 |
| 59. | Baltimore Highlands | 1.31% | 0.93%(+0.375)#59 | 0.85%(+0.452)#1,388 |
| 60. | Solomons | 1.29% | 0.93%(+0.362)#60 | 0.85%(+0.439)#1,410 |
| 61. | Lanham | 1.27% | 0.93%(+0.338)#61 | 0.85%(+0.415)#1,438 |
| 62. | Fairwood | 1.27% | 0.93%(+0.336)#62 | 0.85%(+0.413)#1,439 |
| 63. | Kensington | 1.20% | 0.93%(+0.274)#63 | 0.85%(+0.350)#1,509 |
| 64. | Honeygo | 1.18% | 0.93%(+0.248)#64 | 0.85%(+0.324)#1,542 |
| 65. | North Chevy Chase | 1.17% | 0.93%(+0.244)#65 | 0.85%(+0.320)#1,551 |
| 66. | Ilchester | 1.12% | 0.93%(+0.193)#66 | 0.85%(+0.270)#1,604 |
| 67. | Kemp Mill | 1.11% | 0.93%(+0.182)#67 | 0.85%(+0.259)#1,620 |
| 68. | Friendship Heights Village | 1.11% | 0.93%(+0.181)#68 | 0.85%(+0.258)#1,621 |
| 69. | Ocean Pines | 1.08% | 0.93%(+0.149)#69 | 0.85%(+0.226)#1,665 |
| 70. | Chevy Chase | 1.06% | 0.93%(+0.131)#70 | 0.85%(+0.208)#1,695 |
| 71. | Aspen Hill | 1.06% | 0.93%(+0.127)#71 | 0.85%(+0.203)#1,702 |
| 72. | Catonsville | 1.05% | 0.93%(+0.114)#72 | 0.85%(+0.191)#1,721 |
| 73. | Hampton | 1.02% | 0.93%(+0.092)#73 | 0.85%(+0.169)#1,750 |
| 74. | Walkersville | 1.01% | 0.93%(+0.079)#74 | 0.85%(+0.155)#1,776 |
| 75. | Pikesville | 1.00% | 0.93%(+0.066)#75 | 0.85%(+0.143)#1,800 |
| 76. | Overlea | 0.99% | 0.93%(+0.061)#76 | 0.85%(+0.138)#1,808 |
| 77. | Church Hill | 0.92% | 0.93%(-0.009)#77 | 0.85%(+0.068)#1,929 |
| 78. | Arbutus | 0.92% | 0.93%(-0.012)#78 | 0.85%(+0.064)#1,941 |
| 79. | Towson | 0.90% | 0.93%(-0.034)#79 | 0.85%(+0.043)#1,968 |
| 80. | Adelphi | 0.89% | 0.93%(-0.046)#80 | 0.85%(+0.031)#1,989 |
| 81. | North Laurel | 0.88% | 0.93%(-0.051)#81 | 0.85%(+0.026)#1,996 |
| 82. | White Oak | 0.88% | 0.93%(-0.053)#82 | 0.85%(+0.024)#2,004 |
| 83. | Fairland | 0.87% | 0.93%(-0.058)#83 | 0.85%(+0.019)#2,009 |
| 84. | Beltsville | 0.87% | 0.93%(-0.063)#84 | 0.85%(+0.013)#2,024 |
| 85. | Braddock Heights | 0.81% | 0.93%(-0.126)#85 | 0.85%(-0.049)#2,149 |
| 86. | Jefferson | 0.80% | 0.93%(-0.129)#86 | 0.85%(-0.052)#2,158 |
| 87. | Centreville | 0.79% | 0.93%(-0.144)#87 | 0.85%(-0.067)#2,193 |
| 88. | Brooklyn Park | 0.78% | 0.93%(-0.151)#88 | 0.85%(-0.075)#2,210 |
| 89. | Layhill | 0.78% | 0.93%(-0.156)#89 | 0.85%(-0.079)#2,218 |
| 90. | Pasadena | 0.77% | 0.93%(-0.163)#90 | 0.85%(-0.086)#2,238 |
| 91. | Carney | 0.76% | 0.93%(-0.171)#91 | 0.85%(-0.095)#2,261 |
| 92. | Chevy Chase Section Five | 0.75% | 0.93%(-0.177)#92 | 0.85%(-0.101)#2,281 |
| 93. | Montgomery Village | 0.75% | 0.93%(-0.186)#93 | 0.85%(-0.109)#2,295 |
| 94. | Deale | 0.74% | 0.93%(-0.188)#94 | 0.85%(-0.111)#2,299 |
| 95. | Cheverly | 0.73% | 0.93%(-0.197)#95 | 0.85%(-0.121)#2,323 |
| 96. | St James | 0.73% | 0.93%(-0.201)#96 | 0.85%(-0.124)#2,333 |
| 97. | Leonardtown | 0.70% | 0.93%(-0.233)#97 | 0.85%(-0.157)#2,417 |
| 98. | Eldersburg | 0.69% | 0.93%(-0.243)#98 | 0.85%(-0.166)#2,438 |
| 99. | Linthicum | 0.66% | 0.93%(-0.270)#99 | 0.85%(-0.193)#2,504 |
| 100. | Friendly | 0.66% | 0.93%(-0.273)#100 | 0.85%(-0.196)#2,517 |
Common Questions
What are the Top 10 Cities with the Highest Percentage of Immigrants from China in Maryland?
Top 10 Cities with the Highest Percentage of Immigrants from China in Maryland are:
#1
70.75%
#2
40.74%
#3
14.32%
#4
10.01%
#5
7.51%
#6
6.53%
#7
6.29%
#8
6.25%
#9
6.15%
#10
4.85%
What city has the Highest Percentage of Immigrants from China in Maryland?
Cearfoss has the Highest Percentage of Immigrants from China in Maryland with 70.75%.
What is the Percentage of Immigrants from China in the State of Maryland?
Percentage of Immigrants from China in Maryland is 0.93%.
What is the Percentage of Immigrants from China in the United States?
Percentage of Immigrants from China in the United States is 0.85%.