Cities with the Highest Percentage of Immigrants from South Africa in Maryland
RELATED REPORTS & OPTIONS
South Africa
Maryland
Compare Cities
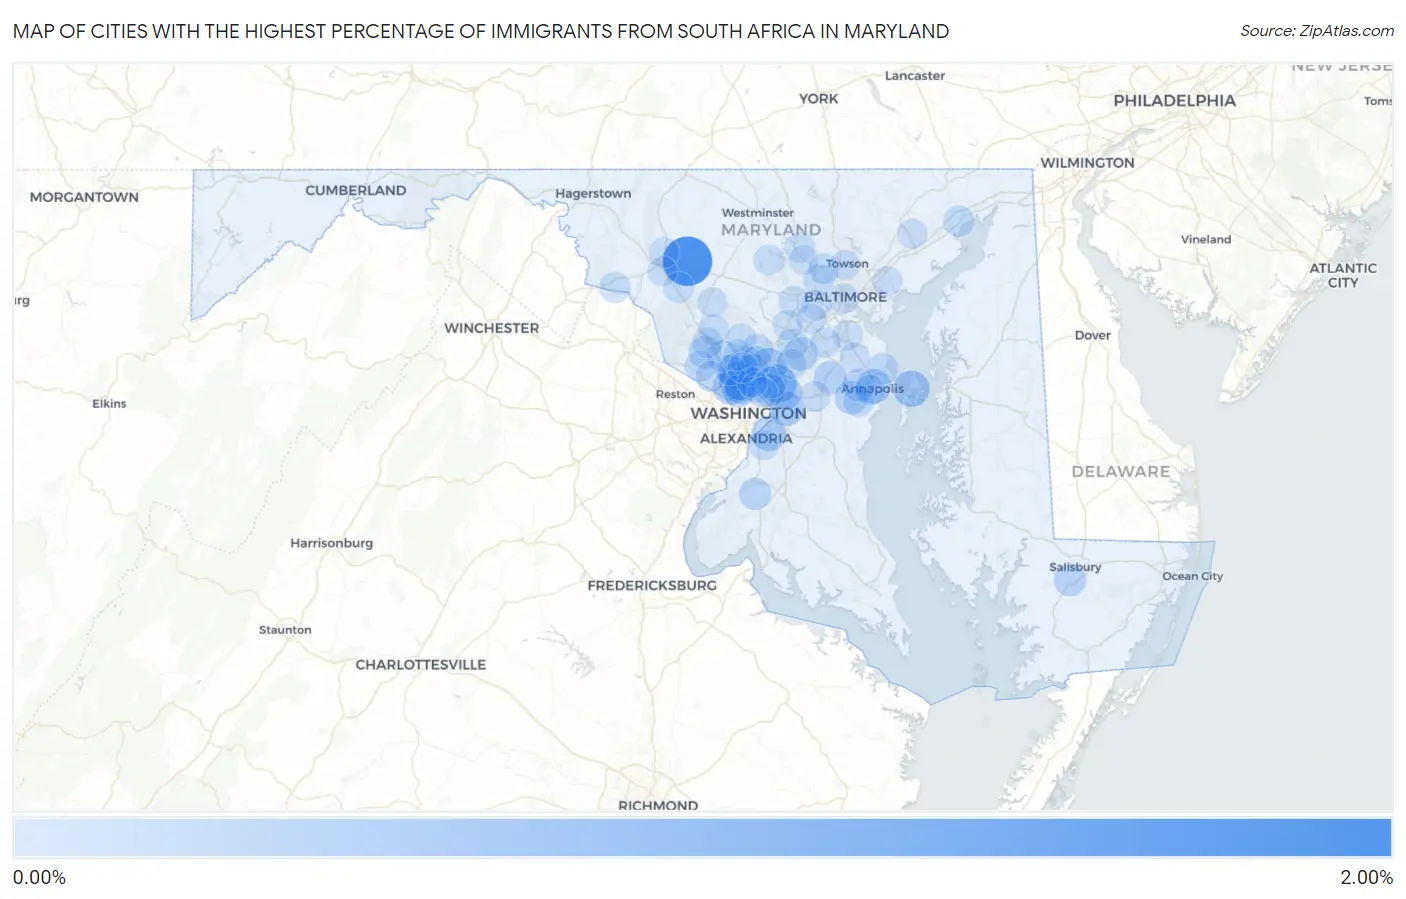
Map of Cities with the Highest Percentage of Immigrants from South Africa in Maryland
0.00%
2.00%
Cities with the Highest Percentage of Immigrants from South Africa in Maryland
| City | South Africa | vs State | vs National | |
| 1. | Linganore | 1.94% | 0.052%(+1.89)#-1 | 0.035%(+1.90)#0 |
| 2. | North Chevy Chase | 1.03% | 0.052%(+0.976)#0 | 0.035%(+0.993)#1 |
| 3. | Woodlawn Cdp Prince George S County | 0.88% | 0.052%(+0.826)#1 | 0.035%(+0.843)#2 |
| 4. | Berwyn Heights | 0.79% | 0.052%(+0.733)#2 | 0.035%(+0.750)#3 |
| 5. | Calverton | 0.64% | 0.052%(+0.592)#3 | 0.035%(+0.609)#4 |
| 6. | Stevensville | 0.61% | 0.052%(+0.561)#4 | 0.035%(+0.577)#5 |
| 7. | Garrett Park | 0.61% | 0.052%(+0.561)#5 | 0.035%(+0.577)#6 |
| 8. | Marlow Heights | 0.46% | 0.052%(+0.412)#6 | 0.035%(+0.428)#7 |
| 9. | Naval Academy | 0.45% | 0.052%(+0.394)#7 | 0.035%(+0.411)#8 |
| 10. | Summerfield | 0.45% | 0.052%(+0.393)#8 | 0.035%(+0.410)#9 |
| 11. | New Carrollton | 0.42% | 0.052%(+0.368)#9 | 0.035%(+0.384)#147 |
| 12. | Bethesda | 0.40% | 0.052%(+0.345)#10 | 0.035%(+0.361)#148 |
| 13. | University Park | 0.34% | 0.052%(+0.293)#11 | 0.035%(+0.309)#149 |
| 14. | Maryland City | 0.34% | 0.052%(+0.286)#12 | 0.035%(+0.303)#150 |
| 15. | Riva | 0.33% | 0.052%(+0.282)#13 | 0.035%(+0.299)#151 |
| 16. | Martin S Additions | 0.30% | 0.052%(+0.250)#14 | 0.035%(+0.267)#152 |
| 17. | North Potomac | 0.29% | 0.052%(+0.240)#15 | 0.035%(+0.256)#153 |
| 18. | Crofton | 0.29% | 0.052%(+0.238)#16 | 0.035%(+0.254)#154 |
| 19. | Parole | 0.28% | 0.052%(+0.223)#17 | 0.035%(+0.240)#155 |
| 20. | Chevy Chase | 0.27% | 0.052%(+0.214)#18 | 0.035%(+0.230)#183 |
| 21. | Fruitland | 0.25% | 0.052%(+0.198)#19 | 0.035%(+0.215)#184 |
| 22. | Chevy Chase Village | 0.21% | 0.052%(+0.160)#20 | 0.035%(+0.177)#185 |
| 23. | Bensville | 0.21% | 0.052%(+0.159)#21 | 0.035%(+0.176)#186 |
| 24. | Cloverly | 0.18% | 0.052%(+0.124)#22 | 0.035%(+0.141)#187 |
| 25. | Kemp Mill | 0.17% | 0.052%(+0.118)#23 | 0.035%(+0.135)#188 |
| 26. | College Park | 0.16% | 0.052%(+0.105)#24 | 0.035%(+0.122)#190 |
| 27. | Cape St Claire | 0.15% | 0.052%(+0.100)#25 | 0.035%(+0.117)#191 |
| 28. | Rockville | 0.15% | 0.052%(+0.097)#26 | 0.035%(+0.114)#485 |
| 29. | Brunswick | 0.12% | 0.052%(+0.064)#27 | 0.035%(+0.080)#486 |
| 30. | Havre De Grace | 0.12% | 0.052%(+0.063)#28 | 0.035%(+0.080)#487 |
| 31. | Edgewater | 0.11% | 0.052%(+0.060)#29 | 0.035%(+0.077)#488 |
| 32. | Lochearn | 0.11% | 0.052%(+0.059)#30 | 0.035%(+0.075)#489 |
| 33. | Glenmont | 0.11% | 0.052%(+0.056)#31 | 0.035%(+0.073)#490 |
| 34. | North Laurel | 0.098% | 0.052%(+0.046)#32 | 0.035%(+0.063)#491 |
| 35. | Pikesville | 0.094% | 0.052%(+0.042)#33 | 0.035%(+0.058)#492 |
| 36. | Aspen Hill | 0.092% | 0.052%(+0.040)#34 | 0.035%(+0.057)#493 |
| 37. | Montgomery Village | 0.092% | 0.052%(+0.040)#35 | 0.035%(+0.057)#494 |
| 38. | Travilah | 0.083% | 0.052%(+0.031)#36 | 0.035%(+0.048)#495 |
| 39. | Urbana | 0.082% | 0.052%(+0.030)#37 | 0.035%(+0.047)#496 |
| 40. | Ellicott City | 0.080% | 0.052%(+0.028)#38 | 0.035%(+0.045)#497 |
| 41. | Potomac | 0.080% | 0.052%(+0.028)#39 | 0.035%(+0.044)#498 |
| 42. | Gaithersburg | 0.075% | 0.052%(+0.023)#40 | 0.035%(+0.040)#499 |
| 43. | Frederick | 0.074% | 0.052%(+0.022)#41 | 0.035%(+0.039)#500 |
| 44. | Olney | 0.073% | 0.052%(+0.021)#42 | 0.035%(+0.038)#501 |
| 45. | Bowie | 0.071% | 0.052%(+0.019)#43 | 0.035%(+0.035)#502 |
| 46. | Reisterstown | 0.069% | 0.052%(+0.017)#44 | 0.035%(+0.033)#503 |
| 47. | Colesville | 0.066% | 0.052%(+0.014)#45 | 0.035%(+0.030)#504 |
| 48. | Glen Burnie | 0.056% | 0.052%(+0.004)#46 | 0.035%(+0.021)#505 |
| 49. | Eldersburg | 0.056% | 0.052%(+0.004)#47 | 0.035%(+0.021)#506 |
| 50. | Severn | 0.055% | 0.052%(+0.003)#48 | 0.035%(+0.020)#507 |
| 51. | Annapolis | 0.054% | 0.052%(+0.002)#49 | 0.035%(+0.019)#508 |
| 52. | Baltimore | 0.048% | 0.052%(-0.004)#50 | 0.035%(+0.013)#509 |
| 53. | Takoma Park | 0.046% | 0.052%(-0.006)#51 | 0.035%(+0.010)#510 |
| 54. | Catonsville | 0.044% | 0.052%(-0.008)#52 | 0.035%(+0.009)#511 |
| 55. | North Bethesda | 0.044% | 0.052%(-0.008)#53 | 0.035%(+0.009)#512 |
| 56. | Ilchester | 0.044% | 0.052%(-0.008)#54 | 0.035%(+0.009)#513 |
| 57. | Severna Park | 0.042% | 0.052%(-0.010)#55 | 0.035%(+0.007)#514 |
| 58. | Middle River | 0.042% | 0.052%(-0.010)#56 | 0.035%(+0.006)#515 |
| 59. | South Laurel | 0.035% | 0.052%(-0.017)#57 | 0.035%(-0.000)#516 |
| 60. | Columbia | 0.035% | 0.052%(-0.017)#58 | 0.035%(-0.001)#517 |
| 61. | Oxon Hill | 0.032% | 0.052%(-0.020)#59 | 0.035%(-0.003)#518 |
| 62. | Bel Air South | 0.030% | 0.052%(-0.022)#60 | 0.035%(-0.006)#519 |
| 63. | Damascus | 0.030% | 0.052%(-0.022)#61 | 0.035%(-0.006)#520 |
| 64. | Ballenger Creek | 0.021% | 0.052%(-0.031)#62 | 0.035%(-0.015)#521 |
| 65. | Towson | 0.017% | 0.052%(-0.035)#63 | 0.035%(-0.018)#522 |
| 66. | Chillum | 0.017% | 0.052%(-0.035)#64 | 0.035%(-0.019)#523 |
| 67. | Silver Spring | 0.013% | 0.052%(-0.039)#65 | 0.035%(-0.022)#524 |
| 68. | Owings Mills | 0.0086% | 0.052%(-0.043)#66 | 0.035%(-0.027)#525 |
| 69. | Wheaton | 0.0076% | 0.052%(-0.044)#67 | 0.035%(-0.028)#526 |
Common Questions
What are the Top 10 Cities with the Highest Percentage of Immigrants from South Africa in Maryland?
Top 10 Cities with the Highest Percentage of Immigrants from South Africa in Maryland are:
#1
1.94%
#2
1.03%
#3
0.79%
#4
0.64%
#5
0.61%
#6
0.61%
#7
0.46%
#8
0.45%
#9
0.45%
#10
0.42%
What city has the Highest Percentage of Immigrants from South Africa in Maryland?
Linganore has the Highest Percentage of Immigrants from South Africa in Maryland with 1.94%.
What is the Percentage of Immigrants from South Africa in the State of Maryland?
Percentage of Immigrants from South Africa in Maryland is 0.052%.
What is the Percentage of Immigrants from South Africa in the United States?
Percentage of Immigrants from South Africa in the United States is 0.035%.