Cities with the Most Immigrants from Argentina in Maryland
RELATED REPORTS & OPTIONS
Argentina
Maryland
Compare Cities
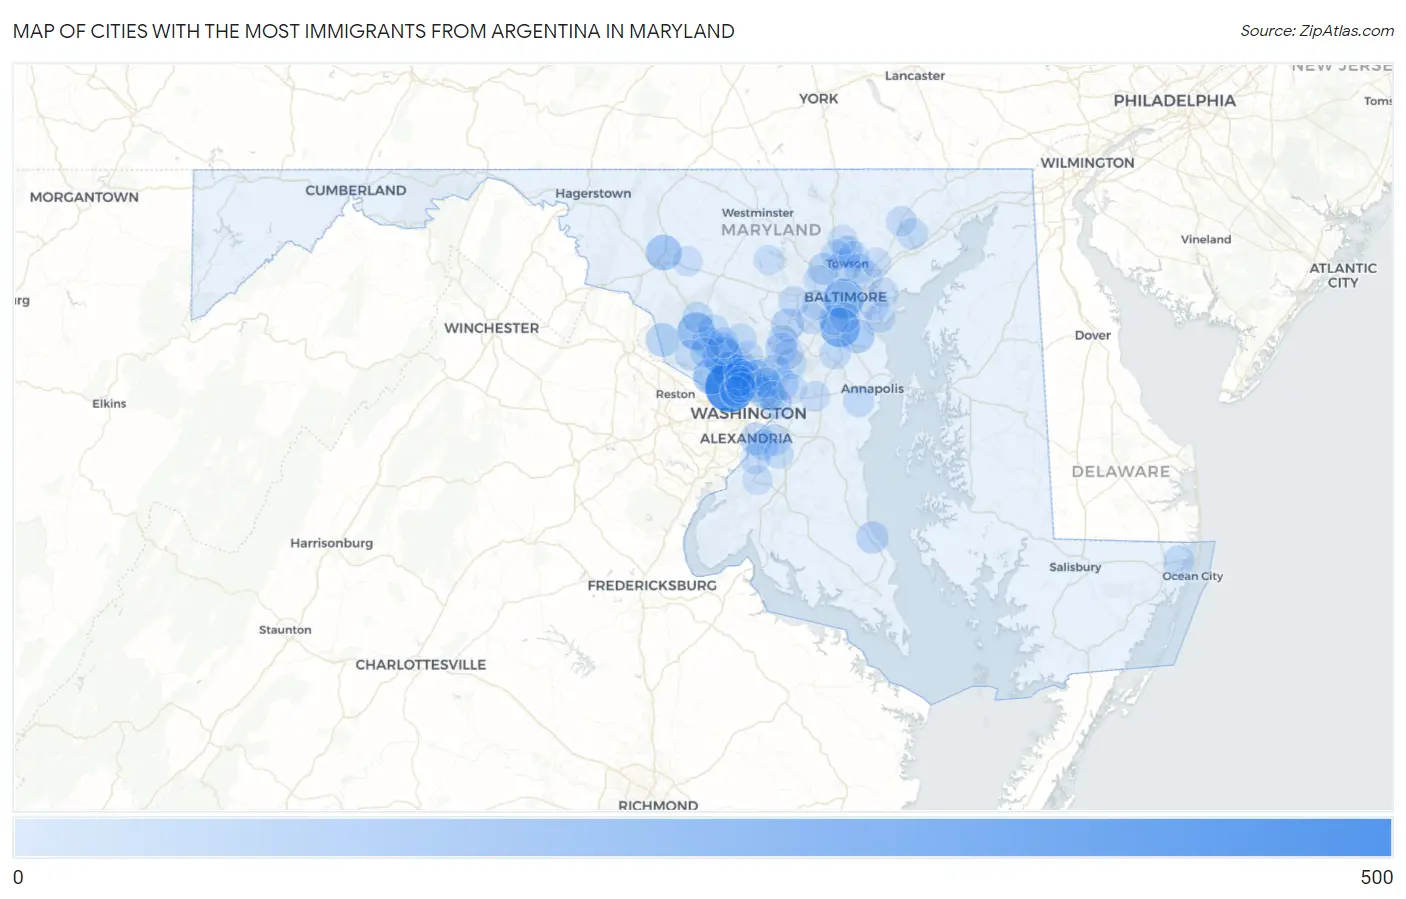
Map of Cities with the Most Immigrants from Argentina in Maryland
0
500
Cities with the Most Immigrants from Argentina in Maryland
| City | Argentina | vs State | vs National | |
| 1. | Bethesda | 481 | 4,282(11.23%)#1 | 200,110(0.24%)#48 |
| 2. | Baltimore | 244 | 4,282(5.70%)#2 | 200,110(0.12%)#105 |
| 3. | Ferndale | 230 | 4,282(5.37%)#3 | 200,110(0.11%)#119 |
| 4. | Rockville | 207 | 4,282(4.83%)#4 | 200,110(0.10%)#144 |
| 5. | Germantown | 181 | 4,282(4.23%)#5 | 200,110(0.09%)#178 |
| 6. | North Bethesda | 164 | 4,282(3.83%)#6 | 200,110(0.08%)#190 |
| 7. | Potomac | 154 | 4,282(3.60%)#7 | 200,110(0.08%)#203 |
| 8. | Frederick | 133 | 4,282(3.11%)#8 | 200,110(0.07%)#249 |
| 9. | Pasadena | 97 | 4,282(2.27%)#9 | 200,110(0.05%)#356 |
| 10. | Poolesville | 88 | 4,282(2.06%)#10 | 200,110(0.04%)#399 |
| 11. | Hyattsville | 83 | 4,282(1.94%)#11 | 200,110(0.04%)#419 |
| 12. | Columbia | 74 | 4,282(1.73%)#12 | 200,110(0.04%)#464 |
| 13. | Forest Heights | 62 | 4,282(1.45%)#13 | 200,110(0.03%)#552 |
| 14. | Towson | 59 | 4,282(1.38%)#14 | 200,110(0.03%)#574 |
| 15. | St Leonard | 58 | 4,282(1.35%)#15 | 200,110(0.03%)#589 |
| 16. | Hillandale | 57 | 4,282(1.33%)#16 | 200,110(0.03%)#598 |
| 17. | Greenbelt | 56 | 4,282(1.31%)#17 | 200,110(0.03%)#600 |
| 18. | North Kensington | 54 | 4,282(1.26%)#18 | 200,110(0.03%)#626 |
| 19. | Derwood | 52 | 4,282(1.21%)#19 | 200,110(0.03%)#653 |
| 20. | West Laurel | 51 | 4,282(1.19%)#20 | 200,110(0.03%)#666 |
| 21. | Gaithersburg | 50 | 4,282(1.17%)#21 | 200,110(0.02%)#674 |
| 22. | Pikesville | 48 | 4,282(1.12%)#22 | 200,110(0.02%)#695 |
| 23. | Silver Spring | 45 | 4,282(1.05%)#23 | 200,110(0.02%)#718 |
| 24. | Friendship Heights Village | 35 | 4,282(0.82%)#24 | 200,110(0.02%)#879 |
| 25. | Bel Air South | 34 | 4,282(0.79%)#25 | 200,110(0.02%)#886 |
| 26. | Ocean Pines | 32 | 4,282(0.75%)#26 | 200,110(0.02%)#927 |
| 27. | Edgewater | 32 | 4,282(0.75%)#27 | 200,110(0.02%)#930 |
| 28. | Camp Springs | 31 | 4,282(0.72%)#28 | 200,110(0.02%)#954 |
| 29. | Gambrills | 30 | 4,282(0.70%)#29 | 200,110(0.01%)#979 |
| 30. | Beltsville | 29 | 4,282(0.68%)#30 | 200,110(0.01%)#994 |
| 31. | Timonium | 29 | 4,282(0.68%)#31 | 200,110(0.01%)#997 |
| 32. | Montgomery Village | 26 | 4,282(0.61%)#32 | 200,110(0.01%)#1,047 |
| 33. | Woodlawn Cdp Prince George S County | 26 | 4,282(0.61%)#33 | 200,110(0.01%)#1,061 |
| 34. | Wheaton | 25 | 4,282(0.58%)#34 | 200,110(0.01%)#1,071 |
| 35. | Chillum | 25 | 4,282(0.58%)#35 | 200,110(0.01%)#1,076 |
| 36. | Clarksburg | 24 | 4,282(0.56%)#36 | 200,110(0.01%)#1,116 |
| 37. | Layhill | 24 | 4,282(0.56%)#37 | 200,110(0.01%)#1,130 |
| 38. | Mays Chapel | 22 | 4,282(0.51%)#38 | 200,110(0.01%)#1,185 |
| 39. | Olney | 21 | 4,282(0.49%)#39 | 200,110(0.01%)#1,214 |
| 40. | Oxon Hill | 21 | 4,282(0.49%)#40 | 200,110(0.01%)#1,225 |
| 41. | Cheverly | 21 | 4,282(0.49%)#41 | 200,110(0.01%)#1,232 |
| 42. | Ellicott City | 20 | 4,282(0.47%)#42 | 200,110(0.01%)#1,239 |
| 43. | Ilchester | 20 | 4,282(0.47%)#43 | 200,110(0.01%)#1,246 |
| 44. | Four Corners | 18 | 4,282(0.42%)#44 | 200,110(0.01%)#1,325 |
| 45. | Dundalk | 17 | 4,282(0.40%)#45 | 200,110(0.01%)#1,335 |
| 46. | Redland | 17 | 4,282(0.40%)#46 | 200,110(0.01%)#1,351 |
| 47. | Forest Glen | 17 | 4,282(0.40%)#47 | 200,110(0.01%)#1,367 |
| 48. | Bel Air North | 16 | 4,282(0.37%)#48 | 200,110(0.01%)#1,388 |
| 49. | Chevy Chase | 16 | 4,282(0.37%)#49 | 200,110(0.01%)#1,402 |
| 50. | Takoma Park | 15 | 4,282(0.35%)#50 | 200,110(0.01%)#1,438 |
| 51. | South Laurel | 14 | 4,282(0.33%)#51 | 200,110(0.01%)#1,480 |
| 52. | Fort Washington | 13 | 4,282(0.30%)#52 | 200,110(0.01%)#1,526 |
| 53. | Darnestown | 13 | 4,282(0.30%)#53 | 200,110(0.01%)#1,545 |
| 54. | Kensington | 12 | 4,282(0.28%)#54 | 200,110(0.01%)#1,603 |
| 55. | Scaggsville | 11 | 4,282(0.26%)#55 | 200,110(0.01%)#1,638 |
| 56. | Linthicum | 11 | 4,282(0.26%)#56 | 200,110(0.01%)#1,639 |
| 57. | Edgemere | 11 | 4,282(0.26%)#57 | 200,110(0.01%)#1,648 |
| 58. | Hampton | 11 | 4,282(0.26%)#58 | 200,110(0.01%)#1,657 |
| 59. | Lochearn | 10 | 4,282(0.23%)#59 | 200,110(0.00%)#1,685 |
| 60. | Overlea | 9 | 4,282(0.21%)#60 | 200,110(0.00%)#1,760 |
| 61. | Essex | 8 | 4,282(0.19%)#61 | 200,110(0.00%)#1,798 |
| 62. | Parkville | 7 | 4,282(0.16%)#62 | 200,110(0.00%)#1,863 |
| 63. | Brooklyn Park | 7 | 4,282(0.16%)#63 | 200,110(0.00%)#1,873 |
| 64. | Linganore | 7 | 4,282(0.16%)#64 | 200,110(0.00%)#1,878 |
| 65. | Bowie | 6 | 4,282(0.14%)#65 | 200,110(0.00%)#1,913 |
| 66. | Catonsville | 6 | 4,282(0.14%)#66 | 200,110(0.00%)#1,918 |
| 67. | Clinton | 6 | 4,282(0.14%)#67 | 200,110(0.00%)#1,920 |
| 68. | Laurel | 6 | 4,282(0.14%)#68 | 200,110(0.00%)#1,924 |
| 69. | Eldersburg | 5 | 4,282(0.12%)#69 | 200,110(0.00%)#1,977 |
| 70. | North Potomac | 5 | 4,282(0.12%)#70 | 200,110(0.00%)#1,982 |
| 71. | Adelphi | 5 | 4,282(0.12%)#71 | 200,110(0.00%)#1,987 |
| 72. | Edmonston | 5 | 4,282(0.12%)#72 | 200,110(0.00%)#2,006 |
| 73. | Somerset | 5 | 4,282(0.12%)#73 | 200,110(0.00%)#2,013 |
| 74. | Cockeysville | 4 | 4,282(0.09%)#74 | 200,110(0.00%)#2,024 |
| 75. | Accokeek | 4 | 4,282(0.09%)#75 | 200,110(0.00%)#2,030 |
| 76. | North Chevy Chase | 3 | 4,282(0.07%)#76 | 200,110(0.00%)#2,100 |
| 77. | Perry Hall | 1 | 4,282(0.02%)#77 | 200,110(0.00%)#2,153 |
| 78. | Seabrook | 1 | 4,282(0.02%)#78 | 200,110(0.00%)#2,156 |
| 79. | Martin S Additions | 1 | 4,282(0.02%)#79 | 200,110(0.00%)#2,172 |
Common Questions
What are the Top 10 Cities with the Most Immigrants from Argentina in Maryland?
Top 10 Cities with the Most Immigrants from Argentina in Maryland are:
#1
481
#2
244
#3
230
#4
207
#5
181
#6
164
#7
154
#8
133
#9
97
#10
88
What city has the Most Immigrants from Argentina in Maryland?
Bethesda has the Most Immigrants from Argentina in Maryland with 481.
What is the Total Immigrants from Argentina in the State of Maryland?
Total Immigrants from Argentina in Maryland is 4,282.
What is the Total Immigrants from Argentina in the United States?
Total Immigrants from Argentina in the United States is 200,110.