Cities with the Highest Percentage of Immigrants from Northern Europe in Virginia
RELATED REPORTS & OPTIONS
Northern Europe
Virginia
Compare Cities
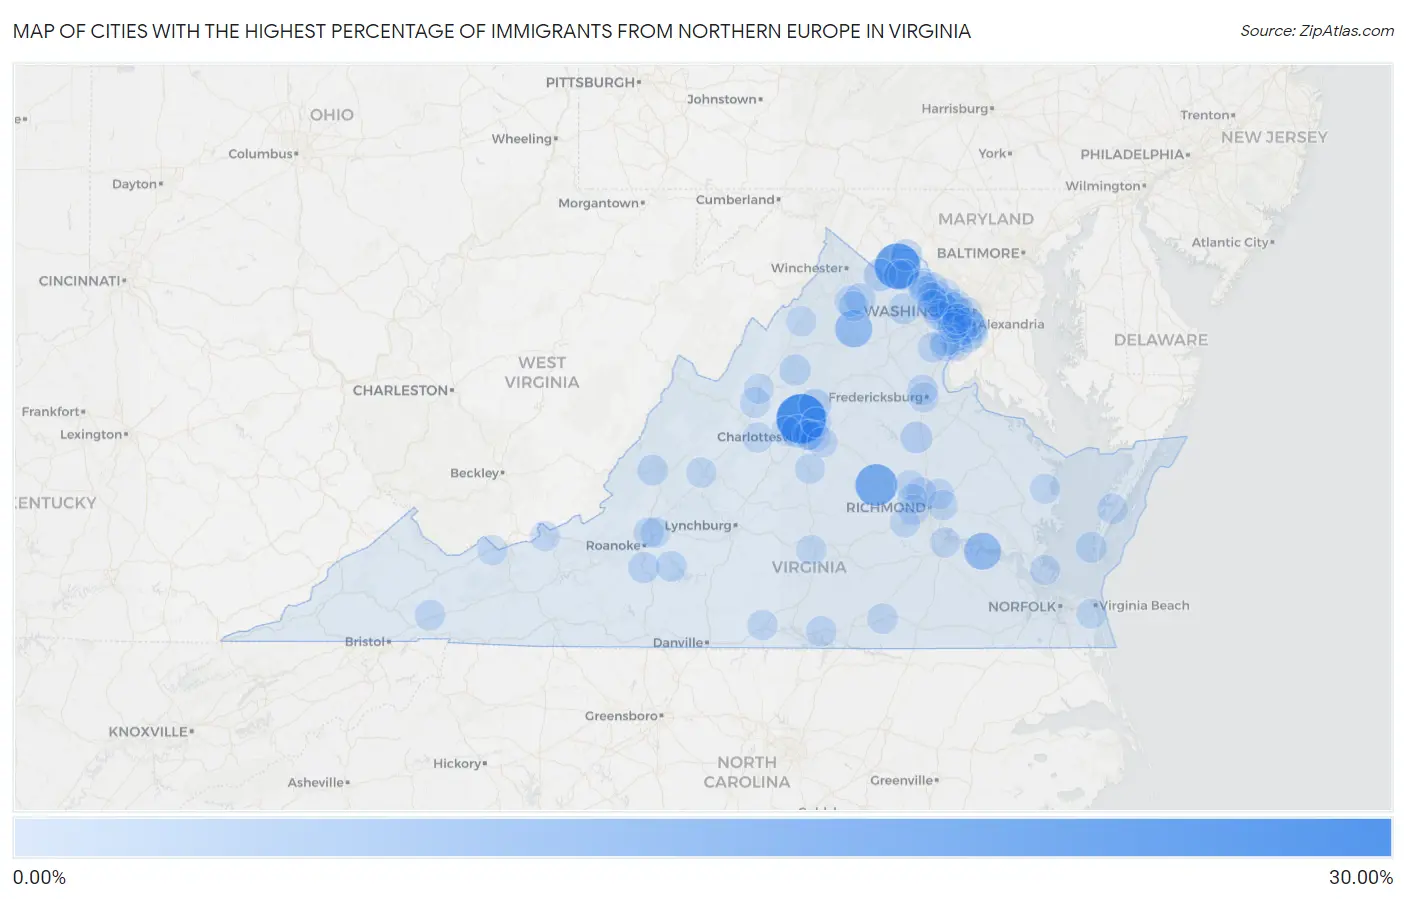
Map of Cities with the Highest Percentage of Immigrants from Northern Europe in Virginia
0.00%
30.00%
Cities with the Highest Percentage of Immigrants from Northern Europe in Virginia
| City | Northern Europe | vs State | vs National | |
| 1. | Free Union | 25.95% | 0.30%(+25.6)#1 | 0.29%(+25.7)#3 |
| 2. | Hillsboro | 20.39% | 0.30%(+20.1)#2 | 0.29%(+20.1)#7 |
| 3. | Goochland | 15.53% | 0.30%(+15.2)#3 | 0.29%(+15.2)#14 |
| 4. | Paris | 13.33% | 0.30%(+13.0)#4 | 0.29%(+13.0)#18 |
| 5. | Brandy Station | 12.22% | 0.30%(+11.9)#5 | 0.29%(+11.9)#22 |
| 6. | Flint Hill | 9.40% | 0.30%(+9.11)#6 | 0.29%(+9.12)#36 |
| 7. | Claremont | 9.26% | 0.30%(+8.96)#7 | 0.29%(+8.98)#38 |
| 8. | Moneta | 7.14% | 0.30%(+6.84)#8 | 0.29%(+6.86)#49 |
| 9. | Ivy | 3.67% | 0.30%(+3.37)#9 | 0.29%(+3.38)#195 |
| 10. | Shenandoah Retreat | 3.54% | 0.30%(+3.24)#10 | 0.29%(+3.25)#209 |
| 11. | Twin Lakes | 3.20% | 0.30%(+2.90)#11 | 0.29%(+2.92)#243 |
| 12. | North Garden | 2.67% | 0.30%(+2.38)#12 | 0.29%(+2.39)#346 |
| 13. | Lake Land Or | 2.39% | 0.30%(+2.09)#13 | 0.29%(+2.11)#411 |
| 14. | Lovettsville | 2.14% | 0.30%(+1.84)#14 | 0.29%(+1.85)#476 |
| 15. | Braddock | 1.97% | 0.30%(+1.67)#15 | 0.29%(+1.68)#553 |
| 16. | Boones Mill | 1.95% | 0.30%(+1.65)#16 | 0.29%(+1.67)#561 |
| 17. | Bull Run Mountain Estates | 1.77% | 0.30%(+1.47)#17 | 0.29%(+1.49)#643 |
| 18. | Shenandoah | 1.72% | 0.30%(+1.42)#18 | 0.29%(+1.44)#672 |
| 19. | Belle Haven | 1.62% | 0.30%(+1.32)#19 | 0.29%(+1.33)#735 |
| 20. | Shenandoah Shores | 1.59% | 0.30%(+1.29)#20 | 0.29%(+1.31)#755 |
| 21. | Shenandoah Farms | 1.55% | 0.30%(+1.26)#21 | 0.29%(+1.27)#779 |
| 22. | One Loudoun | 1.51% | 0.30%(+1.21)#22 | 0.29%(+1.23)#815 |
| 23. | Westlake Corner | 1.49% | 0.30%(+1.19)#23 | 0.29%(+1.20)#834 |
| 24. | Cape Charles | 1.35% | 0.30%(+1.05)#24 | 0.29%(+1.07)#954 |
| 25. | Wolf Trap | 1.31% | 0.30%(+1.01)#25 | 0.29%(+1.03)#1,002 |
| 26. | Low Moor | 1.29% | 0.30%(+0.987)#26 | 0.29%(+1.000)#1,024 |
| 27. | Mclean | 1.23% | 0.30%(+0.935)#27 | 0.29%(+0.949)#1,090 |
| 28. | Southern Gateway | 1.18% | 0.30%(+0.877)#28 | 0.29%(+0.891)#1,171 |
| 29. | Huntington | 1.15% | 0.30%(+0.851)#29 | 0.29%(+0.865)#1,207 |
| 30. | Lansdowne | 1.10% | 0.30%(+0.799)#30 | 0.29%(+0.813)#1,282 |
| 31. | Boydton | 1.08% | 0.30%(+0.777)#31 | 0.29%(+0.790)#1,324 |
| 32. | Pantops | 1.05% | 0.30%(+0.752)#32 | 0.29%(+0.765)#1,372 |
| 33. | Union Mill | 1.02% | 0.30%(+0.724)#33 | 0.29%(+0.737)#1,432 |
| 34. | Lorton | 1.01% | 0.30%(+0.708)#34 | 0.29%(+0.721)#1,457 |
| 35. | Mount Sidney | 1.01% | 0.30%(+0.708)#35 | 0.29%(+0.721)#1,458 |
| 36. | Franklin Farm | 1.00% | 0.30%(+0.701)#36 | 0.29%(+0.714)#1,474 |
| 37. | Mechanicsville | 0.99% | 0.30%(+0.687)#37 | 0.29%(+0.701)#1,501 |
| 38. | Emory | 0.95% | 0.30%(+0.652)#38 | 0.29%(+0.665)#1,586 |
| 39. | Dranesville | 0.92% | 0.30%(+0.623)#39 | 0.29%(+0.636)#1,634 |
| 40. | Hamilton | 0.89% | 0.30%(+0.591)#40 | 0.29%(+0.605)#1,706 |
| 41. | Woodburn | 0.84% | 0.30%(+0.545)#41 | 0.29%(+0.558)#1,842 |
| 42. | Mantua | 0.84% | 0.30%(+0.538)#42 | 0.29%(+0.551)#1,861 |
| 43. | Lawrenceville | 0.83% | 0.30%(+0.535)#43 | 0.29%(+0.549)#1,863 |
| 44. | South Boston | 0.83% | 0.30%(+0.532)#44 | 0.29%(+0.546)#1,872 |
| 45. | Cloverdale | 0.83% | 0.30%(+0.530)#45 | 0.29%(+0.543)#1,881 |
| 46. | Exmore | 0.80% | 0.30%(+0.504)#46 | 0.29%(+0.517)#1,950 |
| 47. | Lyndhurst | 0.80% | 0.30%(+0.501)#47 | 0.29%(+0.515)#1,959 |
| 48. | Mount Vernon | 0.80% | 0.30%(+0.498)#48 | 0.29%(+0.512)#1,968 |
| 49. | Highland Springs | 0.79% | 0.30%(+0.494)#49 | 0.29%(+0.508)#1,982 |
| 50. | Reston | 0.79% | 0.30%(+0.494)#50 | 0.29%(+0.507)#1,985 |
| 51. | Fairfax | 0.79% | 0.30%(+0.493)#51 | 0.29%(+0.507)#1,987 |
| 52. | Laurel | 0.77% | 0.30%(+0.470)#52 | 0.29%(+0.483)#2,049 |
| 53. | Potomac Mills | 0.77% | 0.30%(+0.469)#53 | 0.29%(+0.483)#2,051 |
| 54. | Falls Church | 0.76% | 0.30%(+0.463)#54 | 0.29%(+0.476)#2,069 |
| 55. | Great Falls | 0.72% | 0.30%(+0.423)#55 | 0.29%(+0.436)#2,186 |
| 56. | Laymantown | 0.71% | 0.30%(+0.413)#56 | 0.29%(+0.427)#2,223 |
| 57. | Oakton | 0.71% | 0.30%(+0.408)#57 | 0.29%(+0.421)#2,235 |
| 58. | Scottsville | 0.70% | 0.30%(+0.402)#58 | 0.29%(+0.415)#2,255 |
| 59. | Fort Hunt | 0.70% | 0.30%(+0.401)#59 | 0.29%(+0.414)#2,258 |
| 60. | Apple Mountain Lake | 0.69% | 0.30%(+0.396)#60 | 0.29%(+0.409)#2,276 |
| 61. | Lexington | 0.69% | 0.30%(+0.396)#61 | 0.29%(+0.409)#2,279 |
| 62. | Goose Creek | 0.69% | 0.30%(+0.387)#62 | 0.29%(+0.401)#2,307 |
| 63. | Countryside | 0.67% | 0.30%(+0.375)#63 | 0.29%(+0.388)#2,347 |
| 64. | Arlington | 0.64% | 0.30%(+0.346)#64 | 0.29%(+0.359)#2,463 |
| 65. | Tysons | 0.64% | 0.30%(+0.339)#65 | 0.29%(+0.352)#2,485 |
| 66. | Ashburn | 0.62% | 0.30%(+0.321)#66 | 0.29%(+0.335)#2,556 |
| 67. | Edinburg | 0.61% | 0.30%(+0.307)#67 | 0.29%(+0.320)#2,626 |
| 68. | Hopewell | 0.59% | 0.30%(+0.296)#68 | 0.29%(+0.309)#2,674 |
| 69. | Bethel Manor | 0.59% | 0.30%(+0.289)#69 | 0.29%(+0.303)#2,704 |
| 70. | Kingstowne | 0.59% | 0.30%(+0.288)#70 | 0.29%(+0.302)#2,706 |
| 71. | Wyndham | 0.59% | 0.30%(+0.288)#71 | 0.29%(+0.301)#2,711 |
| 72. | Belmont | 0.58% | 0.30%(+0.278)#72 | 0.29%(+0.291)#2,759 |
| 73. | Bon Air | 0.57% | 0.30%(+0.274)#73 | 0.29%(+0.288)#2,784 |
| 74. | Alexandria | 0.57% | 0.30%(+0.274)#74 | 0.29%(+0.288)#2,785 |
| 75. | Charlottesville | 0.56% | 0.30%(+0.256)#75 | 0.29%(+0.270)#2,869 |
| 76. | Oak Grove | 0.55% | 0.30%(+0.254)#76 | 0.29%(+0.267)#2,875 |
| 77. | University Of Virginia | 0.52% | 0.30%(+0.220)#77 | 0.29%(+0.233)#3,058 |
| 78. | Mason Neck | 0.52% | 0.30%(+0.219)#78 | 0.29%(+0.232)#3,062 |
| 79. | Difficult Run | 0.51% | 0.30%(+0.209)#79 | 0.29%(+0.223)#3,101 |
| 80. | Lake Ridge | 0.49% | 0.30%(+0.195)#80 | 0.29%(+0.209)#3,176 |
| 81. | Tuckahoe | 0.49% | 0.30%(+0.192)#81 | 0.29%(+0.206)#3,188 |
| 82. | Rivanna | 0.48% | 0.30%(+0.180)#82 | 0.29%(+0.194)#3,259 |
| 83. | Crozet | 0.47% | 0.30%(+0.173)#83 | 0.29%(+0.187)#3,298 |
| 84. | Fair Oaks | 0.47% | 0.30%(+0.168)#84 | 0.29%(+0.181)#3,332 |
| 85. | Hampden Sydney | 0.46% | 0.30%(+0.166)#85 | 0.29%(+0.179)#3,348 |
| 86. | Fredericksburg | 0.46% | 0.30%(+0.158)#86 | 0.29%(+0.171)#3,387 |
| 87. | Bluefield | 0.45% | 0.30%(+0.156)#87 | 0.29%(+0.169)#3,402 |
| 88. | West Springfield | 0.45% | 0.30%(+0.155)#88 | 0.29%(+0.168)#3,415 |
| 89. | Narrows | 0.45% | 0.30%(+0.154)#89 | 0.29%(+0.167)#3,427 |
| 90. | Floris | 0.44% | 0.30%(+0.146)#90 | 0.29%(+0.160)#3,474 |
| 91. | Purcellville | 0.44% | 0.30%(+0.138)#91 | 0.29%(+0.151)#3,521 |
| 92. | Brandermill | 0.43% | 0.30%(+0.128)#92 | 0.29%(+0.142)#3,591 |
| 93. | North Springfield | 0.42% | 0.30%(+0.121)#93 | 0.29%(+0.134)#3,645 |
| 94. | Hollymead | 0.41% | 0.30%(+0.113)#94 | 0.29%(+0.127)#3,701 |
| 95. | Midlothian | 0.41% | 0.30%(+0.109)#95 | 0.29%(+0.122)#3,737 |
| 96. | Mount Crawford | 0.39% | 0.30%(+0.094)#96 | 0.29%(+0.108)#3,858 |
| 97. | Virginia Beach | 0.39% | 0.30%(+0.094)#97 | 0.29%(+0.107)#3,859 |
| 98. | Independent Hill | 0.39% | 0.30%(+0.087)#98 | 0.29%(+0.100)#3,924 |
| 99. | Irvington | 0.39% | 0.30%(+0.087)#99 | 0.29%(+0.100)#3,926 |
| 100. | Annandale | 0.39% | 0.30%(+0.086)#100 | 0.29%(+0.100)#3,929 |
Common Questions
What are the Top 10 Cities with the Highest Percentage of Immigrants from Northern Europe in Virginia?
Top 10 Cities with the Highest Percentage of Immigrants from Northern Europe in Virginia are:
#1
25.95%
#2
20.39%
#3
15.53%
#4
9.40%
#5
9.26%
#6
3.67%
#7
3.54%
#8
3.20%
#9
2.39%
#10
2.14%
What city has the Highest Percentage of Immigrants from Northern Europe in Virginia?
Free Union has the Highest Percentage of Immigrants from Northern Europe in Virginia with 25.95%.
What is the Percentage of Immigrants from Northern Europe in the State of Virginia?
Percentage of Immigrants from Northern Europe in Virginia is 0.30%.
What is the Percentage of Immigrants from Northern Europe in the United States?
Percentage of Immigrants from Northern Europe in the United States is 0.29%.