Cities with the Highest Percentage of Immigrants from Philippines in Maryland
RELATED REPORTS & OPTIONS
Philippines
Maryland
Compare Cities
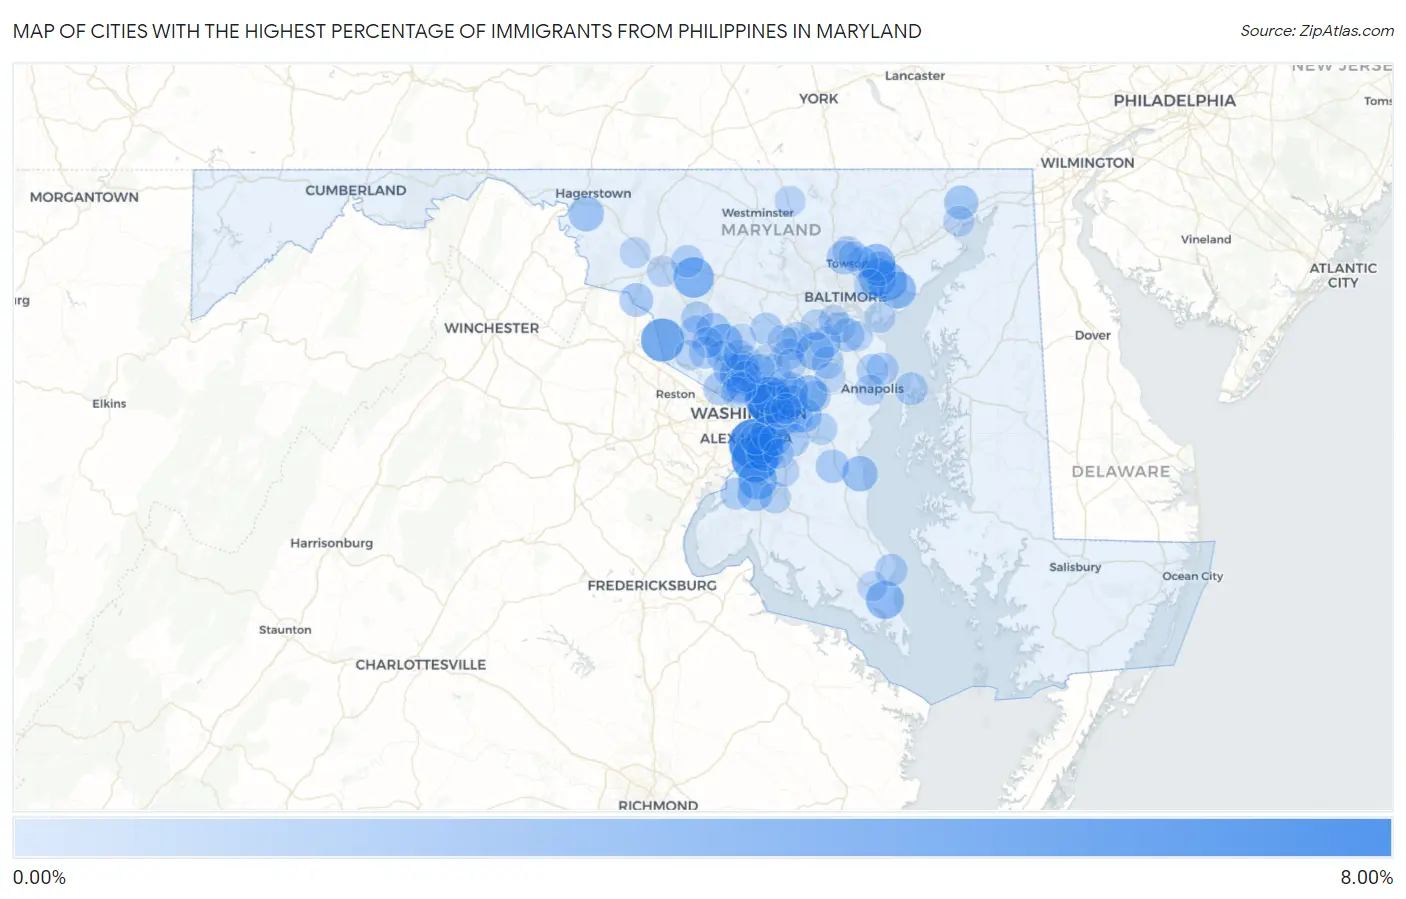
Map of Cities with the Highest Percentage of Immigrants from Philippines in Maryland
0.00%
8.00%
Cities with the Highest Percentage of Immigrants from Philippines in Maryland
| City | Philippines | vs State | vs National | |
| 1. | National Harbor | 6.12% | 0.60%(+5.52)#-1 | 0.60%(+5.52)#0 |
| 2. | Fort Washington | 5.34% | 0.60%(+4.74)#35 | 0.60%(+4.74)#871 |
| 3. | Cottage City | 5.29% | 0.60%(+4.70)#36 | 0.60%(+4.69)#872 |
| 4. | Colmar Manor | 4.75% | 0.60%(+4.15)#37 | 0.60%(+4.15)#873 |
| 5. | Poolesville | 4.26% | 0.60%(+3.66)#38 | 0.60%(+3.66)#874 |
| 6. | Monrovia | 3.49% | 0.60%(+2.89)#39 | 0.60%(+2.89)#875 |
| 7. | Kensington | 3.26% | 0.60%(+2.66)#40 | 0.60%(+2.66)#876 |
| 8. | Accokeek | 3.05% | 0.60%(+2.46)#41 | 0.60%(+2.45)#877 |
| 9. | Oxon Hill | 3.03% | 0.60%(+2.44)#42 | 0.60%(+2.43)#878 |
| 10. | Middle River | 3.03% | 0.60%(+2.43)#43 | 0.60%(+2.43)#879 |
| 11. | Lexington Park | 2.84% | 0.60%(+2.24)#44 | 0.60%(+2.24)#880 |
| 12. | Rossville | 2.81% | 0.60%(+2.22)#45 | 0.60%(+2.21)#881 |
| 13. | Flower Hill | 2.70% | 0.60%(+2.10)#46 | 0.60%(+2.10)#882 |
| 14. | Fort Meade | 2.70% | 0.60%(+2.10)#47 | 0.60%(+2.10)#883 |
| 15. | Friendly | 2.69% | 0.60%(+2.09)#48 | 0.60%(+2.09)#884 |
| 16. | Redland | 2.63% | 0.60%(+2.03)#49 | 0.60%(+2.03)#885 |
| 17. | Perry Hall | 2.62% | 0.60%(+2.03)#50 | 0.60%(+2.02)#886 |
| 18. | Bowleys Quarters | 2.55% | 0.60%(+1.95)#51 | 0.60%(+1.95)#887 |
| 19. | Callaway | 2.55% | 0.60%(+1.95)#52 | 0.60%(+1.95)#888 |
| 20. | Fairwood | 2.52% | 0.60%(+1.93)#53 | 0.60%(+1.92)#889 |
| 21. | Marlow Heights | 2.22% | 0.60%(+1.63)#54 | 0.60%(+1.62)#890 |
| 22. | Chesapeake Beach | 2.09% | 0.60%(+1.50)#55 | 0.60%(+1.49)#891 |
| 23. | St James | 2.07% | 0.60%(+1.47)#56 | 0.60%(+1.47)#892 |
| 24. | White Marsh | 2.01% | 0.60%(+1.42)#57 | 0.60%(+1.41)#893 |
| 25. | Bensville | 1.96% | 0.60%(+1.36)#58 | 0.60%(+1.36)#894 |
| 26. | Walker Mill | 1.90% | 0.60%(+1.30)#59 | 0.60%(+1.30)#895 |
| 27. | Kettering | 1.88% | 0.60%(+1.29)#60 | 0.60%(+1.28)#896 |
| 28. | Port Deposit | 1.70% | 0.60%(+1.11)#61 | 0.60%(+1.10)#897 |
| 29. | Montgomery Village | 1.66% | 0.60%(+1.06)#62 | 0.60%(+1.06)#966 |
| 30. | Lutherville | 1.62% | 0.60%(+1.03)#63 | 0.60%(+1.02)#967 |
| 31. | Point Of Rocks | 1.61% | 0.60%(+1.01)#64 | 0.60%(+1.01)#968 |
| 32. | Largo | 1.58% | 0.60%(+0.986)#65 | 0.60%(+0.982)#969 |
| 33. | Glen Burnie | 1.57% | 0.60%(+0.972)#66 | 0.60%(+0.968)#970 |
| 34. | Dunkirk | 1.54% | 0.60%(+0.942)#67 | 0.60%(+0.937)#971 |
| 35. | Cabin John | 1.50% | 0.60%(+0.907)#68 | 0.60%(+0.903)#972 |
| 36. | Honeygo | 1.50% | 0.60%(+0.907)#69 | 0.60%(+0.903)#973 |
| 37. | North Bethesda | 1.50% | 0.60%(+0.904)#70 | 0.60%(+0.899)#974 |
| 38. | Wheaton | 1.48% | 0.60%(+0.888)#71 | 0.60%(+0.884)#975 |
| 39. | Melwood | 1.48% | 0.60%(+0.888)#72 | 0.60%(+0.884)#976 |
| 40. | Chevy Chase Section Three | 1.46% | 0.60%(+0.866)#73 | 0.60%(+0.862)#977 |
| 41. | North Brentwood | 1.44% | 0.60%(+0.840)#74 | 0.60%(+0.836)#978 |
| 42. | Stevensville | 1.34% | 0.60%(+0.748)#75 | 0.60%(+0.744)#979 |
| 43. | Linganore | 1.28% | 0.60%(+0.685)#76 | 0.60%(+0.681)#980 |
| 44. | North Laurel | 1.26% | 0.60%(+0.666)#77 | 0.60%(+0.662)#981 |
| 45. | Chesapeake Ranch Estates | 1.24% | 0.60%(+0.643)#78 | 0.60%(+0.638)#982 |
| 46. | Seabrook | 1.23% | 0.60%(+0.633)#79 | 0.60%(+0.629)#983 |
| 47. | Clarksburg | 1.22% | 0.60%(+0.622)#80 | 0.60%(+0.618)#984 |
| 48. | Takoma Park | 1.21% | 0.60%(+0.619)#81 | 0.60%(+0.614)#985 |
| 49. | Germantown | 1.20% | 0.60%(+0.605)#82 | 0.60%(+0.601)#986 |
| 50. | Lanham | 1.19% | 0.60%(+0.596)#83 | 0.60%(+0.592)#987 |
| 51. | Highland | 1.19% | 0.60%(+0.591)#84 | 0.60%(+0.587)#988 |
| 52. | Odenton | 1.18% | 0.60%(+0.582)#85 | 0.60%(+0.577)#989 |
| 53. | Cape St Claire | 1.17% | 0.60%(+0.577)#86 | 0.60%(+0.573)#990 |
| 54. | Springdale | 1.17% | 0.60%(+0.576)#87 | 0.60%(+0.572)#991 |
| 55. | Arnold | 1.16% | 0.60%(+0.569)#88 | 0.60%(+0.564)#992 |
| 56. | North Potomac | 1.14% | 0.60%(+0.542)#89 | 0.60%(+0.538)#993 |
| 57. | Forest Heights | 1.14% | 0.60%(+0.540)#90 | 0.60%(+0.536)#994 |
| 58. | Carney | 1.12% | 0.60%(+0.529)#91 | 0.60%(+0.525)#995 |
| 59. | Marlboro Meadows | 1.12% | 0.60%(+0.522)#92 | 0.60%(+0.518)#996 |
| 60. | Camp Springs | 1.10% | 0.60%(+0.509)#93 | 0.60%(+0.505)#997 |
| 61. | Beltsville | 1.10% | 0.60%(+0.501)#94 | 0.60%(+0.496)#998 |
| 62. | Bryans Road | 1.09% | 0.60%(+0.498)#95 | 0.60%(+0.494)#999 |
| 63. | Severn | 1.06% | 0.60%(+0.464)#96 | 0.60%(+0.460)#1,000 |
| 64. | Waldorf | 1.04% | 0.60%(+0.445)#97 | 0.60%(+0.441)#1,122 |
| 65. | Glenmont | 1.04% | 0.60%(+0.445)#98 | 0.60%(+0.440)#1,123 |
| 66. | Rosedale | 1.04% | 0.60%(+0.441)#99 | 0.60%(+0.437)#1,124 |
| 67. | Bowie | 1.03% | 0.60%(+0.432)#100 | 0.60%(+0.428)#1,125 |
| 68. | Rockville | 1.01% | 0.60%(+0.416)#101 | 0.60%(+0.412)#1,126 |
| 69. | Savage | 0.97% | 0.60%(+0.374)#102 | 0.60%(+0.370)#1,127 |
| 70. | Ballenger Creek | 0.96% | 0.60%(+0.362)#103 | 0.60%(+0.358)#1,128 |
| 71. | Laurel | 0.94% | 0.60%(+0.348)#104 | 0.60%(+0.343)#1,129 |
| 72. | Friendship Heights Village | 0.93% | 0.60%(+0.331)#105 | 0.60%(+0.327)#1,130 |
| 73. | Brandywine | 0.92% | 0.60%(+0.326)#106 | 0.60%(+0.322)#1,131 |
| 74. | Elkridge | 0.91% | 0.60%(+0.315)#107 | 0.60%(+0.311)#1,132 |
| 75. | Gaithersburg | 0.90% | 0.60%(+0.306)#108 | 0.60%(+0.302)#1,133 |
| 76. | Fairland | 0.89% | 0.60%(+0.289)#109 | 0.60%(+0.285)#1,134 |
| 77. | Havre De Grace | 0.88% | 0.60%(+0.286)#110 | 0.60%(+0.282)#1,135 |
| 78. | Seat Pleasant | 0.88% | 0.60%(+0.285)#111 | 0.60%(+0.281)#1,136 |
| 79. | Forest Glen | 0.87% | 0.60%(+0.279)#112 | 0.60%(+0.275)#1,137 |
| 80. | Ferndale | 0.86% | 0.60%(+0.268)#113 | 0.60%(+0.264)#1,138 |
| 81. | Middletown | 0.86% | 0.60%(+0.268)#114 | 0.60%(+0.264)#1,139 |
| 82. | Annapolis | 0.83% | 0.60%(+0.239)#115 | 0.60%(+0.235)#1,140 |
| 83. | Hampstead | 0.83% | 0.60%(+0.233)#116 | 0.60%(+0.229)#1,141 |
| 84. | Greenbelt | 0.81% | 0.60%(+0.216)#117 | 0.60%(+0.212)#1,142 |
| 85. | Edgemere | 0.81% | 0.60%(+0.215)#118 | 0.60%(+0.211)#1,143 |
| 86. | Aspen Hill | 0.80% | 0.60%(+0.204)#119 | 0.60%(+0.200)#1,144 |
| 87. | Timonium | 0.80% | 0.60%(+0.201)#120 | 0.60%(+0.197)#1,145 |
| 88. | Summerfield | 0.74% | 0.60%(+0.145)#121 | 0.60%(+0.141)#1,146 |
| 89. | Linthicum | 0.74% | 0.60%(+0.141)#122 | 0.60%(+0.136)#1,147 |
| 90. | Hampton | 0.71% | 0.60%(+0.113)#123 | 0.60%(+0.109)#1,148 |
| 91. | Martin S Additions | 0.70% | 0.60%(+0.109)#124 | 0.60%(+0.105)#1,149 |
| 92. | Darnestown | 0.69% | 0.60%(+0.094)#125 | 0.60%(+0.090)#1,150 |
| 93. | Clinton | 0.68% | 0.60%(+0.083)#126 | 0.60%(+0.079)#1,151 |
| 94. | California | 0.67% | 0.60%(+0.072)#127 | 0.60%(+0.068)#1,152 |
| 95. | Olney | 0.66% | 0.60%(+0.066)#128 | 0.60%(+0.062)#1,153 |
| 96. | White Oak | 0.66% | 0.60%(+0.063)#129 | 0.60%(+0.059)#1,154 |
| 97. | Crofton | 0.66% | 0.60%(+0.062)#130 | 0.60%(+0.058)#1,155 |
| 98. | Scaggsville | 0.65% | 0.60%(+0.053)#131 | 0.60%(+0.049)#1,156 |
| 99. | South Laurel | 0.63% | 0.60%(+0.038)#132 | 0.60%(+0.033)#1,157 |
| 100. | Pasadena | 0.63% | 0.60%(+0.036)#133 | 0.60%(+0.031)#1,158 |
Common Questions
What are the Top 10 Cities with the Highest Percentage of Immigrants from Philippines in Maryland?
Top 10 Cities with the Highest Percentage of Immigrants from Philippines in Maryland are:
#1
6.12%
#2
5.34%
#3
5.29%
#4
4.75%
#5
4.26%
#6
3.49%
#7
3.26%
#8
3.05%
#9
3.03%
#10
3.03%
What city has the Highest Percentage of Immigrants from Philippines in Maryland?
National Harbor has the Highest Percentage of Immigrants from Philippines in Maryland with 6.12%.
What is the Percentage of Immigrants from Philippines in the State of Maryland?
Percentage of Immigrants from Philippines in Maryland is 0.60%.
What is the Percentage of Immigrants from Philippines in the United States?
Percentage of Immigrants from Philippines in the United States is 0.60%.