Cities with the Most Immigrants from Southern Europe in Maryland
RELATED REPORTS & OPTIONS
Southern Europe
Maryland
Compare Cities
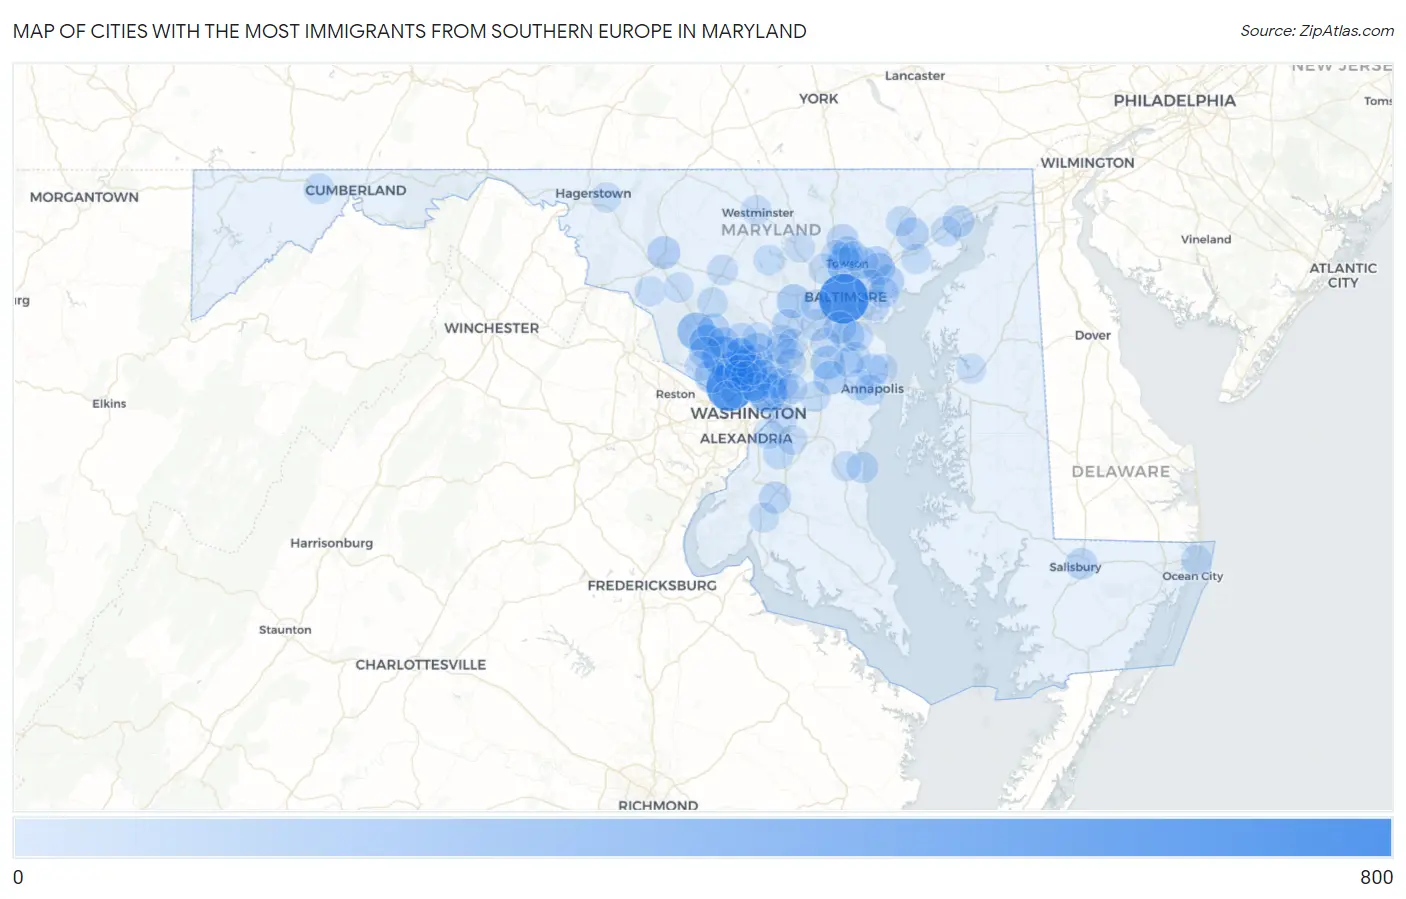
Map of Cities with the Most Immigrants from Southern Europe in Maryland
0
800
Cities with the Most Immigrants from Southern Europe in Maryland
| City | Southern Europe | vs State | vs National | |
| 1. | Baltimore | 787 | 11,082(7.10%)#1 | 728,588(0.11%)#83 |
| 2. | Bethesda | 687 | 11,082(6.20%)#2 | 728,588(0.09%)#103 |
| 3. | Rockville | 405 | 11,082(3.65%)#3 | 728,588(0.06%)#225 |
| 4. | Hyattsville | 360 | 11,082(3.25%)#4 | 728,588(0.05%)#263 |
| 5. | Germantown | 303 | 11,082(2.73%)#5 | 728,588(0.04%)#321 |
| 6. | Silver Spring | 276 | 11,082(2.49%)#6 | 728,588(0.04%)#366 |
| 7. | Wheaton | 256 | 11,082(2.31%)#7 | 728,588(0.04%)#403 |
| 8. | North Bethesda | 247 | 11,082(2.23%)#8 | 728,588(0.03%)#419 |
| 9. | Gaithersburg | 243 | 11,082(2.19%)#9 | 728,588(0.03%)#432 |
| 10. | Towson | 233 | 11,082(2.10%)#10 | 728,588(0.03%)#457 |
| 11. | Colesville | 177 | 11,082(1.60%)#11 | 728,588(0.02%)#613 |
| 12. | Ellicott City | 168 | 11,082(1.52%)#12 | 728,588(0.02%)#646 |
| 13. | Cloverly | 167 | 11,082(1.51%)#13 | 728,588(0.02%)#651 |
| 14. | Odenton | 156 | 11,082(1.41%)#14 | 728,588(0.02%)#696 |
| 15. | Potomac | 154 | 11,082(1.39%)#15 | 728,588(0.02%)#705 |
| 16. | Aspen Hill | 148 | 11,082(1.34%)#16 | 728,588(0.02%)#730 |
| 17. | Crofton | 145 | 11,082(1.31%)#17 | 728,588(0.02%)#748 |
| 18. | Glen Burnie | 136 | 11,082(1.23%)#18 | 728,588(0.02%)#793 |
| 19. | Middle River | 135 | 11,082(1.22%)#19 | 728,588(0.02%)#803 |
| 20. | Frederick | 134 | 11,082(1.21%)#20 | 728,588(0.02%)#806 |
| 21. | Bel Air South | 124 | 11,082(1.12%)#21 | 728,588(0.02%)#857 |
| 22. | Glenmont | 120 | 11,082(1.08%)#22 | 728,588(0.02%)#882 |
| 23. | Montgomery Village | 112 | 11,082(1.01%)#23 | 728,588(0.02%)#932 |
| 24. | Perry Hall | 108 | 11,082(0.97%)#24 | 728,588(0.01%)#968 |
| 25. | White Marsh | 100 | 11,082(0.90%)#25 | 728,588(0.01%)#1,043 |
| 26. | Dundalk | 98 | 11,082(0.88%)#26 | 728,588(0.01%)#1,059 |
| 27. | Ferndale | 95 | 11,082(0.86%)#27 | 728,588(0.01%)#1,095 |
| 28. | College Park | 94 | 11,082(0.85%)#28 | 728,588(0.01%)#1,102 |
| 29. | Waldorf | 89 | 11,082(0.80%)#29 | 728,588(0.01%)#1,148 |
| 30. | Arnold | 89 | 11,082(0.80%)#30 | 728,588(0.01%)#1,151 |
| 31. | Cockeysville | 88 | 11,082(0.79%)#31 | 728,588(0.01%)#1,157 |
| 32. | Olney | 86 | 11,082(0.78%)#32 | 728,588(0.01%)#1,170 |
| 33. | Carney | 84 | 11,082(0.76%)#33 | 728,588(0.01%)#1,201 |
| 34. | Columbia | 83 | 11,082(0.75%)#34 | 728,588(0.01%)#1,207 |
| 35. | Beltsville | 81 | 11,082(0.73%)#35 | 728,588(0.01%)#1,239 |
| 36. | Elkridge | 78 | 11,082(0.70%)#36 | 728,588(0.01%)#1,268 |
| 37. | Havre De Grace | 78 | 11,082(0.70%)#37 | 728,588(0.01%)#1,271 |
| 38. | Salisbury | 76 | 11,082(0.69%)#38 | 728,588(0.01%)#1,300 |
| 39. | Redland | 76 | 11,082(0.69%)#39 | 728,588(0.01%)#1,303 |
| 40. | North Potomac | 75 | 11,082(0.68%)#40 | 728,588(0.01%)#1,322 |
| 41. | Greenbelt | 69 | 11,082(0.62%)#41 | 728,588(0.01%)#1,410 |
| 42. | North Beach | 66 | 11,082(0.60%)#42 | 728,588(0.01%)#1,477 |
| 43. | Severna Park | 59 | 11,082(0.53%)#43 | 728,588(0.01%)#1,589 |
| 44. | Catonsville | 58 | 11,082(0.52%)#44 | 728,588(0.01%)#1,605 |
| 45. | Annapolis | 57 | 11,082(0.51%)#45 | 728,588(0.01%)#1,619 |
| 46. | North Kensington | 57 | 11,082(0.51%)#46 | 728,588(0.01%)#1,627 |
| 47. | Green Valley | 55 | 11,082(0.50%)#47 | 728,588(0.01%)#1,671 |
| 48. | Scaggsville | 55 | 11,082(0.50%)#48 | 728,588(0.01%)#1,673 |
| 49. | Burnt Mills | 54 | 11,082(0.49%)#49 | 728,588(0.01%)#1,704 |
| 50. | Lutherville | 53 | 11,082(0.48%)#50 | 728,588(0.01%)#1,725 |
| 51. | Parole | 51 | 11,082(0.46%)#51 | 728,588(0.01%)#1,768 |
| 52. | Clinton | 50 | 11,082(0.45%)#52 | 728,588(0.01%)#1,789 |
| 53. | Rosedale | 47 | 11,082(0.42%)#53 | 728,588(0.01%)#1,872 |
| 54. | Marlow Heights | 47 | 11,082(0.42%)#54 | 728,588(0.01%)#1,882 |
| 55. | Hillandale | 47 | 11,082(0.42%)#55 | 728,588(0.01%)#1,886 |
| 56. | Friendship Heights Village | 47 | 11,082(0.42%)#56 | 728,588(0.01%)#1,887 |
| 57. | Essex | 46 | 11,082(0.42%)#57 | 728,588(0.01%)#1,898 |
| 58. | Timonium | 43 | 11,082(0.39%)#58 | 728,588(0.01%)#1,986 |
| 59. | Mount Airy | 43 | 11,082(0.39%)#59 | 728,588(0.01%)#1,988 |
| 60. | Mount Rainier | 43 | 11,082(0.39%)#60 | 728,588(0.01%)#1,990 |
| 61. | Frostburg | 43 | 11,082(0.39%)#61 | 728,588(0.01%)#1,994 |
| 62. | Bowie | 42 | 11,082(0.38%)#62 | 728,588(0.01%)#2,007 |
| 63. | Takoma Park | 42 | 11,082(0.38%)#63 | 728,588(0.01%)#2,012 |
| 64. | Pikesville | 41 | 11,082(0.37%)#64 | 728,588(0.01%)#2,036 |
| 65. | Eldersburg | 41 | 11,082(0.37%)#65 | 728,588(0.01%)#2,037 |
| 66. | Edgewood | 39 | 11,082(0.35%)#66 | 728,588(0.01%)#2,096 |
| 67. | Damascus | 37 | 11,082(0.33%)#67 | 728,588(0.01%)#2,182 |
| 68. | Aberdeen | 37 | 11,082(0.33%)#68 | 728,588(0.01%)#2,183 |
| 69. | South Kensington | 37 | 11,082(0.33%)#69 | 728,588(0.01%)#2,190 |
| 70. | Brookmont | 37 | 11,082(0.33%)#70 | 728,588(0.01%)#2,195 |
| 71. | Bel Air North | 34 | 11,082(0.31%)#71 | 728,588(0.00%)#2,298 |
| 72. | Woodlawn Cdp Baltimore County | 31 | 11,082(0.28%)#72 | 728,588(0.00%)#2,402 |
| 73. | Reisterstown | 31 | 11,082(0.28%)#73 | 728,588(0.00%)#2,410 |
| 74. | Robinwood | 31 | 11,082(0.28%)#74 | 728,588(0.00%)#2,422 |
| 75. | North Laurel | 29 | 11,082(0.26%)#75 | 728,588(0.00%)#2,485 |
| 76. | Severn | 26 | 11,082(0.23%)#76 | 728,588(0.00%)#2,627 |
| 77. | Kemp Mill | 26 | 11,082(0.23%)#77 | 728,588(0.00%)#2,646 |
| 78. | New Carrollton | 26 | 11,082(0.23%)#78 | 728,588(0.00%)#2,647 |
| 79. | Walker Mill | 26 | 11,082(0.23%)#79 | 728,588(0.00%)#2,651 |
| 80. | Ocean City | 26 | 11,082(0.23%)#80 | 728,588(0.00%)#2,656 |
| 81. | Arden On The Severn | 26 | 11,082(0.23%)#81 | 728,588(0.00%)#2,663 |
| 82. | West Laurel | 25 | 11,082(0.23%)#82 | 728,588(0.00%)#2,702 |
| 83. | Melwood | 25 | 11,082(0.23%)#83 | 728,588(0.00%)#2,704 |
| 84. | Adamstown | 25 | 11,082(0.23%)#84 | 728,588(0.00%)#2,709 |
| 85. | South Laurel | 24 | 11,082(0.22%)#85 | 728,588(0.00%)#2,725 |
| 86. | Mays Chapel | 24 | 11,082(0.22%)#86 | 728,588(0.00%)#2,741 |
| 87. | Pasadena | 23 | 11,082(0.21%)#87 | 728,588(0.00%)#2,786 |
| 88. | Travilah | 23 | 11,082(0.21%)#88 | 728,588(0.00%)#2,806 |
| 89. | La Plata | 22 | 11,082(0.20%)#89 | 728,588(0.00%)#2,869 |
| 90. | Leisure World | 22 | 11,082(0.20%)#90 | 728,588(0.00%)#2,873 |
| 91. | Urbana | 21 | 11,082(0.19%)#91 | 728,588(0.00%)#2,936 |
| 92. | Owings | 21 | 11,082(0.19%)#92 | 728,588(0.00%)#2,965 |
| 93. | Westminster | 20 | 11,082(0.18%)#93 | 728,588(0.00%)#2,986 |
| 94. | Cape St Claire | 20 | 11,082(0.18%)#94 | 728,588(0.00%)#3,008 |
| 95. | Ashton Sandy Spring | 20 | 11,082(0.18%)#95 | 728,588(0.00%)#3,020 |
| 96. | Forest Glen | 19 | 11,082(0.17%)#96 | 728,588(0.00%)#3,089 |
| 97. | Hampton | 19 | 11,082(0.17%)#97 | 728,588(0.00%)#3,097 |
| 98. | Laurel | 18 | 11,082(0.16%)#98 | 728,588(0.00%)#3,134 |
| 99. | Centreville | 18 | 11,082(0.16%)#99 | 728,588(0.00%)#3,177 |
| 100. | Seabrook | 17 | 11,082(0.15%)#100 | 728,588(0.00%)#3,226 |
Common Questions
What are the Top 10 Cities with the Most Immigrants from Southern Europe in Maryland?
Top 10 Cities with the Most Immigrants from Southern Europe in Maryland are:
#1
787
#2
687
#3
405
#4
360
#5
303
#6
276
#7
256
#8
247
#9
243
#10
233
What city has the Most Immigrants from Southern Europe in Maryland?
Baltimore has the Most Immigrants from Southern Europe in Maryland with 787.
What is the Total Immigrants from Southern Europe in the State of Maryland?
Total Immigrants from Southern Europe in Maryland is 11,082.
What is the Total Immigrants from Southern Europe in the United States?
Total Immigrants from Southern Europe in the United States is 728,588.