Cities with the Most Immigrants from Romania in Maryland
RELATED REPORTS & OPTIONS
Romania
Maryland
Compare Cities
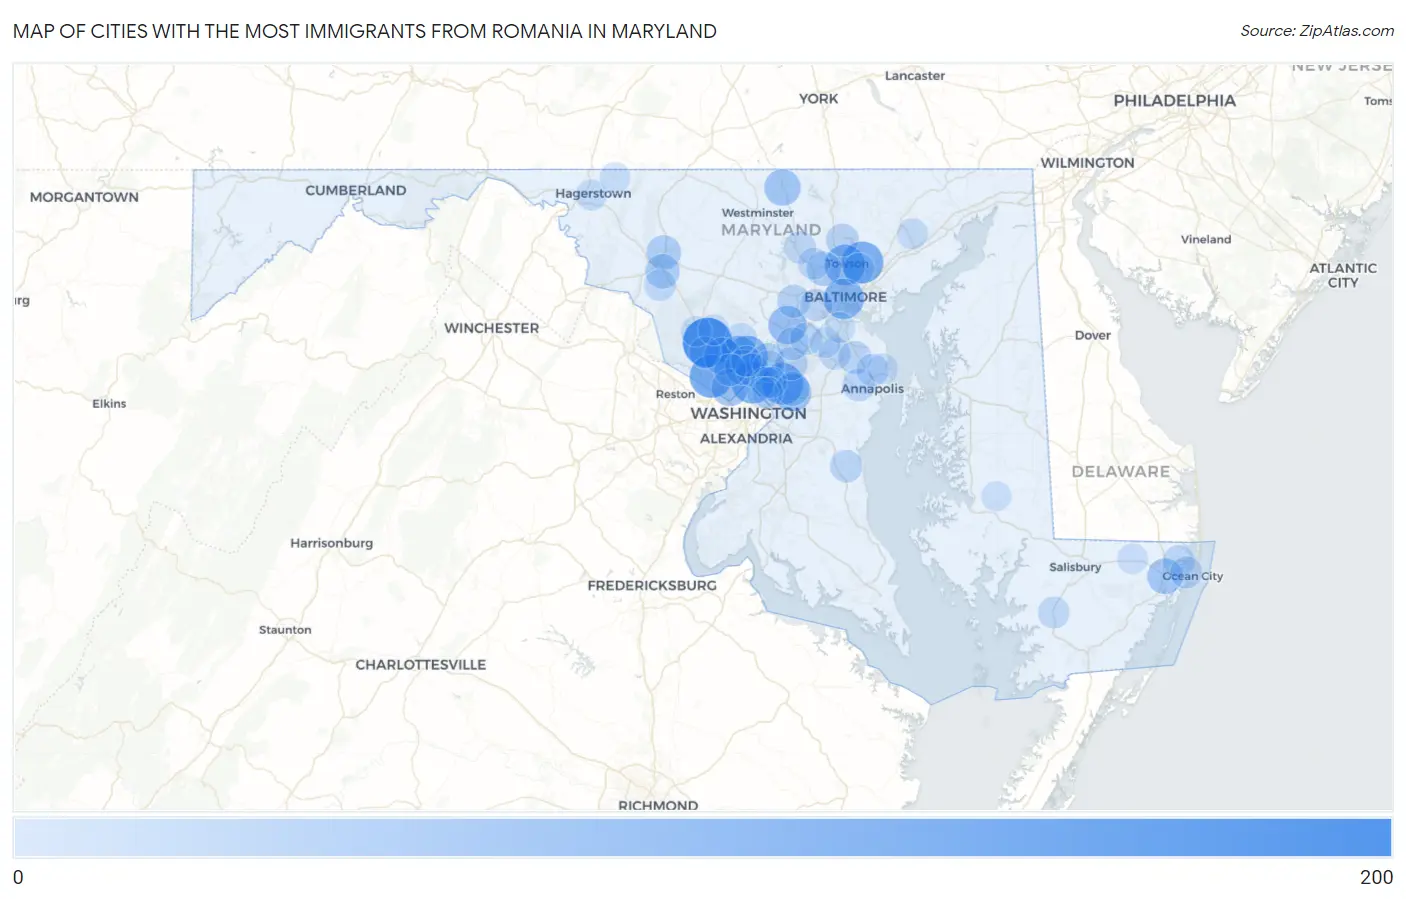
Map of Cities with the Most Immigrants from Romania in Maryland
0
200
Cities with the Most Immigrants from Romania in Maryland
| City | Romania | vs State | vs National | |
| 1. | Gaithersburg | 185 | 2,576(7.18%)#1 | 164,406(0.11%)#112 |
| 2. | Potomac | 122 | 2,576(4.74%)#2 | 164,406(0.07%)#199 |
| 3. | Silver Spring | 111 | 2,576(4.31%)#3 | 164,406(0.07%)#224 |
| 4. | Carney | 110 | 2,576(4.27%)#4 | 164,406(0.07%)#228 |
| 5. | Greenbelt | 109 | 2,576(4.23%)#5 | 164,406(0.07%)#229 |
| 6. | Layhill | 102 | 2,576(3.96%)#6 | 164,406(0.06%)#250 |
| 7. | Towson | 100 | 2,576(3.88%)#7 | 164,406(0.06%)#251 |
| 8. | Baltimore | 98 | 2,576(3.80%)#8 | 164,406(0.06%)#258 |
| 9. | Aspen Hill | 76 | 2,576(2.95%)#9 | 164,406(0.05%)#348 |
| 10. | Columbia | 75 | 2,576(2.91%)#10 | 164,406(0.05%)#353 |
| 11. | Lanham | 72 | 2,576(2.80%)#11 | 164,406(0.04%)#373 |
| 12. | Rockville | 67 | 2,576(2.60%)#12 | 164,406(0.04%)#404 |
| 13. | Bethesda | 66 | 2,576(2.56%)#13 | 164,406(0.04%)#412 |
| 14. | Manchester | 58 | 2,576(2.25%)#14 | 164,406(0.04%)#471 |
| 15. | Berlin | 51 | 2,576(1.98%)#15 | 164,406(0.03%)#541 |
| 16. | Wheaton | 47 | 2,576(1.82%)#16 | 164,406(0.03%)#584 |
| 17. | Frederick | 41 | 2,576(1.59%)#17 | 164,406(0.02%)#658 |
| 18. | Pikesville | 41 | 2,576(1.59%)#18 | 164,406(0.02%)#664 |
| 19. | Ballenger Creek | 41 | 2,576(1.59%)#19 | 164,406(0.02%)#668 |
| 20. | Seabrook | 36 | 2,576(1.40%)#20 | 164,406(0.02%)#761 |
| 21. | Fairland | 34 | 2,576(1.32%)#21 | 164,406(0.02%)#795 |
| 22. | Ellicott City | 27 | 2,576(1.05%)#22 | 164,406(0.02%)#951 |
| 23. | Kemp Mill | 27 | 2,576(1.05%)#23 | 164,406(0.02%)#966 |
| 24. | South Laurel | 25 | 2,576(0.97%)#24 | 164,406(0.02%)#1,014 |
| 25. | Severna Park | 24 | 2,576(0.93%)#25 | 164,406(0.01%)#1,037 |
| 26. | Cockeysville | 24 | 2,576(0.93%)#26 | 164,406(0.01%)#1,043 |
| 27. | Owings | 23 | 2,576(0.89%)#27 | 164,406(0.01%)#1,081 |
| 28. | North Laurel | 22 | 2,576(0.85%)#28 | 164,406(0.01%)#1,095 |
| 29. | Parole | 22 | 2,576(0.85%)#29 | 164,406(0.01%)#1,099 |
| 30. | Jessup | 21 | 2,576(0.82%)#30 | 164,406(0.01%)#1,135 |
| 31. | North Bethesda | 20 | 2,576(0.78%)#31 | 164,406(0.01%)#1,147 |
| 32. | Catonsville | 20 | 2,576(0.78%)#32 | 164,406(0.01%)#1,148 |
| 33. | Reisterstown | 19 | 2,576(0.74%)#33 | 164,406(0.01%)#1,186 |
| 34. | Ocean Pines | 18 | 2,576(0.70%)#34 | 164,406(0.01%)#1,245 |
| 35. | West Ocean City | 18 | 2,576(0.70%)#35 | 164,406(0.01%)#1,254 |
| 36. | Arnold | 17 | 2,576(0.66%)#36 | 164,406(0.01%)#1,273 |
| 37. | Gambrills | 17 | 2,576(0.66%)#37 | 164,406(0.01%)#1,298 |
| 38. | Calverton | 16 | 2,576(0.62%)#38 | 164,406(0.01%)#1,338 |
| 39. | North Potomac | 15 | 2,576(0.58%)#39 | 164,406(0.01%)#1,386 |
| 40. | Princess Anne | 15 | 2,576(0.58%)#40 | 164,406(0.01%)#1,402 |
| 41. | Garrison | 14 | 2,576(0.54%)#41 | 164,406(0.01%)#1,435 |
| 42. | Buckeystown | 14 | 2,576(0.54%)#42 | 164,406(0.01%)#1,442 |
| 43. | Adelphi | 13 | 2,576(0.50%)#43 | 164,406(0.01%)#1,464 |
| 44. | Olney | 12 | 2,576(0.47%)#44 | 164,406(0.01%)#1,508 |
| 45. | Parkville | 12 | 2,576(0.47%)#45 | 164,406(0.01%)#1,509 |
| 46. | College Park | 10 | 2,576(0.39%)#46 | 164,406(0.01%)#1,630 |
| 47. | Severn | 9 | 2,576(0.35%)#47 | 164,406(0.01%)#1,688 |
| 48. | Chillum | 9 | 2,576(0.35%)#48 | 164,406(0.01%)#1,697 |
| 49. | Hyattsville | 9 | 2,576(0.35%)#49 | 164,406(0.01%)#1,705 |
| 50. | Bel Air South | 8 | 2,576(0.31%)#50 | 164,406(0.00%)#1,750 |
| 51. | Hagerstown | 8 | 2,576(0.31%)#51 | 164,406(0.00%)#1,753 |
| 52. | Ferndale | 8 | 2,576(0.31%)#52 | 164,406(0.00%)#1,771 |
| 53. | Green Valley | 8 | 2,576(0.31%)#53 | 164,406(0.00%)#1,777 |
| 54. | Germantown | 7 | 2,576(0.27%)#54 | 164,406(0.00%)#1,824 |
| 55. | Montgomery Village | 7 | 2,576(0.27%)#55 | 164,406(0.00%)#1,833 |
| 56. | Leitersburg | 7 | 2,576(0.27%)#56 | 164,406(0.00%)#1,878 |
| 57. | Glenmont | 5 | 2,576(0.19%)#57 | 164,406(0.00%)#1,953 |
| 58. | Cape St Claire | 5 | 2,576(0.19%)#58 | 164,406(0.00%)#1,962 |
| 59. | Willards | 4 | 2,576(0.16%)#59 | 164,406(0.00%)#2,021 |
| 60. | Secretary | 1 | 2,576(0.04%)#60 | 164,406(0.00%)#2,141 |
Common Questions
What are the Top 10 Cities with the Most Immigrants from Romania in Maryland?
Top 10 Cities with the Most Immigrants from Romania in Maryland are:
#1
185
#2
122
#3
111
#4
110
#5
109
#6
102
#7
100
#8
98
#9
76
#10
75
What city has the Most Immigrants from Romania in Maryland?
Gaithersburg has the Most Immigrants from Romania in Maryland with 185.
What is the Total Immigrants from Romania in the State of Maryland?
Total Immigrants from Romania in Maryland is 2,576.
What is the Total Immigrants from Romania in the United States?
Total Immigrants from Romania in the United States is 164,406.