Cities with the Highest Percentage of Immigrants from Mexico in Maryland
RELATED REPORTS & OPTIONS
Mexico
Maryland
Compare Cities
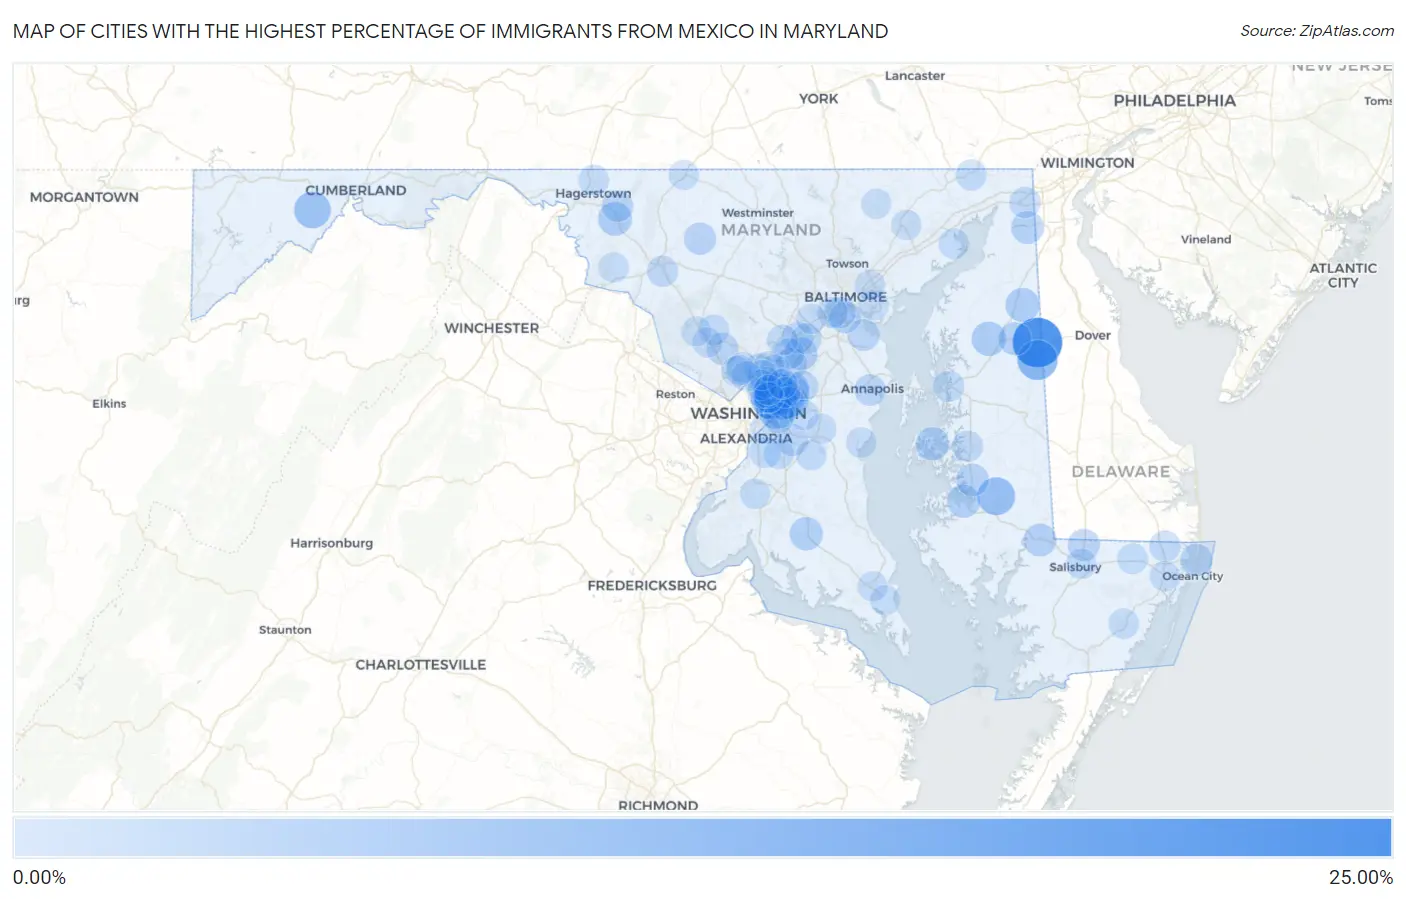
Map of Cities with the Highest Percentage of Immigrants from Mexico in Maryland
0.00%
25.00%
Cities with the Highest Percentage of Immigrants from Mexico in Maryland
| City | Mexico | vs State | vs National | |
| 1. | Templeville | 20.88% | 0.55%(+20.3)#-1 | 3.25%(+17.6)#0 |
| 2. | East Riverdale | 10.75% | 0.55%(+10.2)#0 | 3.25%(+7.49)#1 |
| 3. | Henderson | 10.74% | 0.55%(+10.2)#1 | 3.25%(+7.49)#2 |
| 4. | Riverdale Park | 10.42% | 0.55%(+9.87)#2 | 3.25%(+7.17)#3 |
| 5. | Bladensburg | 9.22% | 0.55%(+8.67)#3 | 3.25%(+5.97)#4 |
| 6. | Secretary | 8.41% | 0.55%(+7.86)#4 | 3.25%(+5.16)#5 |
| 7. | Edmonston | 8.40% | 0.55%(+7.84)#5 | 3.25%(+5.14)#6 |
| 8. | Gilmore | 7.24% | 0.55%(+6.69)#6 | 3.25%(+3.99)#7 |
| 9. | Cottage City | 5.92% | 0.55%(+5.37)#7 | 3.25%(+2.67)#8 |
| 10. | Fairmount Heights | 5.91% | 0.55%(+5.35)#8 | 3.25%(+2.65)#9 |
| 11. | Church Hill | 4.80% | 0.55%(+4.24)#9 | 3.25%(+1.55)#10 |
| 12. | Millington | 4.49% | 0.55%(+3.94)#10 | 3.25%(+1.24)#11 |
| 13. | Mount Lena | 4.37% | 0.55%(+3.82)#11 | 3.25%(+1.12)#12 |
| 14. | Lanham | 3.94% | 0.55%(+3.39)#12 | 3.25%(+0.692)#13 |
| 15. | St Michaels | 3.87% | 0.55%(+3.32)#13 | 3.25%(+0.622)#14 |
| 16. | Charlotte Hall | 3.76% | 0.55%(+3.21)#14 | 3.25%(+0.507)#15 |
| 17. | Colmar Manor | 3.63% | 0.55%(+3.08)#15 | 3.25%(+0.376)#16 |
| 18. | Algonquin | 3.60% | 0.55%(+3.05)#16 | 3.25%(+0.350)#17 |
| 19. | Seabrook | 3.59% | 0.55%(+3.04)#17 | 3.25%(+0.336)#18 |
| 20. | Barclay | 3.43% | 0.55%(+2.88)#18 | 3.25%(+0.177)#19 |
| 21. | Mardela Springs | 3.40% | 0.55%(+2.85)#19 | 3.25%(+0.151)#20 |
| 22. | Landover Hills | 3.40% | 0.55%(+2.85)#20 | 3.25%(+0.147)#21 |
| 23. | Maryland City | 3.35% | 0.55%(+2.80)#21 | 3.25%(+0.100)#22 |
| 24. | Chesapeake City | 3.25% | 0.55%(+2.69)#22 | 3.25%(-0.006)#23 |
| 25. | Trappe | 3.14% | 0.55%(+2.59)#23 | 3.25%(-0.112)#24 |
| 26. | Woodlawn Cdp Prince George S County | 3.07% | 0.55%(+2.52)#24 | 3.25%(-0.178)#25 |
| 27. | Brentwood | 3.01% | 0.55%(+2.46)#25 | 3.25%(-0.238)#26 |
| 28. | Libertytown | 2.75% | 0.55%(+2.19)#26 | 3.25%(-0.507)#27 |
| 29. | Delmar | 2.67% | 0.55%(+2.12)#27 | 3.25%(-0.583)#28 |
| 30. | Ocean City | 2.59% | 0.55%(+2.03)#28 | 3.25%(-0.664)#29 |
| 31. | Melwood | 2.50% | 0.55%(+1.95)#29 | 3.25%(-0.750)#30 |
| 32. | Derwood | 2.49% | 0.55%(+1.93)#30 | 3.25%(-0.765)#31 |
| 33. | Landover | 2.40% | 0.55%(+1.85)#31 | 3.25%(-0.853)#67 |
| 34. | Riviera Beach | 2.28% | 0.55%(+1.72)#32 | 3.25%(-0.975)#68 |
| 35. | Brooklyn Park | 2.25% | 0.55%(+1.70)#33 | 3.25%(-1.00)#69 |
| 36. | Springdale | 2.24% | 0.55%(+1.69)#34 | 3.25%(-1.01)#70 |
| 37. | Baltimore Highlands | 2.14% | 0.55%(+1.59)#35 | 3.25%(-1.11)#71 |
| 38. | South Laurel | 2.09% | 0.55%(+1.53)#36 | 3.25%(-1.17)#72 |
| 39. | Mount Aetna | 2.03% | 0.55%(+1.47)#37 | 3.25%(-1.22)#73 |
| 40. | Annapolis | 2.01% | 0.55%(+1.46)#38 | 3.25%(-1.24)#74 |
| 41. | Savage | 1.87% | 0.55%(+1.32)#39 | 3.25%(-1.38)#75 |
| 42. | Elkton | 1.83% | 0.55%(+1.27)#40 | 3.25%(-1.43)#76 |
| 43. | Glenn Dale | 1.79% | 0.55%(+1.24)#41 | 3.25%(-1.46)#77 |
| 44. | Queenstown | 1.72% | 0.55%(+1.16)#42 | 3.25%(-1.53)#78 |
| 45. | Easton | 1.67% | 0.55%(+1.12)#43 | 3.25%(-1.58)#79 |
| 46. | Bishopville | 1.64% | 0.55%(+1.09)#44 | 3.25%(-1.61)#80 |
| 47. | Ballenger Creek | 1.63% | 0.55%(+1.08)#45 | 3.25%(-1.62)#81 |
| 48. | Laurel | 1.61% | 0.55%(+1.06)#46 | 3.25%(-1.64)#82 |
| 49. | Glenarden | 1.59% | 0.55%(+1.04)#47 | 3.25%(-1.66)#83 |
| 50. | White Oak | 1.54% | 0.55%(+0.984)#48 | 3.25%(-1.72)#84 |
| 51. | Seat Pleasant | 1.50% | 0.55%(+0.944)#49 | 3.25%(-1.76)#85 |
| 52. | Friendly | 1.49% | 0.55%(+0.942)#50 | 3.25%(-1.76)#86 |
| 53. | Hyattsville | 1.49% | 0.55%(+0.934)#51 | 3.25%(-1.77)#87 |
| 54. | Rising Sun | 1.42% | 0.55%(+0.862)#52 | 3.25%(-1.84)#88 |
| 55. | Jessup | 1.41% | 0.55%(+0.853)#53 | 3.25%(-1.85)#89 |
| 56. | Berwyn Heights | 1.36% | 0.55%(+0.806)#54 | 3.25%(-1.89)#90 |
| 57. | Burnt Mills | 1.36% | 0.55%(+0.803)#55 | 3.25%(-1.90)#91 |
| 58. | Lansdowne | 1.34% | 0.55%(+0.787)#56 | 3.25%(-1.91)#92 |
| 59. | Capitol Heights | 1.34% | 0.55%(+0.786)#57 | 3.25%(-1.91)#93 |
| 60. | Beltsville | 1.33% | 0.55%(+0.782)#58 | 3.25%(-1.92)#94 |
| 61. | Wheaton | 1.30% | 0.55%(+0.747)#59 | 3.25%(-1.95)#95 |
| 62. | Scaggsville | 1.28% | 0.55%(+0.726)#60 | 3.25%(-1.97)#96 |
| 63. | Chillum | 1.21% | 0.55%(+0.659)#61 | 3.25%(-2.04)#97 |
| 64. | Flower Hill | 1.21% | 0.55%(+0.657)#62 | 3.25%(-2.04)#98 |
| 65. | Adelphi | 1.19% | 0.55%(+0.639)#63 | 3.25%(-2.06)#99 |
| 66. | Montgomery Village | 1.17% | 0.55%(+0.618)#64 | 3.25%(-2.08)#100 |
| 67. | Aberdeen Proving Ground | 1.15% | 0.55%(+0.594)#65 | 3.25%(-2.11)#101 |
| 68. | Willards | 1.12% | 0.55%(+0.567)#66 | 3.25%(-2.13)#102 |
| 69. | Fountainhead Orchard Hills | 1.10% | 0.55%(+0.544)#67 | 3.25%(-2.15)#103 |
| 70. | Croom | 1.09% | 0.55%(+0.538)#68 | 3.25%(-2.16)#104 |
| 71. | Kettering | 1.07% | 0.55%(+0.514)#69 | 3.25%(-2.19)#105 |
| 72. | New Carrollton | 1.06% | 0.55%(+0.508)#70 | 3.25%(-2.19)#106 |
| 73. | Calverton | 1.02% | 0.55%(+0.468)#71 | 3.25%(-2.23)#107 |
| 74. | Snow Hill | 1.02% | 0.55%(+0.465)#72 | 3.25%(-2.23)#108 |
| 75. | Bensville | 1.01% | 0.55%(+0.454)#73 | 3.25%(-2.25)#109 |
| 76. | Clinton | 1.00% | 0.55%(+0.447)#74 | 3.25%(-2.25)#110 |
| 77. | Langley Park | 0.97% | 0.55%(+0.416)#75 | 3.25%(-2.28)#111 |
| 78. | North Brentwood | 0.91% | 0.55%(+0.361)#76 | 3.25%(-2.34)#112 |
| 79. | Salisbury | 0.88% | 0.55%(+0.324)#77 | 3.25%(-2.38)#113 |
| 80. | Garrett Park | 0.86% | 0.55%(+0.305)#78 | 3.25%(-2.39)#114 |
| 81. | Deale | 0.85% | 0.55%(+0.297)#79 | 3.25%(-2.40)#115 |
| 82. | Bel Air | 0.84% | 0.55%(+0.284)#80 | 3.25%(-2.41)#116 |
| 83. | Ilchester | 0.83% | 0.55%(+0.279)#81 | 3.25%(-2.42)#117 |
| 84. | Marlboro Meadows | 0.83% | 0.55%(+0.272)#82 | 3.25%(-2.43)#118 |
| 85. | Dundalk | 0.81% | 0.55%(+0.255)#83 | 3.25%(-2.44)#119 |
| 86. | Hillandale | 0.80% | 0.55%(+0.247)#84 | 3.25%(-2.45)#120 |
| 87. | California | 0.78% | 0.55%(+0.225)#85 | 3.25%(-2.47)#121 |
| 88. | Rosedale | 0.77% | 0.55%(+0.220)#86 | 3.25%(-2.48)#122 |
| 89. | Lexington Park | 0.75% | 0.55%(+0.201)#87 | 3.25%(-2.50)#123 |
| 90. | Berlin | 0.75% | 0.55%(+0.199)#88 | 3.25%(-2.50)#124 |
| 91. | Jarrettsville | 0.75% | 0.55%(+0.194)#89 | 3.25%(-2.50)#125 |
| 92. | Hillcrest Heights | 0.74% | 0.55%(+0.188)#90 | 3.25%(-2.51)#126 |
| 93. | Emmitsburg | 0.71% | 0.55%(+0.157)#91 | 3.25%(-2.54)#127 |
| 94. | Gaithersburg | 0.70% | 0.55%(+0.151)#92 | 3.25%(-2.55)#128 |
| 95. | Forest Glen | 0.70% | 0.55%(+0.147)#93 | 3.25%(-2.55)#129 |
| 96. | Burkittsville | 0.70% | 0.55%(+0.146)#94 | 3.25%(-2.55)#130 |
| 97. | University Park | 0.69% | 0.55%(+0.137)#95 | 3.25%(-2.56)#131 |
| 98. | Greenbelt | 0.67% | 0.55%(+0.121)#96 | 3.25%(-2.58)#132 |
| 99. | North Kensington | 0.67% | 0.55%(+0.120)#97 | 3.25%(-2.58)#133 |
| 100. | Germantown | 0.66% | 0.55%(+0.106)#98 | 3.25%(-2.59)#134 |
Common Questions
What are the Top 10 Cities with the Highest Percentage of Immigrants from Mexico in Maryland?
Top 10 Cities with the Highest Percentage of Immigrants from Mexico in Maryland are:
#1
20.88%
#2
10.75%
#3
10.74%
#4
10.42%
#5
9.22%
#6
8.41%
#7
8.40%
#8
7.24%
#9
5.92%
#10
5.91%
What city has the Highest Percentage of Immigrants from Mexico in Maryland?
Templeville has the Highest Percentage of Immigrants from Mexico in Maryland with 20.88%.
What is the Percentage of Immigrants from Mexico in the State of Maryland?
Percentage of Immigrants from Mexico in Maryland is 0.55%.
What is the Percentage of Immigrants from Mexico in the United States?
Percentage of Immigrants from Mexico in the United States is 3.25%.