Cities with the Highest Percentage of Immigrants from Kenya in Maryland
RELATED REPORTS & OPTIONS
Kenya
Maryland
Compare Cities
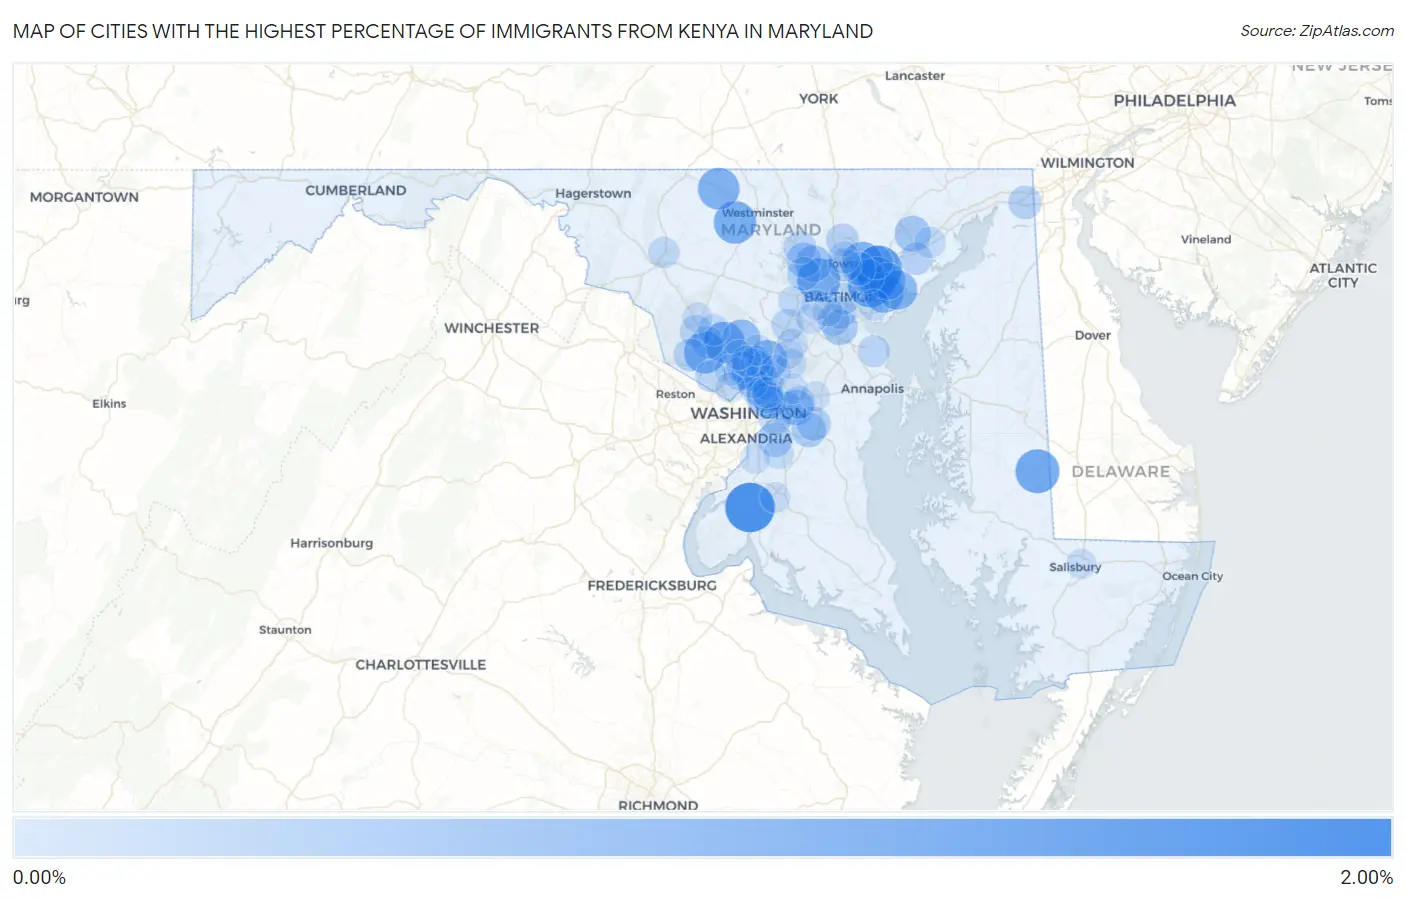
Map of Cities with the Highest Percentage of Immigrants from Kenya in Maryland
0.00%
2.00%
Cities with the Highest Percentage of Immigrants from Kenya in Maryland
| City | Kenya | vs State | vs National | |
| 1. | Pomfret | 1.71% | 0.12%(+1.58)#159 | 0.048%(+1.66)#1,118 |
| 2. | White Marsh | 1.41% | 0.12%(+1.29)#160 | 0.048%(+1.36)#1,119 |
| 3. | Rosedale | 1.26% | 0.12%(+1.13)#161 | 0.048%(+1.21)#1,120 |
| 4. | Federalsburg | 1.21% | 0.12%(+1.08)#162 | 0.048%(+1.16)#1,121 |
| 5. | Lochearn | 1.14% | 0.12%(+1.02)#163 | 0.048%(+1.09)#1,122 |
| 6. | New Windsor | 1.07% | 0.12%(+0.952)#187 | 0.048%(+1.03)#1,827 |
| 7. | North Potomac | 1.04% | 0.12%(+0.919)#188 | 0.048%(+0.993)#1,828 |
| 8. | Kemp Mill | 1.02% | 0.12%(+0.900)#189 | 0.048%(+0.974)#1,829 |
| 9. | Taneytown | 1.01% | 0.12%(+0.887)#190 | 0.048%(+0.961)#1,830 |
| 10. | Redland | 1.00% | 0.12%(+0.876)#191 | 0.048%(+0.950)#1,831 |
| 11. | Carney | 0.97% | 0.12%(+0.849)#192 | 0.048%(+0.923)#1,832 |
| 12. | Rossville | 0.95% | 0.12%(+0.833)#193 | 0.048%(+0.907)#1,833 |
| 13. | Essex | 0.88% | 0.12%(+0.755)#194 | 0.048%(+0.829)#1,834 |
| 14. | Fairland | 0.83% | 0.12%(+0.710)#195 | 0.048%(+0.783)#1,835 |
| 15. | Bowleys Quarters | 0.82% | 0.12%(+0.694)#196 | 0.048%(+0.767)#1,836 |
| 16. | Olney | 0.72% | 0.12%(+0.593)#197 | 0.048%(+0.667)#1,837 |
| 17. | Middle River | 0.60% | 0.12%(+0.482)#198 | 0.048%(+0.556)#1,838 |
| 18. | Garrison | 0.56% | 0.12%(+0.442)#199 | 0.048%(+0.515)#1,839 |
| 19. | Mount Rainier | 0.54% | 0.12%(+0.423)#200 | 0.048%(+0.497)#1,840 |
| 20. | Bel Air South | 0.53% | 0.12%(+0.404)#201 | 0.048%(+0.477)#1,841 |
| 21. | Lake Arbor | 0.46% | 0.12%(+0.341)#202 | 0.048%(+0.415)#1,842 |
| 22. | Ferndale | 0.46% | 0.12%(+0.334)#203 | 0.048%(+0.408)#1,843 |
| 23. | Owings Mills | 0.40% | 0.12%(+0.281)#204 | 0.048%(+0.355)#1,844 |
| 24. | Marlboro Village | 0.39% | 0.12%(+0.273)#205 | 0.048%(+0.347)#1,845 |
| 25. | Adelphi | 0.37% | 0.12%(+0.250)#206 | 0.048%(+0.324)#1,846 |
| 26. | Camp Springs | 0.37% | 0.12%(+0.248)#207 | 0.048%(+0.322)#1,847 |
| 27. | Burnt Mills | 0.36% | 0.12%(+0.240)#208 | 0.048%(+0.314)#1,848 |
| 28. | Overlea | 0.35% | 0.12%(+0.230)#209 | 0.048%(+0.304)#1,849 |
| 29. | Summerfield | 0.35% | 0.12%(+0.223)#210 | 0.048%(+0.297)#1,850 |
| 30. | Brock Hall | 0.34% | 0.12%(+0.214)#211 | 0.048%(+0.287)#1,851 |
| 31. | Perry Hall | 0.32% | 0.12%(+0.196)#212 | 0.048%(+0.270)#1,852 |
| 32. | Takoma Park | 0.31% | 0.12%(+0.186)#213 | 0.048%(+0.260)#1,853 |
| 33. | Parkville | 0.29% | 0.12%(+0.173)#214 | 0.048%(+0.247)#1,854 |
| 34. | Elkton | 0.29% | 0.12%(+0.169)#243 | 0.048%(+0.243)#4,494 |
| 35. | Randallstown | 0.27% | 0.12%(+0.152)#244 | 0.048%(+0.225)#4,495 |
| 36. | Kensington | 0.27% | 0.12%(+0.146)#245 | 0.048%(+0.220)#4,496 |
| 37. | Chillum | 0.25% | 0.12%(+0.132)#246 | 0.048%(+0.206)#4,497 |
| 38. | Towson | 0.24% | 0.12%(+0.123)#247 | 0.048%(+0.197)#4,498 |
| 39. | Cockeysville | 0.24% | 0.12%(+0.119)#248 | 0.048%(+0.193)#4,499 |
| 40. | Mitchellville | 0.24% | 0.12%(+0.118)#249 | 0.048%(+0.192)#4,500 |
| 41. | Baltimore Highlands | 0.23% | 0.12%(+0.112)#250 | 0.048%(+0.186)#4,501 |
| 42. | Germantown | 0.23% | 0.12%(+0.110)#251 | 0.048%(+0.184)#4,502 |
| 43. | Gaithersburg | 0.23% | 0.12%(+0.106)#252 | 0.048%(+0.180)#4,503 |
| 44. | Darnestown | 0.22% | 0.12%(+0.103)#253 | 0.048%(+0.177)#4,504 |
| 45. | Reisterstown | 0.22% | 0.12%(+0.096)#254 | 0.048%(+0.169)#4,505 |
| 46. | Edgewood | 0.22% | 0.12%(+0.093)#255 | 0.048%(+0.167)#4,506 |
| 47. | Coral Hills | 0.21% | 0.12%(+0.091)#256 | 0.048%(+0.165)#4,507 |
| 48. | Columbia | 0.21% | 0.12%(+0.086)#257 | 0.048%(+0.159)#4,508 |
| 49. | Colmar Manor | 0.20% | 0.12%(+0.076)#258 | 0.048%(+0.150)#4,509 |
| 50. | Lutherville | 0.17% | 0.12%(+0.045)#259 | 0.048%(+0.119)#4,510 |
| 51. | Lake Shore | 0.16% | 0.12%(+0.043)#260 | 0.048%(+0.116)#4,511 |
| 52. | Linthicum | 0.16% | 0.12%(+0.037)#261 | 0.048%(+0.111)#4,938 |
| 53. | Baltimore | 0.15% | 0.12%(+0.027)#262 | 0.048%(+0.101)#4,939 |
| 54. | Potomac | 0.15% | 0.12%(+0.025)#263 | 0.048%(+0.098)#4,940 |
| 55. | Wheaton | 0.14% | 0.12%(+0.022)#264 | 0.048%(+0.096)#4,941 |
| 56. | Frederick | 0.13% | 0.12%(+0.011)#265 | 0.048%(+0.085)#4,942 |
| 57. | Brentwood | 0.13% | 0.12%(+0.011)#266 | 0.048%(+0.084)#4,943 |
| 58. | Silver Spring | 0.12% | 0.12%(+0.002)#267 | 0.048%(+0.076)#4,944 |
| 59. | Flower Hill | 0.12% | 0.12%(+0.001)#268 | 0.048%(+0.075)#4,945 |
| 60. | Riverside | 0.12% | 0.12%(-0.004)#269 | 0.048%(+0.070)#4,946 |
| 61. | Montgomery Village | 0.12% | 0.12%(-0.007)#270 | 0.048%(+0.067)#4,947 |
| 62. | Woodlawn Cdp Baltimore County | 0.11% | 0.12%(-0.013)#271 | 0.048%(+0.061)#4,948 |
| 63. | Dundalk | 0.093% | 0.12%(-0.028)#272 | 0.048%(+0.046)#4,949 |
| 64. | Hyattsville | 0.091% | 0.12%(-0.031)#273 | 0.048%(+0.043)#4,950 |
| 65. | Colesville | 0.088% | 0.12%(-0.034)#274 | 0.048%(+0.040)#4,951 |
| 66. | Ellicott City | 0.086% | 0.12%(-0.036)#275 | 0.048%(+0.038)#4,952 |
| 67. | Cloverly | 0.085% | 0.12%(-0.036)#276 | 0.048%(+0.037)#4,953 |
| 68. | North Bethesda | 0.072% | 0.12%(-0.049)#277 | 0.048%(+0.024)#4,954 |
| 69. | North Laurel | 0.070% | 0.12%(-0.052)#278 | 0.048%(+0.022)#4,955 |
| 70. | Beltsville | 0.066% | 0.12%(-0.056)#279 | 0.048%(+0.018)#4,956 |
| 71. | Ilchester | 0.059% | 0.12%(-0.063)#280 | 0.048%(+0.011)#4,957 |
| 72. | Glenmont | 0.048% | 0.12%(-0.074)#281 | 0.048%(+0.000)#4,958 |
| 73. | Clinton | 0.047% | 0.12%(-0.074)#282 | 0.048%(-0.001)#4,959 |
| 74. | Waldorf | 0.043% | 0.12%(-0.079)#283 | 0.048%(-0.005)#4,960 |
| 75. | Fort Washington | 0.039% | 0.12%(-0.083)#284 | 0.048%(-0.009)#4,961 |
| 76. | Seabrook | 0.036% | 0.12%(-0.086)#285 | 0.048%(-0.012)#4,962 |
| 77. | Clarksburg | 0.028% | 0.12%(-0.093)#286 | 0.048%(-0.020)#4,963 |
| 78. | South Laurel | 0.025% | 0.12%(-0.097)#287 | 0.048%(-0.023)#4,964 |
| 79. | Salisbury | 0.024% | 0.12%(-0.097)#288 | 0.048%(-0.024)#4,965 |
| 80. | Aspen Hill | 0.022% | 0.12%(-0.100)#289 | 0.048%(-0.026)#4,966 |
| 81. | Catonsville | 0.016% | 0.12%(-0.105)#290 | 0.048%(-0.032)#4,967 |
| 82. | Arbutus | 0.015% | 0.12%(-0.107)#291 | 0.048%(-0.033)#4,968 |
| 83. | Bowie | 0.014% | 0.12%(-0.108)#292 | 0.048%(-0.034)#4,969 |
| 84. | Bethesda | 0.012% | 0.12%(-0.110)#293 | 0.048%(-0.036)#4,970 |
| 85. | Green Valley | 0.0077% | 0.12%(-0.114)#294 | 0.048%(-0.040)#4,971 |
| 86. | Laurel | 0.0034% | 0.12%(-0.118)#295 | 0.048%(-0.045)#4,972 |
Common Questions
What are the Top 10 Cities with the Highest Percentage of Immigrants from Kenya in Maryland?
Top 10 Cities with the Highest Percentage of Immigrants from Kenya in Maryland are:
#1
1.71%
#2
1.41%
#3
1.26%
#4
1.21%
#5
1.14%
#6
1.07%
#7
1.04%
#8
1.02%
#9
1.01%
#10
1.00%
What city has the Highest Percentage of Immigrants from Kenya in Maryland?
Pomfret has the Highest Percentage of Immigrants from Kenya in Maryland with 1.71%.
What is the Percentage of Immigrants from Kenya in the State of Maryland?
Percentage of Immigrants from Kenya in Maryland is 0.12%.
What is the Percentage of Immigrants from Kenya in the United States?
Percentage of Immigrants from Kenya in the United States is 0.048%.