Cities with the Highest Percentage of Immigrants from Ethiopia in Maryland
RELATED REPORTS & OPTIONS
Ethiopia
Maryland
Compare Cities
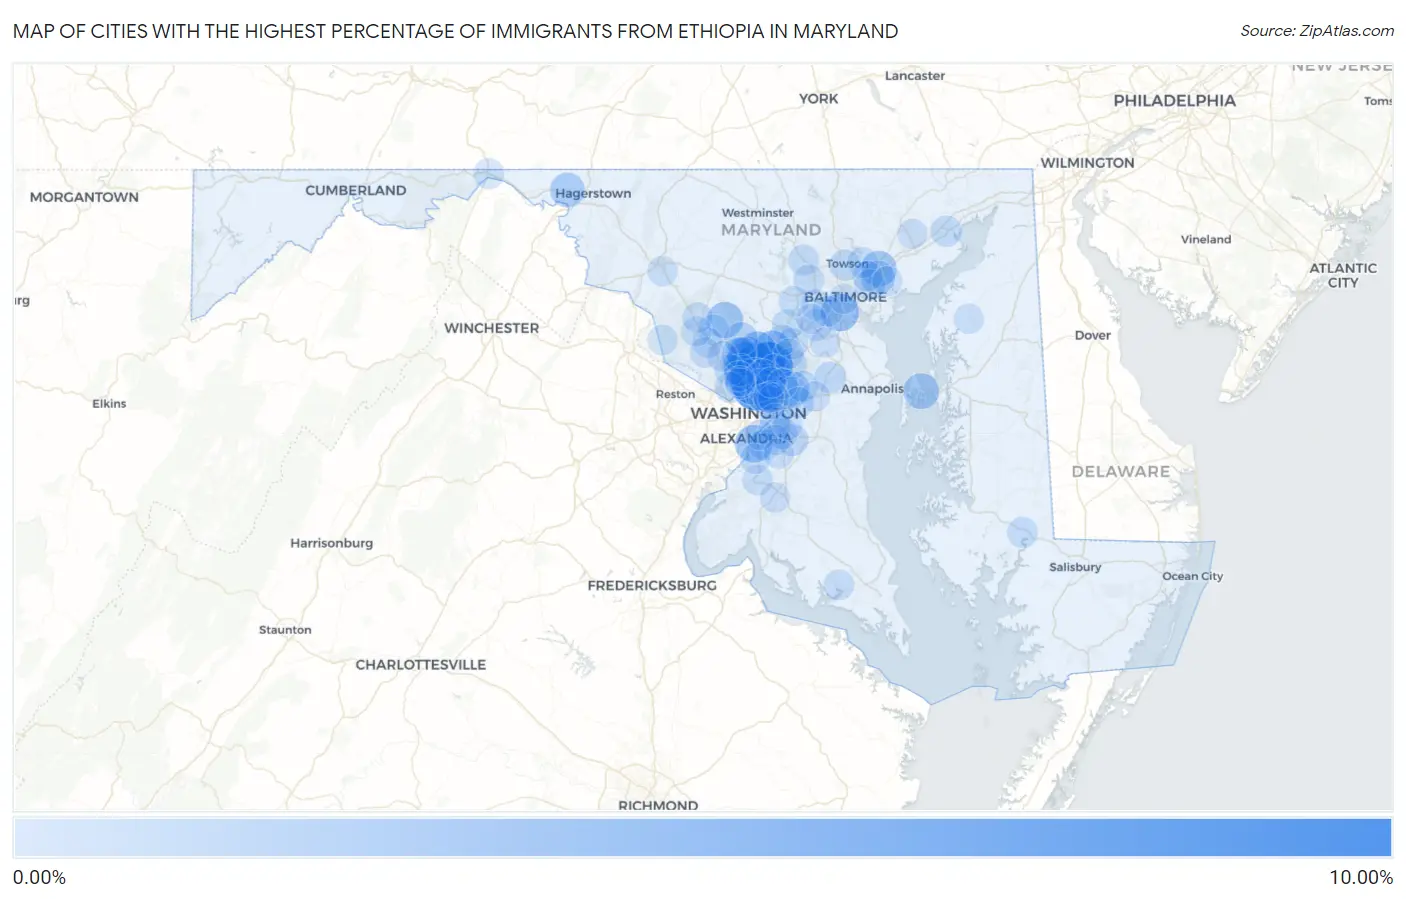
Map of Cities with the Highest Percentage of Immigrants from Ethiopia in Maryland
0.00%
10.00%
Cities with the Highest Percentage of Immigrants from Ethiopia in Maryland
| City | Ethiopia | vs State | vs National | |
| 1. | White Oak | 9.17% | 0.50%(+8.67)#-1 | 0.083%(+9.08)#0 |
| 2. | Calverton | 8.50% | 0.50%(+8.00)#0 | 0.083%(+8.41)#1 |
| 3. | Takoma Park | 7.54% | 0.50%(+7.04)#1 | 0.083%(+7.45)#2 |
| 4. | Silver Spring | 6.51% | 0.50%(+6.01)#2 | 0.083%(+6.43)#3 |
| 5. | Kemp Mill | 6.34% | 0.50%(+5.84)#3 | 0.083%(+6.26)#4 |
| 6. | Burnt Mills | 6.24% | 0.50%(+5.74)#4 | 0.083%(+6.15)#5 |
| 7. | Layhill | 4.19% | 0.50%(+3.69)#5 | 0.083%(+4.11)#6 |
| 8. | Glenmont | 4.15% | 0.50%(+3.65)#6 | 0.083%(+4.07)#7 |
| 9. | Burtonsville | 3.96% | 0.50%(+3.46)#8 | 0.083%(+3.88)#246 |
| 10. | Wheaton | 3.93% | 0.50%(+3.43)#27 | 0.083%(+3.85)#775 |
| 11. | Colesville | 3.76% | 0.50%(+3.26)#28 | 0.083%(+3.67)#776 |
| 12. | Baltimore Highlands | 3.60% | 0.50%(+3.10)#29 | 0.083%(+3.51)#777 |
| 13. | National Harbor | 3.44% | 0.50%(+2.94)#30 | 0.083%(+3.36)#778 |
| 14. | Fairland | 3.39% | 0.50%(+2.89)#31 | 0.083%(+3.30)#779 |
| 15. | Cloverly | 3.33% | 0.50%(+2.83)#32 | 0.083%(+3.25)#780 |
| 16. | Laytonsville | 2.85% | 0.50%(+2.35)#33 | 0.083%(+2.77)#781 |
| 17. | Adelphi | 2.83% | 0.50%(+2.33)#34 | 0.083%(+2.74)#782 |
| 18. | Chillum | 2.71% | 0.50%(+2.21)#35 | 0.083%(+2.62)#783 |
| 19. | White Marsh | 2.66% | 0.50%(+2.16)#36 | 0.083%(+2.58)#784 |
| 20. | Chester | 2.65% | 0.50%(+2.15)#37 | 0.083%(+2.56)#785 |
| 21. | Wilson Conococheague | 2.18% | 0.50%(+1.68)#38 | 0.083%(+2.10)#786 |
| 22. | Aspen Hill | 2.08% | 0.50%(+1.58)#39 | 0.083%(+1.99)#787 |
| 23. | Four Corners | 2.05% | 0.50%(+1.55)#40 | 0.083%(+1.96)#788 |
| 24. | Forest Glen | 2.04% | 0.50%(+1.54)#41 | 0.083%(+1.96)#789 |
| 25. | Seabrook | 2.01% | 0.50%(+1.51)#42 | 0.083%(+1.93)#790 |
| 26. | Rossville | 1.77% | 0.50%(+1.27)#43 | 0.083%(+1.69)#791 |
| 27. | Olney | 1.47% | 0.50%(+0.969)#44 | 0.083%(+1.39)#792 |
| 28. | Hyattsville | 1.41% | 0.50%(+0.904)#45 | 0.083%(+1.32)#793 |
| 29. | Langley Park | 1.20% | 0.50%(+0.702)#46 | 0.083%(+1.12)#794 |
| 30. | Colmar Manor | 1.19% | 0.50%(+0.686)#47 | 0.083%(+1.10)#795 |
| 31. | North Kensington | 1.12% | 0.50%(+0.620)#48 | 0.083%(+1.04)#796 |
| 32. | New Carrollton | 1.10% | 0.50%(+0.596)#49 | 0.083%(+1.01)#797 |
| 33. | Beltsville | 0.98% | 0.50%(+0.484)#50 | 0.083%(+0.901)#798 |
| 34. | Melwood | 0.90% | 0.50%(+0.401)#51 | 0.083%(+0.818)#799 |
| 35. | Hillandale | 0.82% | 0.50%(+0.319)#52 | 0.083%(+0.736)#800 |
| 36. | Crofton | 0.77% | 0.50%(+0.272)#53 | 0.083%(+0.690)#801 |
| 37. | Elkridge | 0.73% | 0.50%(+0.228)#54 | 0.083%(+0.645)#802 |
| 38. | South Laurel | 0.69% | 0.50%(+0.188)#55 | 0.083%(+0.606)#803 |
| 39. | Suitland | 0.69% | 0.50%(+0.184)#56 | 0.083%(+0.602)#804 |
| 40. | Aberdeen | 0.66% | 0.50%(+0.163)#57 | 0.083%(+0.581)#805 |
| 41. | Lanham | 0.66% | 0.50%(+0.159)#58 | 0.083%(+0.577)#806 |
| 42. | Towson | 0.65% | 0.50%(+0.153)#59 | 0.083%(+0.571)#807 |
| 43. | North Laurel | 0.63% | 0.50%(+0.130)#60 | 0.083%(+0.548)#808 |
| 44. | Columbia | 0.62% | 0.50%(+0.118)#61 | 0.083%(+0.536)#809 |
| 45. | Glenn Dale | 0.62% | 0.50%(+0.116)#62 | 0.083%(+0.533)#810 |
| 46. | Edmonston | 0.57% | 0.50%(+0.070)#63 | 0.083%(+0.488)#811 |
| 47. | North Bethesda | 0.55% | 0.50%(+0.052)#64 | 0.083%(+0.469)#812 |
| 48. | Owings Mills | 0.52% | 0.50%(+0.019)#65 | 0.083%(+0.437)#813 |
| 49. | Carney | 0.52% | 0.50%(+0.017)#66 | 0.083%(+0.435)#814 |
| 50. | Bethesda | 0.51% | 0.50%(+0.013)#67 | 0.083%(+0.431)#815 |
| 51. | Vienna | 0.49% | 0.50%(-0.008)#68 | 0.083%(+0.409)#816 |
| 52. | Montgomery Village | 0.48% | 0.50%(-0.018)#69 | 0.083%(+0.400)#817 |
| 53. | Oxon Hill | 0.48% | 0.50%(-0.021)#70 | 0.083%(+0.397)#818 |
| 54. | Rosedale | 0.48% | 0.50%(-0.022)#71 | 0.083%(+0.395)#819 |
| 55. | Catonsville | 0.47% | 0.50%(-0.026)#72 | 0.083%(+0.391)#820 |
| 56. | Milford Mill | 0.46% | 0.50%(-0.038)#73 | 0.083%(+0.380)#821 |
| 57. | Green Valley | 0.45% | 0.50%(-0.046)#74 | 0.083%(+0.371)#822 |
| 58. | Mitchellville | 0.45% | 0.50%(-0.055)#75 | 0.083%(+0.363)#823 |
| 59. | Scaggsville | 0.43% | 0.50%(-0.075)#76 | 0.083%(+0.343)#824 |
| 60. | Arbutus | 0.42% | 0.50%(-0.084)#77 | 0.083%(+0.334)#825 |
| 61. | Leisure World | 0.41% | 0.50%(-0.089)#78 | 0.083%(+0.329)#826 |
| 62. | Morningside | 0.39% | 0.50%(-0.115)#79 | 0.083%(+0.303)#827 |
| 63. | Gaithersburg | 0.38% | 0.50%(-0.120)#80 | 0.083%(+0.298)#828 |
| 64. | Hancock | 0.38% | 0.50%(-0.122)#81 | 0.083%(+0.296)#829 |
| 65. | Mount Rainier | 0.38% | 0.50%(-0.126)#82 | 0.083%(+0.292)#830 |
| 66. | Greenbelt | 0.37% | 0.50%(-0.128)#83 | 0.083%(+0.290)#831 |
| 67. | Bladensburg | 0.37% | 0.50%(-0.135)#84 | 0.083%(+0.282)#832 |
| 68. | Leonardtown | 0.35% | 0.50%(-0.152)#85 | 0.083%(+0.266)#833 |
| 69. | Flower Hill | 0.33% | 0.50%(-0.173)#86 | 0.083%(+0.245)#834 |
| 70. | Overlea | 0.32% | 0.50%(-0.181)#87 | 0.083%(+0.237)#835 |
| 71. | Rockville | 0.31% | 0.50%(-0.190)#88 | 0.083%(+0.228)#837 |
| 72. | North Potomac | 0.30% | 0.50%(-0.197)#89 | 0.083%(+0.221)#838 |
| 73. | Accokeek | 0.30% | 0.50%(-0.203)#90 | 0.083%(+0.215)#839 |
| 74. | Ellicott City | 0.29% | 0.50%(-0.216)#91 | 0.083%(+0.202)#840 |
| 75. | Chevy Chase | 0.28% | 0.50%(-0.225)#92 | 0.083%(+0.193)#841 |
| 76. | Coral Hills | 0.27% | 0.50%(-0.235)#93 | 0.083%(+0.182)#842 |
| 77. | Clarksburg | 0.26% | 0.50%(-0.236)#94 | 0.083%(+0.181)#843 |
| 78. | North Brentwood | 0.26% | 0.50%(-0.240)#95 | 0.083%(+0.178)#844 |
| 79. | Fort Washington | 0.26% | 0.50%(-0.242)#96 | 0.083%(+0.176)#845 |
| 80. | Germantown | 0.26% | 0.50%(-0.243)#97 | 0.083%(+0.175)#846 |
| 81. | Poolesville | 0.25% | 0.50%(-0.255)#98 | 0.083%(+0.163)#847 |
| 82. | Ballenger Creek | 0.22% | 0.50%(-0.283)#99 | 0.083%(+0.135)#848 |
| 83. | College Park | 0.21% | 0.50%(-0.295)#100 | 0.083%(+0.123)#849 |
| 84. | South Kensington | 0.20% | 0.50%(-0.298)#101 | 0.083%(+0.120)#850 |
| 85. | Chestertown | 0.18% | 0.50%(-0.320)#102 | 0.083%(+0.098)#851 |
| 86. | Waldorf | 0.18% | 0.50%(-0.321)#103 | 0.083%(+0.097)#852 |
| 87. | Glassmanor | 0.17% | 0.50%(-0.328)#104 | 0.083%(+0.090)#853 |
| 88. | Woodlawn Cdp Baltimore County | 0.17% | 0.50%(-0.328)#105 | 0.083%(+0.090)#854 |
| 89. | Camp Springs | 0.16% | 0.50%(-0.338)#106 | 0.083%(+0.080)#855 |
| 90. | Clinton | 0.16% | 0.50%(-0.339)#107 | 0.083%(+0.078)#856 |
| 91. | Middle River | 0.16% | 0.50%(-0.344)#108 | 0.083%(+0.074)#857 |
| 92. | Baltimore | 0.15% | 0.50%(-0.351)#109 | 0.083%(+0.067)#899 |
| 93. | North Chevy Chase | 0.15% | 0.50%(-0.354)#110 | 0.083%(+0.064)#900 |
| 94. | Ilchester | 0.15% | 0.50%(-0.354)#111 | 0.083%(+0.063)#901 |
| 95. | Forestville | 0.15% | 0.50%(-0.355)#112 | 0.083%(+0.063)#902 |
| 96. | Bowie | 0.14% | 0.50%(-0.359)#113 | 0.083%(+0.058)#903 |
| 97. | Severn | 0.14% | 0.50%(-0.363)#114 | 0.083%(+0.055)#904 |
| 98. | Laurel | 0.13% | 0.50%(-0.373)#115 | 0.083%(+0.045)#905 |
| 99. | Honeygo | 0.11% | 0.50%(-0.393)#116 | 0.083%(+0.025)#906 |
| 100. | Bel Air South | 0.11% | 0.50%(-0.394)#117 | 0.083%(+0.024)#907 |
Common Questions
What are the Top 10 Cities with the Highest Percentage of Immigrants from Ethiopia in Maryland?
Top 10 Cities with the Highest Percentage of Immigrants from Ethiopia in Maryland are:
#1
9.17%
#2
8.50%
#3
7.54%
#4
6.51%
#5
6.34%
#6
4.19%
#7
4.15%
#8
3.96%
#9
3.93%
#10
3.76%
What city has the Highest Percentage of Immigrants from Ethiopia in Maryland?
White Oak has the Highest Percentage of Immigrants from Ethiopia in Maryland with 9.17%.
What is the Percentage of Immigrants from Ethiopia in the State of Maryland?
Percentage of Immigrants from Ethiopia in Maryland is 0.50%.
What is the Percentage of Immigrants from Ethiopia in the United States?
Percentage of Immigrants from Ethiopia in the United States is 0.083%.