Cities with the Highest Percentage of Immigrants from Northern Europe in Missouri
RELATED REPORTS & OPTIONS
Northern Europe
Missouri
Compare Cities
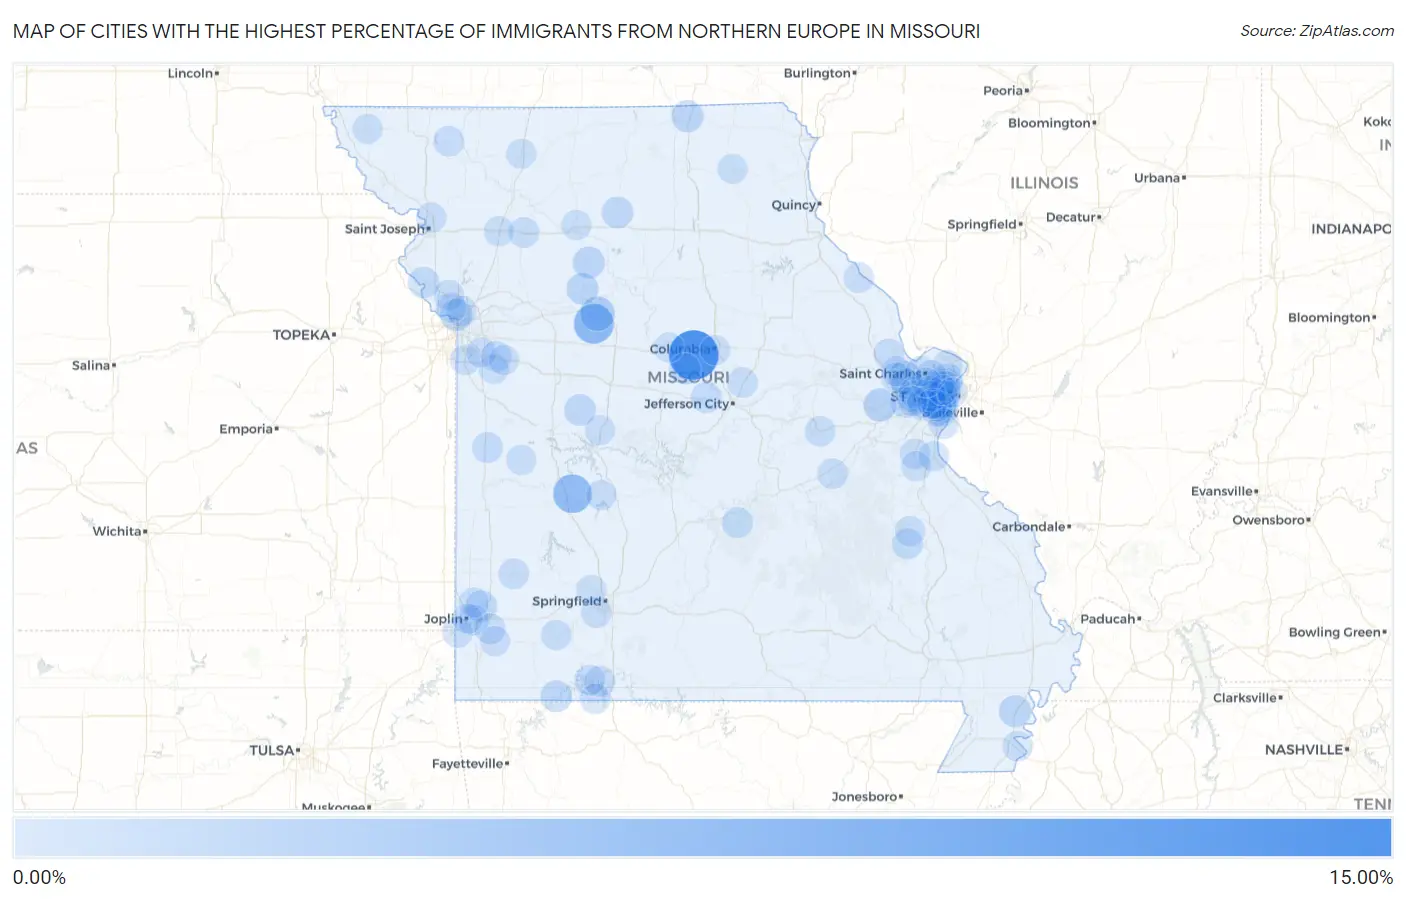
Map of Cities with the Highest Percentage of Immigrants from Northern Europe in Missouri
0.00%
15.00%
Cities with the Highest Percentage of Immigrants from Northern Europe in Missouri
| City | Northern Europe | vs State | vs National | |
| 1. | Wooldridge | 11.54% | 0.11%(+11.4)#1 | 0.29%(+11.3)#23 |
| 2. | Mount Leonard | 5.66% | 0.11%(+5.55)#2 | 0.29%(+5.37)#74 |
| 3. | Gerster | 5.00% | 0.11%(+4.89)#3 | 0.29%(+4.71)#92 |
| 4. | Malta Bend | 2.58% | 0.11%(+2.48)#4 | 0.29%(+2.30)#374 |
| 5. | Lake Timberline | 2.35% | 0.11%(+2.24)#5 | 0.29%(+2.06)#420 |
| 6. | Country Life Acres | 2.15% | 0.11%(+2.04)#6 | 0.29%(+1.87)#474 |
| 7. | Cottleville | 1.92% | 0.11%(+1.81)#7 | 0.29%(+1.63)#575 |
| 8. | Augusta | 1.72% | 0.11%(+1.62)#8 | 0.29%(+1.44)#670 |
| 9. | Northmoor | 1.32% | 0.11%(+1.21)#9 | 0.29%(+1.03)#992 |
| 10. | Portageville | 1.17% | 0.11%(+1.06)#10 | 0.29%(+0.880)#1,185 |
| 11. | Webster Groves | 1.13% | 0.11%(+1.03)#11 | 0.29%(+0.847)#1,234 |
| 12. | Glenwood | 1.12% | 0.11%(+1.02)#12 | 0.29%(+0.838)#1,250 |
| 13. | Tina | 1.10% | 0.11%(+0.993)#13 | 0.29%(+0.814)#1,281 |
| 14. | Carrollton | 1.07% | 0.11%(+0.966)#14 | 0.29%(+0.786)#1,338 |
| 15. | Linneus | 0.97% | 0.11%(+0.861)#15 | 0.29%(+0.681)#1,536 |
| 16. | Prairie Home | 0.93% | 0.11%(+0.825)#16 | 0.29%(+0.645)#1,621 |
| 17. | Chain O Lakes | 0.90% | 0.11%(+0.795)#17 | 0.29%(+0.616)#1,686 |
| 18. | Brooklyn Heights | 0.88% | 0.11%(+0.779)#18 | 0.29%(+0.600)#1,721 |
| 19. | Windsor | 0.87% | 0.11%(+0.761)#19 | 0.29%(+0.581)#1,769 |
| 20. | Weston | 0.80% | 0.11%(+0.698)#20 | 0.29%(+0.518)#1,947 |
| 21. | Clarkson Valley | 0.73% | 0.11%(+0.623)#21 | 0.29%(+0.443)#2,166 |
| 22. | Centertown | 0.60% | 0.11%(+0.499)#22 | 0.29%(+0.319)#2,630 |
| 23. | Green Park | 0.60% | 0.11%(+0.490)#23 | 0.29%(+0.310)#2,667 |
| 24. | Clayton | 0.56% | 0.11%(+0.458)#24 | 0.29%(+0.278)#2,825 |
| 25. | Fort Leonard Wood | 0.56% | 0.11%(+0.458)#25 | 0.29%(+0.278)#2,826 |
| 26. | Ironton | 0.55% | 0.11%(+0.444)#26 | 0.29%(+0.264)#2,900 |
| 27. | Twin Oaks | 0.48% | 0.11%(+0.379)#27 | 0.29%(+0.199)#3,225 |
| 28. | Butler | 0.48% | 0.11%(+0.379)#28 | 0.29%(+0.199)#3,227 |
| 29. | Norwood Court | 0.48% | 0.11%(+0.376)#29 | 0.29%(+0.197)#3,242 |
| 30. | Hamilton | 0.48% | 0.11%(+0.373)#30 | 0.29%(+0.194)#3,258 |
| 31. | Shrewsbury | 0.46% | 0.11%(+0.351)#31 | 0.29%(+0.171)#3,386 |
| 32. | Indian Point | 0.45% | 0.11%(+0.342)#32 | 0.29%(+0.162)#3,458 |
| 33. | Battlefield | 0.43% | 0.11%(+0.324)#33 | 0.29%(+0.145)#3,564 |
| 34. | Leasburg | 0.43% | 0.11%(+0.321)#34 | 0.29%(+0.141)#3,596 |
| 35. | Rosebud | 0.42% | 0.11%(+0.310)#35 | 0.29%(+0.130)#3,669 |
| 36. | Diamond | 0.41% | 0.11%(+0.302)#36 | 0.29%(+0.122)#3,740 |
| 37. | Wildwood | 0.39% | 0.11%(+0.286)#37 | 0.29%(+0.106)#3,873 |
| 38. | Ravenwood | 0.38% | 0.11%(+0.272)#38 | 0.29%(+0.092)#3,990 |
| 39. | Aurora | 0.37% | 0.11%(+0.265)#39 | 0.29%(+0.085)#4,048 |
| 40. | Chain Of Rocks | 0.37% | 0.11%(+0.262)#40 | 0.29%(+0.082)#4,068 |
| 41. | Lake Lotawana | 0.36% | 0.11%(+0.259)#41 | 0.29%(+0.079)#4,098 |
| 42. | Affton | 0.35% | 0.11%(+0.241)#42 | 0.29%(+0.061)#4,257 |
| 43. | New Bloomfield | 0.33% | 0.11%(+0.224)#43 | 0.29%(+0.045)#4,405 |
| 44. | Golden City | 0.33% | 0.11%(+0.221)#44 | 0.29%(+0.041)#4,431 |
| 45. | Dardenne Prairie | 0.33% | 0.11%(+0.220)#45 | 0.29%(+0.040)#4,443 |
| 46. | St John | 0.32% | 0.11%(+0.213)#46 | 0.29%(+0.034)#4,510 |
| 47. | Ferguson | 0.32% | 0.11%(+0.213)#47 | 0.29%(+0.033)#4,518 |
| 48. | Hillsboro | 0.32% | 0.11%(+0.212)#48 | 0.29%(+0.032)#4,527 |
| 49. | Richmond Heights | 0.32% | 0.11%(+0.210)#49 | 0.29%(+0.030)#4,547 |
| 50. | Ferrelview | 0.31% | 0.11%(+0.209)#50 | 0.29%(+0.030)#4,551 |
| 51. | Oakland | 0.31% | 0.11%(+0.201)#51 | 0.29%(+0.021)#4,625 |
| 52. | Duquesne | 0.30% | 0.11%(+0.199)#52 | 0.29%(+0.019)#4,638 |
| 53. | Weldon Spring | 0.30% | 0.11%(+0.195)#53 | 0.29%(+0.015)#4,671 |
| 54. | Chesterfield | 0.29% | 0.11%(+0.189)#54 | 0.29%(+0.009)#4,741 |
| 55. | Hermitage | 0.29% | 0.11%(+0.187)#55 | 0.29%(+0.007)#4,765 |
| 56. | Gladstone | 0.28% | 0.11%(+0.173)#56 | 0.29%(-0.007)#4,918 |
| 57. | Louisiana | 0.28% | 0.11%(+0.171)#57 | 0.29%(-0.008)#4,928 |
| 58. | Kimberling City | 0.27% | 0.11%(+0.161)#58 | 0.29%(-0.019)#5,044 |
| 59. | Blue Eye | 0.26% | 0.11%(+0.151)#59 | 0.29%(-0.028)#5,147 |
| 60. | Sappington | 0.26% | 0.11%(+0.150)#60 | 0.29%(-0.030)#5,163 |
| 61. | Caruthersville | 0.25% | 0.11%(+0.149)#61 | 0.29%(-0.031)#5,180 |
| 62. | Overland | 0.25% | 0.11%(+0.147)#62 | 0.29%(-0.033)#5,205 |
| 63. | Creve Coeur | 0.25% | 0.11%(+0.146)#63 | 0.29%(-0.034)#5,216 |
| 64. | Iron Mountain Lake | 0.25% | 0.11%(+0.143)#64 | 0.29%(-0.037)#5,255 |
| 65. | Greendale | 0.24% | 0.11%(+0.135)#65 | 0.29%(-0.045)#5,341 |
| 66. | Festus | 0.23% | 0.11%(+0.129)#66 | 0.29%(-0.051)#5,414 |
| 67. | Appleton City | 0.23% | 0.11%(+0.120)#67 | 0.29%(-0.060)#5,532 |
| 68. | St Charles | 0.22% | 0.11%(+0.118)#68 | 0.29%(-0.062)#5,560 |
| 69. | Crestwood | 0.22% | 0.11%(+0.114)#69 | 0.29%(-0.066)#5,622 |
| 70. | Crystal Lake Park | 0.22% | 0.11%(+0.112)#70 | 0.29%(-0.068)#5,658 |
| 71. | Oakville | 0.21% | 0.11%(+0.103)#71 | 0.29%(-0.076)#5,763 |
| 72. | Manchester | 0.21% | 0.11%(+0.103)#72 | 0.29%(-0.077)#5,768 |
| 73. | Kirkwood | 0.21% | 0.11%(+0.103)#73 | 0.29%(-0.077)#5,770 |
| 74. | Old Jamestown | 0.21% | 0.11%(+0.100)#74 | 0.29%(-0.079)#5,802 |
| 75. | Tarkio | 0.20% | 0.11%(+0.098)#75 | 0.29%(-0.082)#5,828 |
| 76. | Loma Linda | 0.20% | 0.11%(+0.097)#76 | 0.29%(-0.083)#5,842 |
| 77. | De Soto | 0.20% | 0.11%(+0.097)#77 | 0.29%(-0.083)#5,855 |
| 78. | Lincoln | 0.20% | 0.11%(+0.095)#78 | 0.29%(-0.084)#5,870 |
| 79. | Platte Woods | 0.20% | 0.11%(+0.093)#79 | 0.29%(-0.087)#5,899 |
| 80. | University City | 0.20% | 0.11%(+0.092)#80 | 0.29%(-0.087)#5,908 |
| 81. | Cameron | 0.20% | 0.11%(+0.092)#81 | 0.29%(-0.088)#5,913 |
| 82. | Pleasant Hill | 0.19% | 0.11%(+0.087)#82 | 0.29%(-0.093)#5,993 |
| 83. | Bridgeton | 0.19% | 0.11%(+0.087)#83 | 0.29%(-0.093)#5,995 |
| 84. | Oronogo | 0.19% | 0.11%(+0.087)#84 | 0.29%(-0.093)#5,996 |
| 85. | Ellisville | 0.19% | 0.11%(+0.086)#85 | 0.29%(-0.094)#6,010 |
| 86. | Willard | 0.19% | 0.11%(+0.084)#86 | 0.29%(-0.096)#6,045 |
| 87. | Country Club | 0.19% | 0.11%(+0.082)#87 | 0.29%(-0.097)#6,067 |
| 88. | Columbia | 0.18% | 0.11%(+0.072)#88 | 0.29%(-0.108)#6,217 |
| 89. | Granby | 0.18% | 0.11%(+0.070)#89 | 0.29%(-0.109)#6,246 |
| 90. | Maryland Heights | 0.17% | 0.11%(+0.069)#90 | 0.29%(-0.111)#6,262 |
| 91. | Joplin | 0.17% | 0.11%(+0.066)#91 | 0.29%(-0.114)#6,299 |
| 92. | O Fallon | 0.17% | 0.11%(+0.065)#92 | 0.29%(-0.114)#6,309 |
| 93. | Grandview | 0.17% | 0.11%(+0.060)#93 | 0.29%(-0.120)#6,390 |
| 94. | Lee S Summit | 0.16% | 0.11%(+0.057)#94 | 0.29%(-0.123)#6,437 |
| 95. | Bethany | 0.16% | 0.11%(+0.055)#95 | 0.29%(-0.125)#6,464 |
| 96. | Lone Jack | 0.15% | 0.11%(+0.045)#96 | 0.29%(-0.135)#6,593 |
| 97. | Edina | 0.15% | 0.11%(+0.039)#97 | 0.29%(-0.140)#6,670 |
| 98. | St Louis | 0.14% | 0.11%(+0.039)#98 | 0.29%(-0.141)#6,674 |
| 99. | Chillicothe | 0.14% | 0.11%(+0.037)#99 | 0.29%(-0.142)#6,702 |
| 100. | Boonville | 0.14% | 0.11%(+0.037)#100 | 0.29%(-0.143)#6,705 |
Common Questions
What are the Top 10 Cities with the Highest Percentage of Immigrants from Northern Europe in Missouri?
Top 10 Cities with the Highest Percentage of Immigrants from Northern Europe in Missouri are:
#1
11.54%
#2
5.66%
#3
5.00%
#4
2.58%
#5
2.15%
#6
1.92%
#7
1.72%
#8
1.32%
#9
1.17%
#10
1.13%
What city has the Highest Percentage of Immigrants from Northern Europe in Missouri?
Wooldridge has the Highest Percentage of Immigrants from Northern Europe in Missouri with 11.54%.
What is the Percentage of Immigrants from Northern Europe in the State of Missouri?
Percentage of Immigrants from Northern Europe in Missouri is 0.11%.
What is the Percentage of Immigrants from Northern Europe in the United States?
Percentage of Immigrants from Northern Europe in the United States is 0.29%.