Cities with the Highest Percentage of Immigrants from Ecuador in Maryland
RELATED REPORTS & OPTIONS
Ecuador
Maryland
Compare Cities
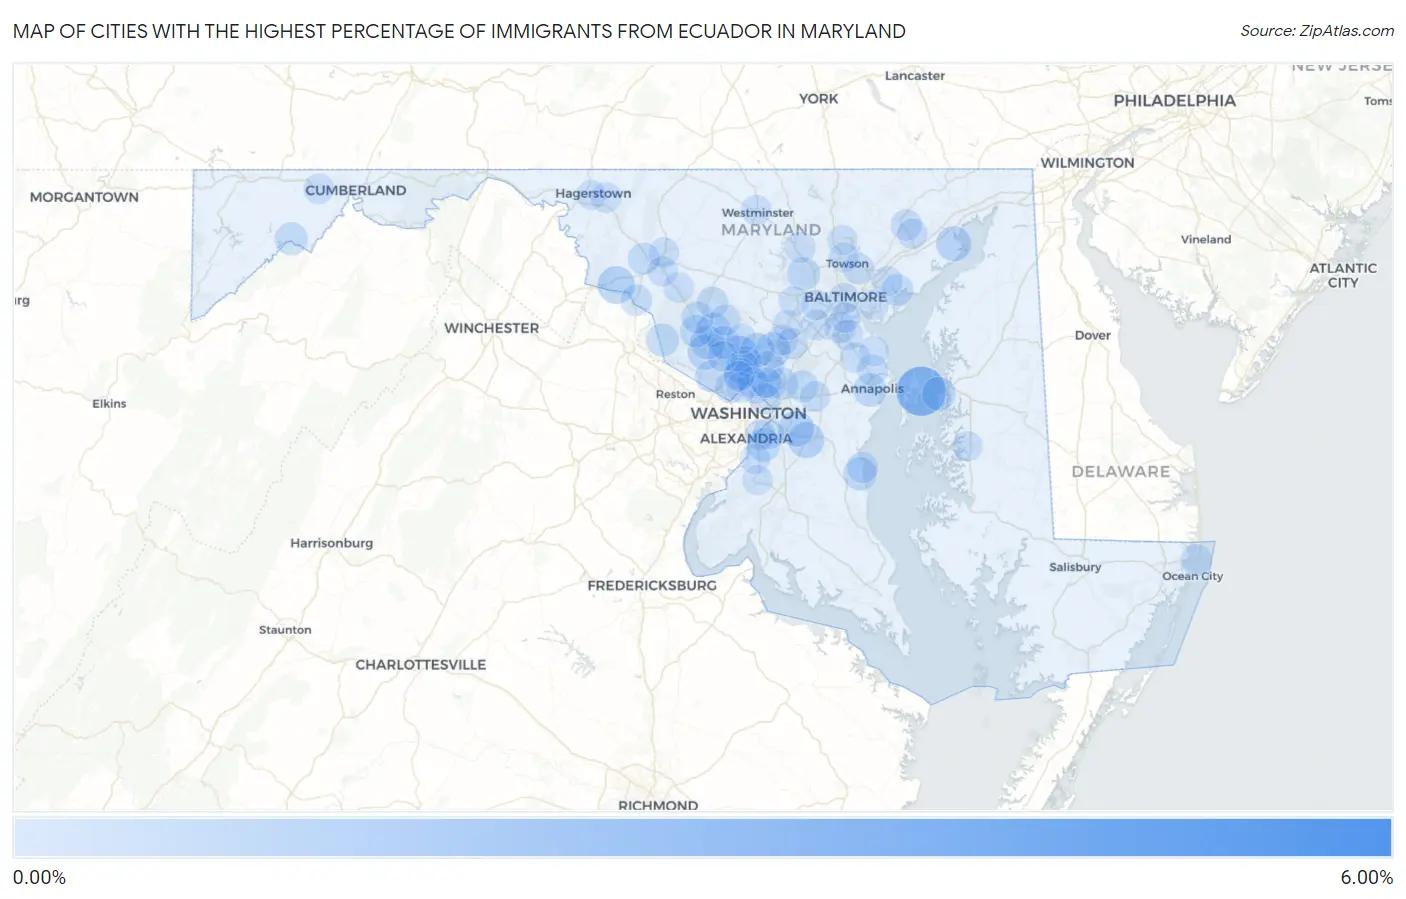
Map of Cities with the Highest Percentage of Immigrants from Ecuador in Maryland
0.00%
6.00%
Cities with the Highest Percentage of Immigrants from Ecuador in Maryland
| City | Ecuador | vs State | vs National | |
| 1. | Burnt Mills | 5.49% | 0.10%(+5.39)#57 | 0.15%(+5.35)#6,573 |
| 2. | Chester | 2.72% | 0.10%(+2.61)#58 | 0.15%(+2.57)#6,574 |
| 3. | Aspen Hill | 1.16% | 0.10%(+1.06)#123 | 0.15%(+1.02)#9,583 |
| 4. | Rosemont | 1.01% | 0.10%(+0.906)#124 | 0.15%(+0.861)#9,584 |
| 5. | Queensland | 0.84% | 0.10%(+0.735)#125 | 0.15%(+0.691)#9,585 |
| 6. | Westphalia | 0.78% | 0.10%(+0.681)#126 | 0.15%(+0.636)#9,586 |
| 7. | Burtonsville | 0.75% | 0.10%(+0.646)#204 | 0.15%(+0.601)#12,106 |
| 8. | Aberdeen Proving Ground | 0.70% | 0.10%(+0.602)#205 | 0.15%(+0.558)#12,107 |
| 9. | North Potomac | 0.64% | 0.10%(+0.543)#211 | 0.15%(+0.499)#12,288 |
| 10. | Montgomery Village | 0.58% | 0.10%(+0.483)#212 | 0.15%(+0.439)#12,289 |
| 11. | Cloverly | 0.57% | 0.10%(+0.471)#213 | 0.15%(+0.427)#12,290 |
| 12. | Gaithersburg | 0.53% | 0.10%(+0.427)#214 | 0.15%(+0.382)#12,291 |
| 13. | Flower Hill | 0.52% | 0.10%(+0.419)#215 | 0.15%(+0.374)#12,292 |
| 14. | Wheaton | 0.52% | 0.10%(+0.416)#216 | 0.15%(+0.372)#12,293 |
| 15. | Grasonville | 0.51% | 0.10%(+0.409)#217 | 0.15%(+0.365)#12,294 |
| 16. | Chesapeake Beach | 0.47% | 0.10%(+0.371)#218 | 0.15%(+0.327)#12,295 |
| 17. | Annapolis | 0.47% | 0.10%(+0.366)#219 | 0.15%(+0.321)#12,296 |
| 18. | Oxon Hill | 0.44% | 0.10%(+0.336)#220 | 0.15%(+0.292)#12,297 |
| 19. | Randallstown | 0.44% | 0.10%(+0.335)#221 | 0.15%(+0.291)#12,298 |
| 20. | Poolesville | 0.42% | 0.10%(+0.321)#222 | 0.15%(+0.277)#12,299 |
| 21. | Westernport | 0.40% | 0.10%(+0.301)#223 | 0.15%(+0.256)#12,300 |
| 22. | Redland | 0.39% | 0.10%(+0.286)#224 | 0.15%(+0.242)#12,301 |
| 23. | Germantown | 0.35% | 0.10%(+0.252)#225 | 0.15%(+0.207)#12,302 |
| 24. | Honeygo | 0.28% | 0.10%(+0.181)#226 | 0.15%(+0.137)#12,303 |
| 25. | Takoma Park | 0.27% | 0.10%(+0.173)#227 | 0.15%(+0.128)#12,304 |
| 26. | Potomac | 0.26% | 0.10%(+0.159)#228 | 0.15%(+0.115)#12,305 |
| 27. | College Park | 0.26% | 0.10%(+0.158)#229 | 0.15%(+0.113)#12,306 |
| 28. | Clarksburg | 0.26% | 0.10%(+0.157)#230 | 0.15%(+0.112)#12,307 |
| 29. | Greenbelt | 0.26% | 0.10%(+0.155)#231 | 0.15%(+0.110)#12,308 |
| 30. | Bowleys Quarters | 0.25% | 0.10%(+0.151)#232 | 0.15%(+0.107)#12,309 |
| 31. | Glenn Dale | 0.25% | 0.10%(+0.148)#233 | 0.15%(+0.104)#12,310 |
| 32. | Braddock Heights | 0.25% | 0.10%(+0.144)#234 | 0.15%(+0.100)#12,311 |
| 33. | Kensington | 0.22% | 0.10%(+0.122)#235 | 0.15%(+0.078)#12,312 |
| 34. | Ocean City | 0.22% | 0.10%(+0.117)#236 | 0.15%(+0.073)#12,313 |
| 35. | Damascus | 0.21% | 0.10%(+0.113)#237 | 0.15%(+0.068)#12,314 |
| 36. | Point Of Rocks | 0.21% | 0.10%(+0.111)#238 | 0.15%(+0.067)#12,315 |
| 37. | Calverton | 0.18% | 0.10%(+0.079)#239 | 0.15%(+0.035)#12,316 |
| 38. | Marlow Heights | 0.18% | 0.10%(+0.075)#240 | 0.15%(+0.031)#12,317 |
| 39. | Ferndale | 0.17% | 0.10%(+0.073)#241 | 0.15%(+0.029)#12,318 |
| 40. | Parkville | 0.17% | 0.10%(+0.073)#242 | 0.15%(+0.028)#12,469 |
| 41. | Baltimore | 0.17% | 0.10%(+0.068)#243 | 0.15%(+0.024)#12,470 |
| 42. | Bel Air | 0.16% | 0.10%(+0.059)#244 | 0.15%(+0.015)#12,471 |
| 43. | North Laurel | 0.16% | 0.10%(+0.059)#245 | 0.15%(+0.015)#12,472 |
| 44. | Mount Rainier | 0.16% | 0.10%(+0.057)#246 | 0.15%(+0.012)#12,473 |
| 45. | Arnold | 0.16% | 0.10%(+0.056)#247 | 0.15%(+0.012)#12,474 |
| 46. | North Beach | 0.15% | 0.10%(+0.050)#248 | 0.15%(+0.006)#12,475 |
| 47. | Bethesda | 0.14% | 0.10%(+0.036)#249 | 0.15%(-0.008)#12,476 |
| 48. | Laytonsville | 0.14% | 0.10%(+0.035)#250 | 0.15%(-0.009)#12,477 |
| 49. | Silver Spring | 0.13% | 0.10%(+0.031)#251 | 0.15%(-0.013)#12,478 |
| 50. | Glen Burnie | 0.13% | 0.10%(+0.028)#252 | 0.15%(-0.016)#12,479 |
| 51. | Reisterstown | 0.13% | 0.10%(+0.026)#253 | 0.15%(-0.018)#12,480 |
| 52. | Scaggsville | 0.11% | 0.10%(+0.010)#254 | 0.15%(-0.034)#12,481 |
| 53. | Glenmont | 0.11% | 0.10%(+0.007)#255 | 0.15%(-0.037)#12,482 |
| 54. | Brooklyn Park | 0.11% | 0.10%(+0.006)#256 | 0.15%(-0.038)#12,483 |
| 55. | Bowie | 0.10% | 0.10%(+0.003)#257 | 0.15%(-0.042)#12,484 |
| 56. | Martin S Additions | 0.10% | 0.10%(-0.000)#258 | 0.15%(-0.045)#12,485 |
| 57. | Robinwood | 0.100% | 0.10%(-0.001)#259 | 0.15%(-0.045)#12,486 |
| 58. | Glassmanor | 0.098% | 0.10%(-0.003)#260 | 0.15%(-0.047)#12,487 |
| 59. | Urbana | 0.097% | 0.10%(-0.004)#261 | 0.15%(-0.048)#12,488 |
| 60. | Chevy Chase View | 0.089% | 0.10%(-0.012)#262 | 0.15%(-0.056)#12,489 |
| 61. | Elkridge | 0.087% | 0.10%(-0.014)#263 | 0.15%(-0.058)#12,490 |
| 62. | Frostburg | 0.084% | 0.10%(-0.017)#264 | 0.15%(-0.061)#12,491 |
| 63. | Adelphi | 0.083% | 0.10%(-0.018)#265 | 0.15%(-0.063)#12,492 |
| 64. | Middle River | 0.077% | 0.10%(-0.024)#266 | 0.15%(-0.068)#12,493 |
| 65. | Fort Washington | 0.070% | 0.10%(-0.031)#267 | 0.15%(-0.076)#12,494 |
| 66. | Bel Air South | 0.063% | 0.10%(-0.038)#268 | 0.15%(-0.082)#12,495 |
| 67. | Frederick | 0.063% | 0.10%(-0.038)#269 | 0.15%(-0.083)#12,496 |
| 68. | Westminster | 0.055% | 0.10%(-0.046)#270 | 0.15%(-0.091)#12,497 |
| 69. | Ballenger Creek | 0.049% | 0.10%(-0.051)#271 | 0.15%(-0.096)#12,498 |
| 70. | Catonsville | 0.049% | 0.10%(-0.052)#272 | 0.15%(-0.096)#12,499 |
| 71. | Easton | 0.047% | 0.10%(-0.054)#273 | 0.15%(-0.099)#12,500 |
| 72. | Columbia | 0.045% | 0.10%(-0.056)#274 | 0.15%(-0.100)#12,501 |
| 73. | Severna Park | 0.042% | 0.10%(-0.059)#275 | 0.15%(-0.103)#12,502 |
| 74. | Cockeysville | 0.039% | 0.10%(-0.062)#276 | 0.15%(-0.107)#12,503 |
| 75. | Rockville | 0.037% | 0.10%(-0.064)#277 | 0.15%(-0.108)#12,504 |
| 76. | Lake Shore | 0.032% | 0.10%(-0.069)#278 | 0.15%(-0.113)#12,505 |
| 77. | Olney | 0.020% | 0.10%(-0.081)#279 | 0.15%(-0.126)#12,506 |
| 78. | Ellicott City | 0.016% | 0.10%(-0.084)#280 | 0.15%(-0.129)#12,507 |
| 79. | Accokeek | 0.016% | 0.10%(-0.085)#281 | 0.15%(-0.130)#12,508 |
| 80. | Lutherville | 0.015% | 0.10%(-0.086)#282 | 0.15%(-0.130)#12,509 |
| 81. | Dundalk | 0.012% | 0.10%(-0.089)#283 | 0.15%(-0.133)#12,510 |
| 82. | Hagerstown | 0.0069% | 0.10%(-0.094)#284 | 0.15%(-0.138)#12,511 |
Common Questions
What are the Top 10 Cities with the Highest Percentage of Immigrants from Ecuador in Maryland?
Top 10 Cities with the Highest Percentage of Immigrants from Ecuador in Maryland are:
#1
2.72%
#2
1.16%
#3
1.01%
#4
0.84%
#5
0.78%
#6
0.75%
#7
0.70%
#8
0.64%
#9
0.58%
#10
0.57%
What city has the Highest Percentage of Immigrants from Ecuador in Maryland?
Chester has the Highest Percentage of Immigrants from Ecuador in Maryland with 2.72%.
What is the Percentage of Immigrants from Ecuador in the State of Maryland?
Percentage of Immigrants from Ecuador in Maryland is 0.10%.
What is the Percentage of Immigrants from Ecuador in the United States?
Percentage of Immigrants from Ecuador in the United States is 0.15%.