Cities with the Most Immigrants from Pakistan in Maryland
RELATED REPORTS & OPTIONS
Pakistan
Maryland
Compare Cities
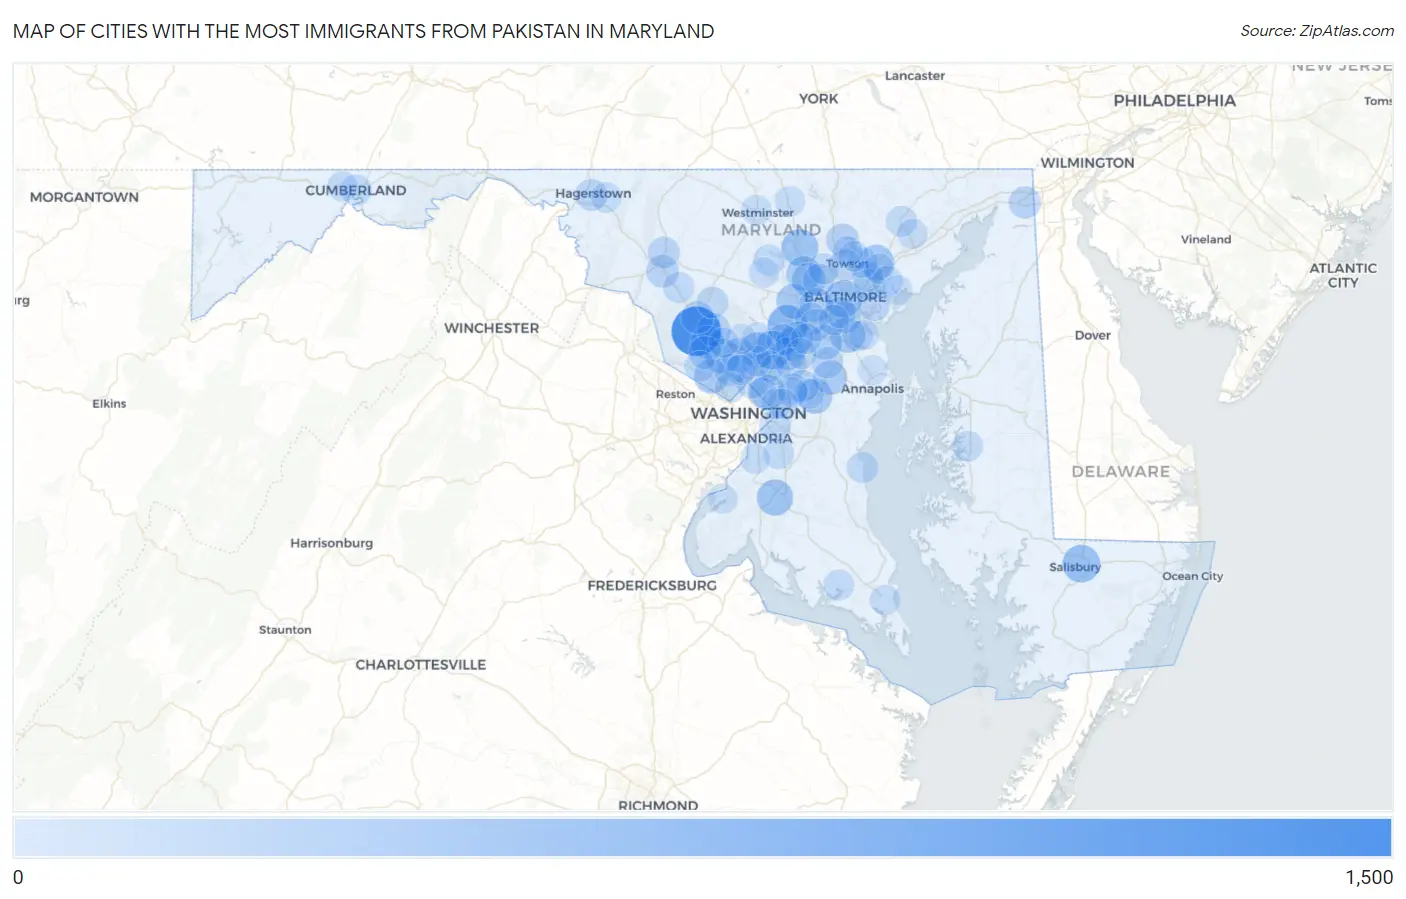
Map of Cities with the Most Immigrants from Pakistan in Maryland
0
1,500
Cities with the Most Immigrants from Pakistan in Maryland
| City | Pakistan | vs State | vs National | |
| 1. | Germantown | 1,169 | 17,037(6.86%)#1 | 393,877(0.30%)#25 |
| 2. | Woodlawn Cdp Baltimore County | 944 | 17,037(5.54%)#2 | 393,877(0.24%)#35 |
| 3. | Columbia | 573 | 17,037(3.36%)#3 | 393,877(0.15%)#85 |
| 4. | Flower Hill | 520 | 17,037(3.05%)#4 | 393,877(0.13%)#93 |
| 5. | Burtonsville | 504 | 17,037(2.96%)#5 | 393,877(0.13%)#98 |
| 6. | Honeygo | 458 | 17,037(2.69%)#6 | 393,877(0.12%)#112 |
| 7. | Salisbury | 448 | 17,037(2.63%)#7 | 393,877(0.11%)#117 |
| 8. | Baltimore | 433 | 17,037(2.54%)#8 | 393,877(0.11%)#120 |
| 9. | Reisterstown | 399 | 17,037(2.34%)#9 | 393,877(0.10%)#135 |
| 10. | Waldorf | 370 | 17,037(2.17%)#10 | 393,877(0.09%)#156 |
| 11. | Perry Hall | 332 | 17,037(1.95%)#11 | 393,877(0.08%)#183 |
| 12. | Cloverly | 332 | 17,037(1.95%)#12 | 393,877(0.08%)#185 |
| 13. | Glen Burnie | 325 | 17,037(1.91%)#13 | 393,877(0.08%)#189 |
| 14. | Rockville | 296 | 17,037(1.74%)#14 | 393,877(0.08%)#213 |
| 15. | Randallstown | 295 | 17,037(1.73%)#15 | 393,877(0.07%)#216 |
| 16. | Bowie | 293 | 17,037(1.72%)#16 | 393,877(0.07%)#218 |
| 17. | Ellicott City | 292 | 17,037(1.71%)#17 | 393,877(0.07%)#221 |
| 18. | Hyattsville | 289 | 17,037(1.70%)#18 | 393,877(0.07%)#223 |
| 19. | Potomac | 276 | 17,037(1.62%)#19 | 393,877(0.07%)#236 |
| 20. | Severn | 259 | 17,037(1.52%)#20 | 393,877(0.07%)#248 |
| 21. | Aspen Hill | 248 | 17,037(1.46%)#21 | 393,877(0.06%)#258 |
| 22. | Milford Mill | 246 | 17,037(1.44%)#22 | 393,877(0.06%)#261 |
| 23. | Crofton | 245 | 17,037(1.44%)#23 | 393,877(0.06%)#263 |
| 24. | Gaithersburg | 224 | 17,037(1.31%)#24 | 393,877(0.06%)#293 |
| 25. | Catonsville | 224 | 17,037(1.31%)#25 | 393,877(0.06%)#294 |
| 26. | North Laurel | 224 | 17,037(1.31%)#26 | 393,877(0.06%)#295 |
| 27. | Montgomery Village | 197 | 17,037(1.16%)#27 | 393,877(0.05%)#351 |
| 28. | Laurel | 172 | 17,037(1.01%)#28 | 393,877(0.04%)#416 |
| 29. | North Potomac | 172 | 17,037(1.01%)#29 | 393,877(0.04%)#417 |
| 30. | Cockeysville | 169 | 17,037(0.99%)#30 | 393,877(0.04%)#425 |
| 31. | Ballenger Creek | 162 | 17,037(0.95%)#31 | 393,877(0.04%)#443 |
| 32. | Clarksburg | 159 | 17,037(0.93%)#32 | 393,877(0.04%)#453 |
| 33. | Ilchester | 153 | 17,037(0.90%)#33 | 393,877(0.04%)#468 |
| 34. | Glenn Dale | 150 | 17,037(0.88%)#34 | 393,877(0.04%)#475 |
| 35. | Elkton | 148 | 17,037(0.87%)#35 | 393,877(0.04%)#484 |
| 36. | Elkridge | 140 | 17,037(0.82%)#36 | 393,877(0.04%)#502 |
| 37. | Silver Spring | 137 | 17,037(0.80%)#37 | 393,877(0.03%)#512 |
| 38. | Dundalk | 137 | 17,037(0.80%)#38 | 393,877(0.03%)#514 |
| 39. | Lochearn | 132 | 17,037(0.77%)#39 | 393,877(0.03%)#531 |
| 40. | North Bethesda | 129 | 17,037(0.76%)#40 | 393,877(0.03%)#541 |
| 41. | Savage | 126 | 17,037(0.74%)#41 | 393,877(0.03%)#548 |
| 42. | Frederick | 123 | 17,037(0.72%)#42 | 393,877(0.03%)#555 |
| 43. | Scaggsville | 123 | 17,037(0.72%)#43 | 393,877(0.03%)#558 |
| 44. | Hagerstown | 122 | 17,037(0.72%)#44 | 393,877(0.03%)#561 |
| 45. | Brooklyn Park | 117 | 17,037(0.69%)#45 | 393,877(0.03%)#590 |
| 46. | Towson | 113 | 17,037(0.66%)#46 | 393,877(0.03%)#608 |
| 47. | Suitland | 102 | 17,037(0.60%)#47 | 393,877(0.03%)#655 |
| 48. | Damascus | 101 | 17,037(0.59%)#48 | 393,877(0.03%)#661 |
| 49. | Odenton | 97 | 17,037(0.57%)#49 | 393,877(0.02%)#678 |
| 50. | Calverton | 97 | 17,037(0.57%)#50 | 393,877(0.02%)#679 |
| 51. | South Laurel | 96 | 17,037(0.56%)#51 | 393,877(0.02%)#682 |
| 52. | Rosedale | 90 | 17,037(0.53%)#52 | 393,877(0.02%)#718 |
| 53. | Baltimore Highlands | 89 | 17,037(0.52%)#53 | 393,877(0.02%)#730 |
| 54. | Seabrook | 86 | 17,037(0.50%)#54 | 393,877(0.02%)#756 |
| 55. | Eldersburg | 85 | 17,037(0.50%)#55 | 393,877(0.02%)#760 |
| 56. | Urbana | 78 | 17,037(0.46%)#56 | 393,877(0.02%)#806 |
| 57. | North Beach | 78 | 17,037(0.46%)#57 | 393,877(0.02%)#809 |
| 58. | Pikesville | 76 | 17,037(0.45%)#58 | 393,877(0.02%)#818 |
| 59. | Cumberland | 75 | 17,037(0.44%)#59 | 393,877(0.02%)#826 |
| 60. | Overlea | 74 | 17,037(0.43%)#60 | 393,877(0.02%)#837 |
| 61. | Bel Air North | 64 | 17,037(0.38%)#61 | 393,877(0.02%)#923 |
| 62. | Easton | 64 | 17,037(0.38%)#62 | 393,877(0.02%)#925 |
| 63. | Maryland City | 61 | 17,037(0.36%)#63 | 393,877(0.02%)#949 |
| 64. | Travilah | 60 | 17,037(0.35%)#64 | 393,877(0.02%)#959 |
| 65. | Clinton | 58 | 17,037(0.34%)#65 | 393,877(0.01%)#975 |
| 66. | Carney | 58 | 17,037(0.34%)#66 | 393,877(0.01%)#977 |
| 67. | Robinwood | 56 | 17,037(0.33%)#67 | 393,877(0.01%)#1,003 |
| 68. | Leonardtown | 55 | 17,037(0.32%)#68 | 393,877(0.01%)#1,012 |
| 69. | Wheaton | 49 | 17,037(0.29%)#69 | 393,877(0.01%)#1,065 |
| 70. | Middle River | 49 | 17,037(0.29%)#70 | 393,877(0.01%)#1,067 |
| 71. | Jessup | 47 | 17,037(0.28%)#71 | 393,877(0.01%)#1,098 |
| 72. | Beltsville | 46 | 17,037(0.27%)#72 | 393,877(0.01%)#1,109 |
| 73. | Colesville | 46 | 17,037(0.27%)#73 | 393,877(0.01%)#1,112 |
| 74. | Fort Washington | 44 | 17,037(0.26%)#74 | 393,877(0.01%)#1,133 |
| 75. | Linthicum | 44 | 17,037(0.26%)#75 | 393,877(0.01%)#1,140 |
| 76. | Bethesda | 43 | 17,037(0.25%)#76 | 393,877(0.01%)#1,144 |
| 77. | Lexington Park | 43 | 17,037(0.25%)#77 | 393,877(0.01%)#1,156 |
| 78. | Hampton | 42 | 17,037(0.25%)#78 | 393,877(0.01%)#1,180 |
| 79. | Cheverly | 39 | 17,037(0.23%)#79 | 393,877(0.01%)#1,227 |
| 80. | Westminster | 38 | 17,037(0.22%)#80 | 393,877(0.01%)#1,238 |
| 81. | Ashton Sandy Spring | 38 | 17,037(0.22%)#81 | 393,877(0.01%)#1,243 |
| 82. | Hampstead | 35 | 17,037(0.21%)#82 | 393,877(0.01%)#1,283 |
| 83. | La Vale | 31 | 17,037(0.18%)#83 | 393,877(0.01%)#1,358 |
| 84. | Bel Air South | 30 | 17,037(0.18%)#84 | 393,877(0.01%)#1,364 |
| 85. | Pasadena | 30 | 17,037(0.18%)#85 | 393,877(0.01%)#1,372 |
| 86. | Timonium | 30 | 17,037(0.18%)#86 | 393,877(0.01%)#1,377 |
| 87. | Fairwood | 30 | 17,037(0.18%)#87 | 393,877(0.01%)#1,380 |
| 88. | Lanham | 29 | 17,037(0.17%)#88 | 393,877(0.01%)#1,396 |
| 89. | Riviera Beach | 26 | 17,037(0.15%)#89 | 393,877(0.01%)#1,460 |
| 90. | Olney | 25 | 17,037(0.15%)#90 | 393,877(0.01%)#1,482 |
| 91. | Landover | 25 | 17,037(0.15%)#91 | 393,877(0.01%)#1,484 |
| 92. | North Kensington | 25 | 17,037(0.15%)#92 | 393,877(0.01%)#1,491 |
| 93. | Sykesville | 25 | 17,037(0.15%)#93 | 393,877(0.01%)#1,495 |
| 94. | White Marsh | 24 | 17,037(0.14%)#94 | 393,877(0.01%)#1,514 |
| 95. | Redland | 21 | 17,037(0.12%)#95 | 393,877(0.01%)#1,587 |
| 96. | Green Valley | 21 | 17,037(0.12%)#96 | 393,877(0.01%)#1,592 |
| 97. | Bowleys Quarters | 20 | 17,037(0.12%)#97 | 393,877(0.01%)#1,620 |
| 98. | Indian Head | 20 | 17,037(0.12%)#98 | 393,877(0.01%)#1,624 |
| 99. | Arnold | 19 | 17,037(0.11%)#99 | 393,877(0.00%)#1,645 |
| 100. | Chillum | 18 | 17,037(0.11%)#100 | 393,877(0.00%)#1,668 |
Common Questions
What are the Top 10 Cities with the Most Immigrants from Pakistan in Maryland?
Top 10 Cities with the Most Immigrants from Pakistan in Maryland are:
#1
1,169
#2
573
#3
504
#4
448
#5
433
#6
399
#7
370
#8
332
#9
332
#10
325
What city has the Most Immigrants from Pakistan in Maryland?
Germantown has the Most Immigrants from Pakistan in Maryland with 1,169.
What is the Total Immigrants from Pakistan in the State of Maryland?
Total Immigrants from Pakistan in Maryland is 17,037.
What is the Total Immigrants from Pakistan in the United States?
Total Immigrants from Pakistan in the United States is 393,877.