Cities with the Highest Percentage of Immigrants from Nigeria in Maryland
RELATED REPORTS & OPTIONS
Nigeria
Maryland
Compare Cities
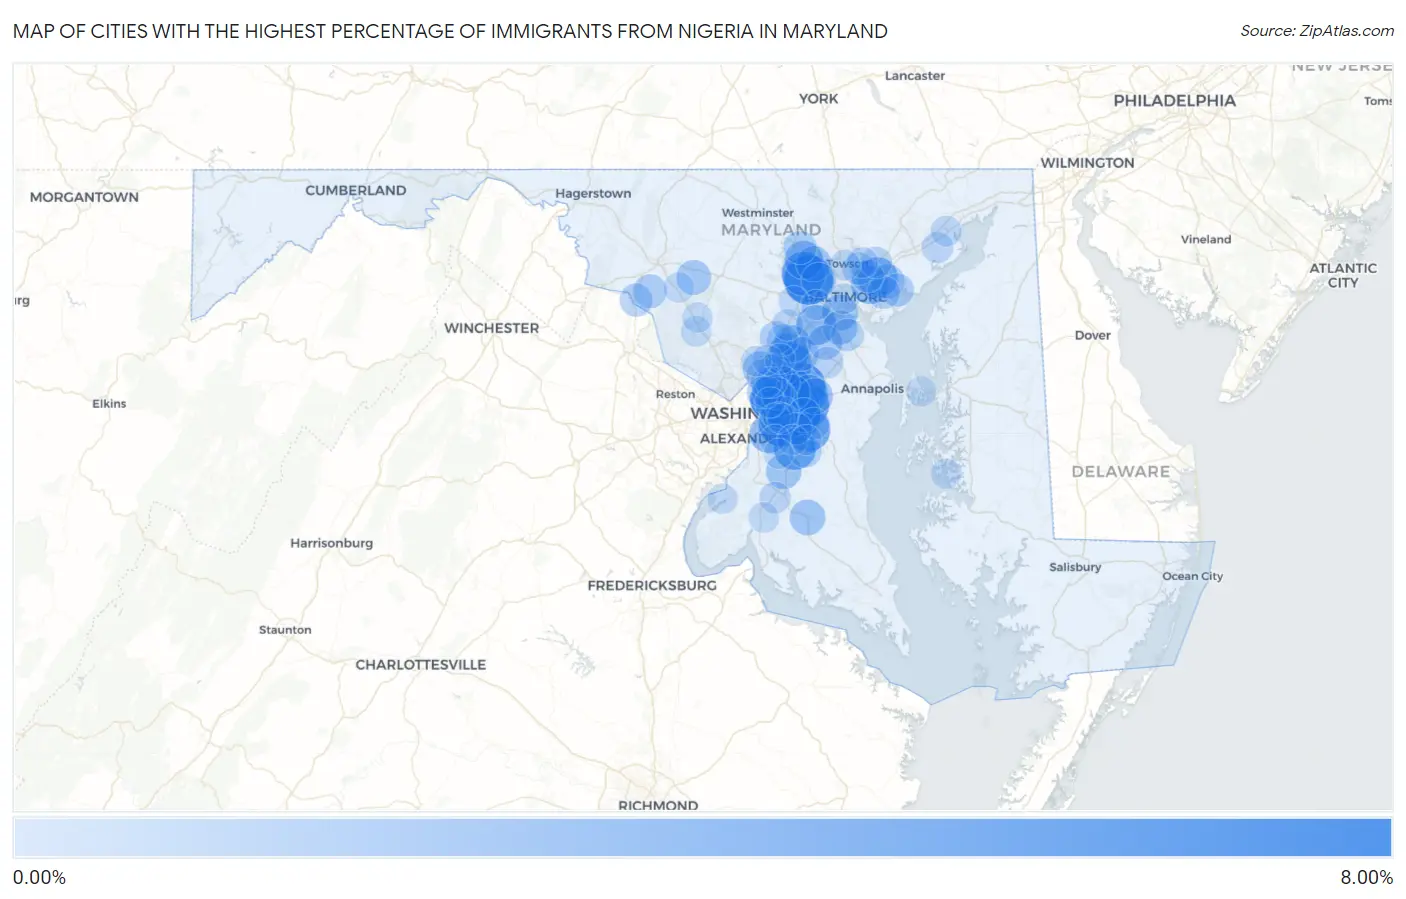
Map of Cities with the Highest Percentage of Immigrants from Nigeria in Maryland
0.00%
8.00%
Cities with the Highest Percentage of Immigrants from Nigeria in Maryland
| City | Nigeria | vs State | vs National | |
| 1. | Milford Mill | 6.59% | 0.73%(+5.86)#-1 | 0.13%(+6.46)#0 |
| 2. | Largo | 6.43% | 0.73%(+5.70)#0 | 0.13%(+6.30)#1 |
| 3. | Brown Station | 6.36% | 0.73%(+5.63)#1 | 0.13%(+6.23)#2 |
| 4. | District Heights | 6.11% | 0.73%(+5.39)#2 | 0.13%(+5.99)#3 |
| 5. | Landover | 6.09% | 0.73%(+5.37)#3 | 0.13%(+5.97)#4 |
| 6. | Bladensburg | 5.83% | 0.73%(+5.10)#4 | 0.13%(+5.70)#5 |
| 7. | Glenn Dale | 5.52% | 0.73%(+4.79)#5 | 0.13%(+5.39)#6 |
| 8. | Woodmore | 5.42% | 0.73%(+4.69)#6 | 0.13%(+5.29)#7 |
| 9. | Glenarden | 5.29% | 0.73%(+4.56)#7 | 0.13%(+5.16)#8 |
| 10. | New Carrollton | 4.95% | 0.73%(+4.22)#11 | 0.13%(+4.82)#385 |
| 11. | Randallstown | 4.81% | 0.73%(+4.08)#12 | 0.13%(+4.69)#386 |
| 12. | Marlboro Village | 4.48% | 0.73%(+3.76)#13 | 0.13%(+4.36)#387 |
| 13. | South Laurel | 4.19% | 0.73%(+3.46)#59 | 0.13%(+4.06)#1,649 |
| 14. | Rosaryville | 4.17% | 0.73%(+3.44)#60 | 0.13%(+4.04)#1,650 |
| 15. | Seabrook | 3.93% | 0.73%(+3.20)#61 | 0.13%(+3.80)#1,651 |
| 16. | Mitchellville | 3.69% | 0.73%(+2.97)#62 | 0.13%(+3.57)#1,652 |
| 17. | Rossville | 3.62% | 0.73%(+2.89)#63 | 0.13%(+3.49)#1,653 |
| 18. | Laurel | 3.59% | 0.73%(+2.87)#64 | 0.13%(+3.47)#1,654 |
| 19. | Elkridge | 3.56% | 0.73%(+2.84)#65 | 0.13%(+3.44)#1,655 |
| 20. | Summerfield | 3.51% | 0.73%(+2.78)#66 | 0.13%(+3.38)#1,656 |
| 21. | Lake Arbor | 3.34% | 0.73%(+2.61)#67 | 0.13%(+3.21)#1,657 |
| 22. | Cheverly | 3.16% | 0.73%(+2.44)#68 | 0.13%(+3.04)#1,658 |
| 23. | Marlow Heights | 3.07% | 0.73%(+2.34)#69 | 0.13%(+2.94)#1,659 |
| 24. | Owings Mills | 3.02% | 0.73%(+2.29)#70 | 0.13%(+2.89)#1,987 |
| 25. | Rosedale | 2.98% | 0.73%(+2.25)#71 | 0.13%(+2.85)#1,988 |
| 26. | Fairwood | 2.94% | 0.73%(+2.21)#72 | 0.13%(+2.81)#1,989 |
| 27. | Seat Pleasant | 2.71% | 0.73%(+1.98)#73 | 0.13%(+2.58)#1,990 |
| 28. | Woodlawn Cdp Prince George S County | 2.70% | 0.73%(+1.97)#74 | 0.13%(+2.58)#1,991 |
| 29. | Cottage City | 2.69% | 0.73%(+1.96)#75 | 0.13%(+2.56)#1,992 |
| 30. | North Laurel | 2.53% | 0.73%(+1.80)#76 | 0.13%(+2.41)#1,993 |
| 31. | Baltimore Highlands | 2.27% | 0.73%(+1.54)#77 | 0.13%(+2.14)#1,994 |
| 32. | Bowie | 2.23% | 0.73%(+1.50)#78 | 0.13%(+2.10)#1,995 |
| 33. | Hughesville | 2.17% | 0.73%(+1.45)#79 | 0.13%(+2.05)#1,996 |
| 34. | Garrison | 2.11% | 0.73%(+1.38)#80 | 0.13%(+1.98)#1,997 |
| 35. | Lanham | 2.11% | 0.73%(+1.38)#81 | 0.13%(+1.98)#1,998 |
| 36. | Brandywine | 2.09% | 0.73%(+1.36)#82 | 0.13%(+1.97)#1,999 |
| 37. | Monrovia | 1.91% | 0.73%(+1.19)#83 | 0.13%(+1.79)#2,000 |
| 38. | Lochearn | 1.90% | 0.73%(+1.17)#84 | 0.13%(+1.77)#2,001 |
| 39. | White Oak | 1.87% | 0.73%(+1.14)#85 | 0.13%(+1.75)#2,002 |
| 40. | Greenbelt | 1.84% | 0.73%(+1.11)#86 | 0.13%(+1.71)#2,003 |
| 41. | Ferndale | 1.82% | 0.73%(+1.10)#87 | 0.13%(+1.70)#2,004 |
| 42. | Maryland City | 1.80% | 0.73%(+1.07)#88 | 0.13%(+1.67)#2,005 |
| 43. | Landover Hills | 1.79% | 0.73%(+1.07)#89 | 0.13%(+1.67)#2,006 |
| 44. | Severn | 1.78% | 0.73%(+1.06)#90 | 0.13%(+1.66)#2,007 |
| 45. | Kettering | 1.70% | 0.73%(+0.974)#91 | 0.13%(+1.58)#2,008 |
| 46. | Middle River | 1.66% | 0.73%(+0.932)#92 | 0.13%(+1.53)#2,009 |
| 47. | Adamstown | 1.59% | 0.73%(+0.860)#93 | 0.13%(+1.46)#2,010 |
| 48. | Beltsville | 1.49% | 0.73%(+0.760)#94 | 0.13%(+1.36)#2,011 |
| 49. | Abingdon | 1.45% | 0.73%(+0.720)#95 | 0.13%(+1.32)#2,012 |
| 50. | Point Of Rocks | 1.40% | 0.73%(+0.671)#96 | 0.13%(+1.27)#2,013 |
| 51. | Reisterstown | 1.40% | 0.73%(+0.670)#97 | 0.13%(+1.27)#2,014 |
| 52. | Fairmount Heights | 1.34% | 0.73%(+0.615)#98 | 0.13%(+1.22)#2,015 |
| 53. | Bowleys Quarters | 1.33% | 0.73%(+0.607)#99 | 0.13%(+1.21)#2,016 |
| 54. | Essex | 1.30% | 0.73%(+0.573)#100 | 0.13%(+1.17)#2,017 |
| 55. | Fulton | 1.29% | 0.73%(+0.560)#101 | 0.13%(+1.16)#2,018 |
| 56. | Glen Burnie | 1.24% | 0.73%(+0.517)#102 | 0.13%(+1.12)#2,019 |
| 57. | Marlton | 1.24% | 0.73%(+0.512)#103 | 0.13%(+1.11)#2,020 |
| 58. | Riverdale Park | 1.24% | 0.73%(+0.508)#104 | 0.13%(+1.11)#2,021 |
| 59. | Peppermill Village | 1.22% | 0.73%(+0.497)#105 | 0.13%(+1.10)#2,022 |
| 60. | Overlea | 1.19% | 0.73%(+0.461)#106 | 0.13%(+1.06)#2,023 |
| 61. | East Riverdale | 1.14% | 0.73%(+0.417)#107 | 0.13%(+1.02)#2,024 |
| 62. | Parkville | 1.13% | 0.73%(+0.400)#108 | 0.13%(+1.00)#2,025 |
| 63. | Hillandale | 1.10% | 0.73%(+0.372)#109 | 0.13%(+0.974)#2,026 |
| 64. | Scaggsville | 0.97% | 0.73%(+0.245)#110 | 0.13%(+0.847)#2,027 |
| 65. | Brock Hall | 0.97% | 0.73%(+0.238)#111 | 0.13%(+0.840)#2,028 |
| 66. | Westphalia | 0.95% | 0.73%(+0.223)#112 | 0.13%(+0.824)#2,029 |
| 67. | Perry Hall | 0.92% | 0.73%(+0.189)#113 | 0.13%(+0.790)#2,030 |
| 68. | Chillum | 0.90% | 0.73%(+0.175)#114 | 0.13%(+0.777)#2,031 |
| 69. | Odenton | 0.88% | 0.73%(+0.154)#115 | 0.13%(+0.756)#2,032 |
| 70. | Perryman | 0.83% | 0.73%(+0.105)#116 | 0.13%(+0.707)#2,033 |
| 71. | Waldorf | 0.83% | 0.73%(+0.100)#117 | 0.13%(+0.702)#2,034 |
| 72. | Columbia | 0.79% | 0.73%(+0.064)#118 | 0.13%(+0.666)#2,035 |
| 73. | Hyattsville | 0.72% | 0.73%(-0.003)#119 | 0.13%(+0.598)#2,036 |
| 74. | College Park | 0.72% | 0.73%(-0.007)#120 | 0.13%(+0.595)#2,037 |
| 75. | Adelphi | 0.72% | 0.73%(-0.007)#121 | 0.13%(+0.594)#2,038 |
| 76. | Carney | 0.68% | 0.73%(-0.046)#122 | 0.13%(+0.556)#2,039 |
| 77. | Woodlawn Cdp Baltimore County | 0.65% | 0.73%(-0.081)#123 | 0.13%(+0.521)#2,040 |
| 78. | Aberdeen | 0.63% | 0.73%(-0.094)#124 | 0.13%(+0.508)#2,041 |
| 79. | Capitol Heights | 0.62% | 0.73%(-0.108)#125 | 0.13%(+0.494)#2,042 |
| 80. | Coral Hills | 0.62% | 0.73%(-0.111)#126 | 0.13%(+0.490)#2,043 |
| 81. | Walker Mill | 0.61% | 0.73%(-0.116)#127 | 0.13%(+0.486)#2,044 |
| 82. | Baltimore | 0.61% | 0.73%(-0.120)#128 | 0.13%(+0.481)#2,045 |
| 83. | Fairland | 0.60% | 0.73%(-0.123)#129 | 0.13%(+0.478)#2,046 |
| 84. | Towson | 0.60% | 0.73%(-0.123)#130 | 0.13%(+0.478)#2,047 |
| 85. | Camp Springs | 0.59% | 0.73%(-0.139)#131 | 0.13%(+0.463)#2,048 |
| 86. | Germantown | 0.58% | 0.73%(-0.146)#132 | 0.13%(+0.456)#2,049 |
| 87. | Melwood | 0.58% | 0.73%(-0.146)#133 | 0.13%(+0.456)#2,050 |
| 88. | Ellicott City | 0.58% | 0.73%(-0.149)#134 | 0.13%(+0.453)#2,051 |
| 89. | La Plata | 0.56% | 0.73%(-0.163)#135 | 0.13%(+0.438)#2,052 |
| 90. | Urbana | 0.55% | 0.73%(-0.174)#136 | 0.13%(+0.428)#2,053 |
| 91. | Konterra | 0.55% | 0.73%(-0.180)#137 | 0.13%(+0.422)#2,054 |
| 92. | Colesville | 0.55% | 0.73%(-0.180)#138 | 0.13%(+0.422)#2,055 |
| 93. | Queensland | 0.54% | 0.73%(-0.187)#139 | 0.13%(+0.415)#2,056 |
| 94. | Indian Head | 0.51% | 0.73%(-0.219)#140 | 0.13%(+0.383)#2,057 |
| 95. | Catonsville | 0.50% | 0.73%(-0.225)#141 | 0.13%(+0.377)#2,058 |
| 96. | Chester | 0.49% | 0.73%(-0.234)#142 | 0.13%(+0.368)#2,059 |
| 97. | Oxford | 0.49% | 0.73%(-0.238)#143 | 0.13%(+0.364)#2,060 |
| 98. | Clarksburg | 0.47% | 0.73%(-0.255)#144 | 0.13%(+0.347)#2,061 |
| 99. | Clinton | 0.47% | 0.73%(-0.258)#145 | 0.13%(+0.344)#2,062 |
| 100. | Colmar Manor | 0.46% | 0.73%(-0.266)#146 | 0.13%(+0.336)#2,063 |
Common Questions
What are the Top 10 Cities with the Highest Percentage of Immigrants from Nigeria in Maryland?
Top 10 Cities with the Highest Percentage of Immigrants from Nigeria in Maryland are:
#1
6.59%
#2
6.43%
#3
6.11%
#4
6.09%
#5
5.83%
#6
5.52%
#7
5.42%
#8
5.29%
#9
4.95%
#10
4.81%
What city has the Highest Percentage of Immigrants from Nigeria in Maryland?
Milford Mill has the Highest Percentage of Immigrants from Nigeria in Maryland with 6.59%.
What is the Percentage of Immigrants from Nigeria in the State of Maryland?
Percentage of Immigrants from Nigeria in Maryland is 0.73%.
What is the Percentage of Immigrants from Nigeria in the United States?
Percentage of Immigrants from Nigeria in the United States is 0.13%.