Cities with the Highest Percentage of Immigrants from Haiti in Maryland
RELATED REPORTS & OPTIONS
Haiti
Maryland
Compare Cities
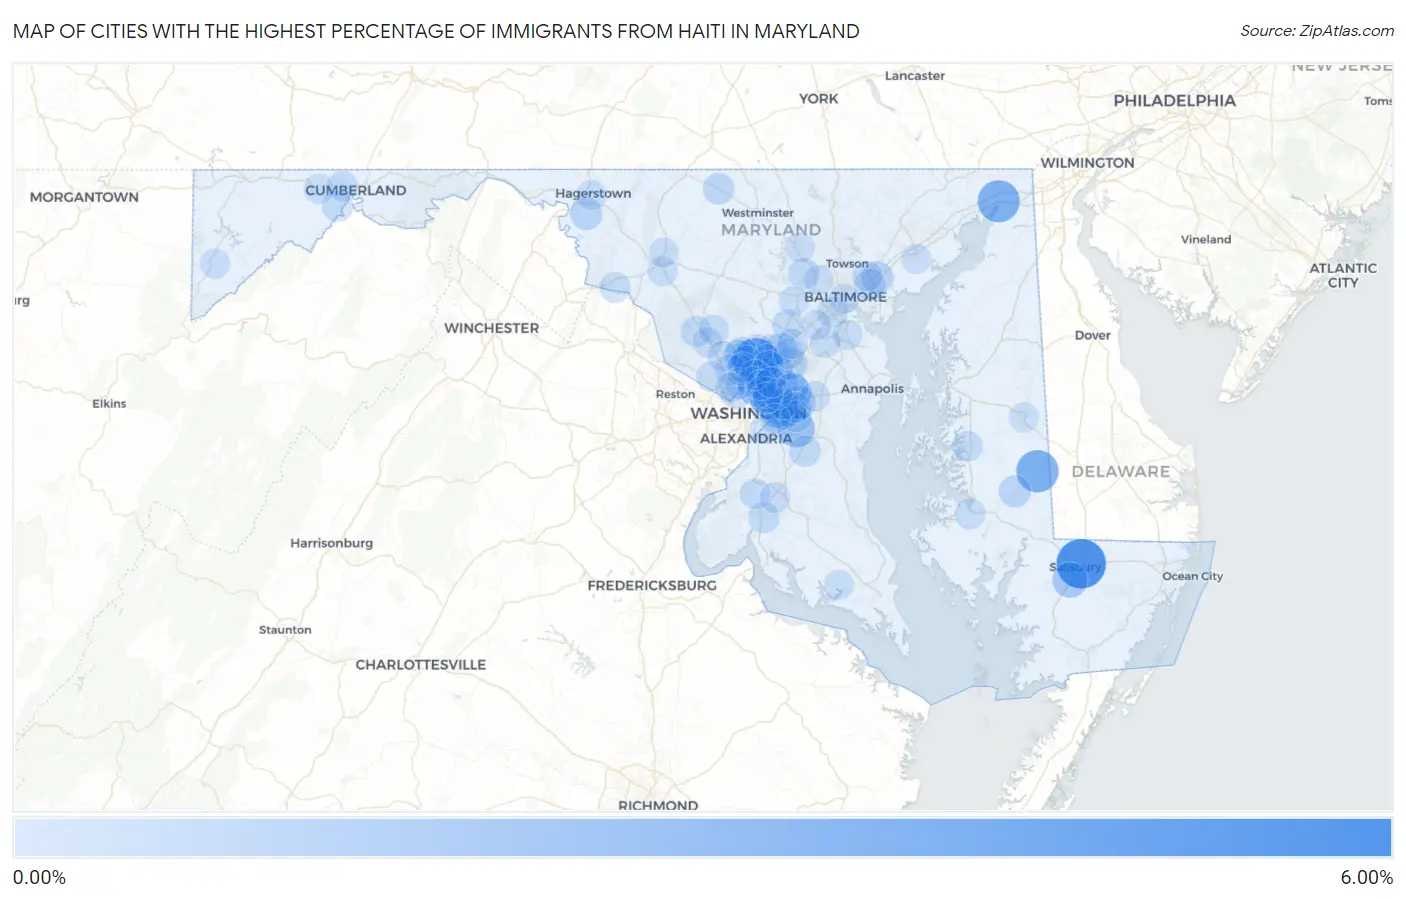
Map of Cities with the Highest Percentage of Immigrants from Haiti in Maryland
0.00%
6.00%
Cities with the Highest Percentage of Immigrants from Haiti in Maryland
| City | Haiti | vs State | vs National | |
| 1. | Salisbury | 5.21% | 0.15%(+5.06)#86 | 0.21%(+5.00)#3,530 |
| 2. | Colesville | 4.25% | 0.15%(+4.11)#87 | 0.21%(+4.04)#3,531 |
| 3. | Federalsburg | 3.23% | 0.15%(+3.08)#131 | 0.21%(+3.02)#4,940 |
| 4. | North East | 3.15% | 0.15%(+3.00)#191 | 0.21%(+2.94)#7,173 |
| 5. | Westphalia | 1.89% | 0.15%(+1.74)#192 | 0.21%(+1.68)#7,174 |
| 6. | Lanham | 1.87% | 0.15%(+1.72)#193 | 0.21%(+1.66)#7,175 |
| 7. | Takoma Park | 1.69% | 0.15%(+1.55)#194 | 0.21%(+1.48)#7,176 |
| 8. | Cottage City | 1.61% | 0.15%(+1.47)#195 | 0.21%(+1.40)#7,177 |
| 9. | White Oak | 1.55% | 0.15%(+1.40)#196 | 0.21%(+1.34)#7,178 |
| 10. | Summerfield | 1.52% | 0.15%(+1.37)#197 | 0.21%(+1.31)#7,179 |
| 11. | Fruitland | 1.37% | 0.15%(+1.23)#198 | 0.21%(+1.16)#7,429 |
| 12. | Adelphi | 1.23% | 0.15%(+1.09)#199 | 0.21%(+1.02)#7,430 |
| 13. | Beltsville | 1.23% | 0.15%(+1.09)#200 | 0.21%(+1.02)#7,431 |
| 14. | Colmar Manor | 1.06% | 0.15%(+0.908)#201 | 0.21%(+0.846)#7,432 |
| 15. | Peppermill Village | 1.03% | 0.15%(+0.882)#202 | 0.21%(+0.820)#7,433 |
| 16. | Hillandale | 1.00% | 0.15%(+0.852)#203 | 0.21%(+0.790)#7,434 |
| 17. | Woodlawn Cdp Prince George S County | 0.98% | 0.15%(+0.837)#204 | 0.21%(+0.775)#7,435 |
| 18. | Mitchellville | 0.96% | 0.15%(+0.811)#205 | 0.21%(+0.749)#7,436 |
| 19. | Fairmount Heights | 0.87% | 0.15%(+0.725)#206 | 0.21%(+0.663)#7,437 |
| 20. | Layhill | 0.72% | 0.15%(+0.570)#207 | 0.21%(+0.508)#7,438 |
| 21. | Abingdon | 0.70% | 0.15%(+0.557)#261 | 0.21%(+0.495)#10,304 |
| 22. | St James | 0.63% | 0.15%(+0.486)#262 | 0.21%(+0.423)#10,305 |
| 23. | Burnt Mills | 0.63% | 0.15%(+0.485)#263 | 0.21%(+0.423)#10,306 |
| 24. | Rossville | 0.57% | 0.15%(+0.426)#264 | 0.21%(+0.364)#10,307 |
| 25. | Seabrook | 0.53% | 0.15%(+0.384)#265 | 0.21%(+0.322)#10,308 |
| 26. | Hurlock | 0.53% | 0.15%(+0.378)#266 | 0.21%(+0.316)#10,309 |
| 27. | South Laurel | 0.51% | 0.15%(+0.366)#267 | 0.21%(+0.304)#10,310 |
| 28. | Burtonsville | 0.47% | 0.15%(+0.327)#268 | 0.21%(+0.265)#10,311 |
| 29. | Greenbelt | 0.45% | 0.15%(+0.299)#269 | 0.21%(+0.237)#10,312 |
| 30. | Friendship Heights Village | 0.44% | 0.15%(+0.293)#270 | 0.21%(+0.231)#10,313 |
| 31. | Chillum | 0.41% | 0.15%(+0.267)#271 | 0.21%(+0.205)#10,314 |
| 32. | Rosedale | 0.41% | 0.15%(+0.261)#272 | 0.21%(+0.199)#10,315 |
| 33. | Taneytown | 0.40% | 0.15%(+0.253)#296 | 0.21%(+0.191)#12,292 |
| 34. | Largo | 0.37% | 0.15%(+0.227)#297 | 0.21%(+0.164)#12,293 |
| 35. | West Laurel | 0.37% | 0.15%(+0.222)#298 | 0.21%(+0.160)#12,294 |
| 36. | Cloverly | 0.37% | 0.15%(+0.217)#299 | 0.21%(+0.155)#12,295 |
| 37. | Fairland | 0.34% | 0.15%(+0.195)#300 | 0.21%(+0.133)#12,296 |
| 38. | Marlton | 0.33% | 0.15%(+0.187)#301 | 0.21%(+0.125)#12,297 |
| 39. | Randallstown | 0.33% | 0.15%(+0.181)#302 | 0.21%(+0.119)#12,298 |
| 40. | Leisure World | 0.31% | 0.15%(+0.164)#303 | 0.21%(+0.102)#12,299 |
| 41. | Glenmont | 0.30% | 0.15%(+0.153)#304 | 0.21%(+0.091)#12,300 |
| 42. | Cresaptown | 0.29% | 0.15%(+0.147)#305 | 0.21%(+0.085)#12,301 |
| 43. | Chevy Chase | 0.29% | 0.15%(+0.138)#306 | 0.21%(+0.076)#12,302 |
| 44. | Landover | 0.28% | 0.15%(+0.135)#307 | 0.21%(+0.073)#12,303 |
| 45. | Columbia | 0.28% | 0.15%(+0.135)#308 | 0.21%(+0.073)#12,304 |
| 46. | La Plata | 0.28% | 0.15%(+0.134)#309 | 0.21%(+0.072)#12,305 |
| 47. | Silver Spring | 0.28% | 0.15%(+0.129)#310 | 0.21%(+0.066)#12,306 |
| 48. | Lansdowne | 0.27% | 0.15%(+0.122)#311 | 0.21%(+0.060)#12,307 |
| 49. | Calverton | 0.26% | 0.15%(+0.114)#312 | 0.21%(+0.052)#12,308 |
| 50. | Brunswick | 0.26% | 0.15%(+0.109)#313 | 0.21%(+0.047)#12,309 |
| 51. | Flower Hill | 0.25% | 0.15%(+0.105)#314 | 0.21%(+0.043)#12,310 |
| 52. | Germantown | 0.22% | 0.15%(+0.076)#315 | 0.21%(+0.014)#12,311 |
| 53. | Aspen Hill | 0.22% | 0.15%(+0.075)#316 | 0.21%(+0.013)#12,312 |
| 54. | North Bethesda | 0.22% | 0.15%(+0.067)#317 | 0.21%(+0.005)#12,313 |
| 55. | Laurel | 0.21% | 0.15%(+0.059)#318 | 0.21%(-0.004)#12,314 |
| 56. | Cambridge | 0.20% | 0.15%(+0.051)#319 | 0.21%(-0.011)#12,315 |
| 57. | Mount Rainier | 0.19% | 0.15%(+0.046)#320 | 0.21%(-0.016)#12,316 |
| 58. | Easton | 0.19% | 0.15%(+0.045)#321 | 0.21%(-0.017)#12,317 |
| 59. | Hyattsville | 0.19% | 0.15%(+0.044)#322 | 0.21%(-0.018)#12,318 |
| 60. | La Vale | 0.18% | 0.15%(+0.036)#340 | 0.21%(-0.026)#15,900 |
| 61. | Bensville | 0.17% | 0.15%(+0.021)#341 | 0.21%(-0.041)#15,901 |
| 62. | Severn | 0.16% | 0.15%(+0.008)#342 | 0.21%(-0.054)#15,902 |
| 63. | Lake Arbor | 0.15% | 0.15%(+0.007)#343 | 0.21%(-0.055)#15,903 |
| 64. | Hillcrest Heights | 0.14% | 0.15%(-0.008)#344 | 0.21%(-0.070)#15,904 |
| 65. | North Kensington | 0.13% | 0.15%(-0.018)#345 | 0.21%(-0.080)#15,905 |
| 66. | North Laurel | 0.11% | 0.15%(-0.041)#346 | 0.21%(-0.103)#15,906 |
| 67. | Mountain Lake Park | 0.094% | 0.15%(-0.053)#365 | 0.21%(-0.115)#17,801 |
| 68. | Waldorf | 0.094% | 0.15%(-0.054)#366 | 0.21%(-0.116)#17,802 |
| 69. | Brentwood | 0.079% | 0.15%(-0.068)#367 | 0.21%(-0.130)#17,803 |
| 70. | Overlea | 0.078% | 0.15%(-0.070)#368 | 0.21%(-0.132)#17,804 |
| 71. | Edgewood | 0.076% | 0.15%(-0.072)#369 | 0.21%(-0.134)#17,805 |
| 72. | Glen Burnie | 0.070% | 0.15%(-0.078)#370 | 0.21%(-0.140)#17,806 |
| 73. | Baltimore | 0.061% | 0.15%(-0.086)#371 | 0.21%(-0.149)#17,807 |
| 74. | Gaithersburg | 0.059% | 0.15%(-0.088)#372 | 0.21%(-0.150)#17,808 |
| 75. | Frostburg | 0.056% | 0.15%(-0.091)#373 | 0.21%(-0.154)#17,809 |
| 76. | East Riverdale | 0.055% | 0.15%(-0.092)#374 | 0.21%(-0.154)#17,810 |
| 77. | Four Corners | 0.052% | 0.15%(-0.096)#375 | 0.21%(-0.158)#17,811 |
| 78. | Langley Park | 0.051% | 0.15%(-0.097)#376 | 0.21%(-0.159)#17,812 |
| 79. | Ballenger Creek | 0.049% | 0.15%(-0.098)#377 | 0.21%(-0.160)#17,813 |
| 80. | Montgomery Village | 0.049% | 0.15%(-0.099)#378 | 0.21%(-0.161)#17,814 |
| 81. | College Park | 0.046% | 0.15%(-0.101)#379 | 0.21%(-0.163)#17,815 |
| 82. | Rockville | 0.046% | 0.15%(-0.102)#380 | 0.21%(-0.164)#17,816 |
| 83. | Coral Hills | 0.042% | 0.15%(-0.105)#381 | 0.21%(-0.167)#17,817 |
| 84. | Elkridge | 0.036% | 0.15%(-0.112)#382 | 0.21%(-0.174)#17,818 |
| 85. | Lochearn | 0.033% | 0.15%(-0.114)#383 | 0.21%(-0.177)#17,819 |
| 86. | Wheaton | 0.030% | 0.15%(-0.117)#384 | 0.21%(-0.179)#17,820 |
| 87. | Bowie | 0.024% | 0.15%(-0.124)#385 | 0.21%(-0.186)#17,821 |
| 88. | Bethesda | 0.024% | 0.15%(-0.124)#386 | 0.21%(-0.186)#17,822 |
| 89. | Leonardtown | 0.022% | 0.15%(-0.126)#387 | 0.21%(-0.188)#17,823 |
| 90. | Frederick | 0.022% | 0.15%(-0.126)#388 | 0.21%(-0.188)#17,824 |
| 91. | Hagerstown | 0.021% | 0.15%(-0.127)#389 | 0.21%(-0.189)#17,825 |
| 92. | Denton | 0.021% | 0.15%(-0.127)#390 | 0.21%(-0.189)#17,826 |
| 93. | Potomac | 0.019% | 0.15%(-0.128)#391 | 0.21%(-0.190)#17,827 |
| 94. | Ellicott City | 0.019% | 0.15%(-0.129)#392 | 0.21%(-0.191)#17,828 |
| 95. | Woodlawn Cdp Baltimore County | 0.0047% | 0.15%(-0.143)#393 | 0.21%(-0.205)#17,829 |
| 96. | Reisterstown | 0.0036% | 0.15%(-0.144)#394 | 0.21%(-0.206)#17,830 |
Common Questions
What are the Top 10 Cities with the Highest Percentage of Immigrants from Haiti in Maryland?
Top 10 Cities with the Highest Percentage of Immigrants from Haiti in Maryland are:
#1
5.21%
#2
4.25%
#3
3.23%
#4
3.15%
#5
1.89%
#6
1.87%
#7
1.69%
#8
1.61%
#9
1.55%
#10
1.52%
What city has the Highest Percentage of Immigrants from Haiti in Maryland?
Salisbury has the Highest Percentage of Immigrants from Haiti in Maryland with 5.21%.
What is the Percentage of Immigrants from Haiti in the State of Maryland?
Percentage of Immigrants from Haiti in Maryland is 0.15%.
What is the Percentage of Immigrants from Haiti in the United States?
Percentage of Immigrants from Haiti in the United States is 0.21%.