Drum Point, MD
Drum Point Map
Drum Point Overview
2,979
TOTAL POPULATION
1,458
MALE POPULATION
1,521
FEMALE POPULATION
95.86
MALES / 100 FEMALES
104.32
FEMALES / 100 MALES
41.9
MEDIAN AGE
3.3
AVG FAMILY SIZE
2.9
AVG HOUSEHOLD SIZE
$52,842
PER CAPITA INCOME
$150,386
AVG FAMILY INCOME
$135,216
AVG HOUSEHOLD INCOME
29.4%
WAGE / INCOME GAP [ % ]
70.6¢/ $1
WAGE / INCOME GAP [ $ ]
0.44
INEQUALITY / GINI INDEX
1,503
LABOR FORCE [ PEOPLE ]
61.1%
PERCENT IN LABOR FORCE
3.0%
UNEMPLOYMENT RATE
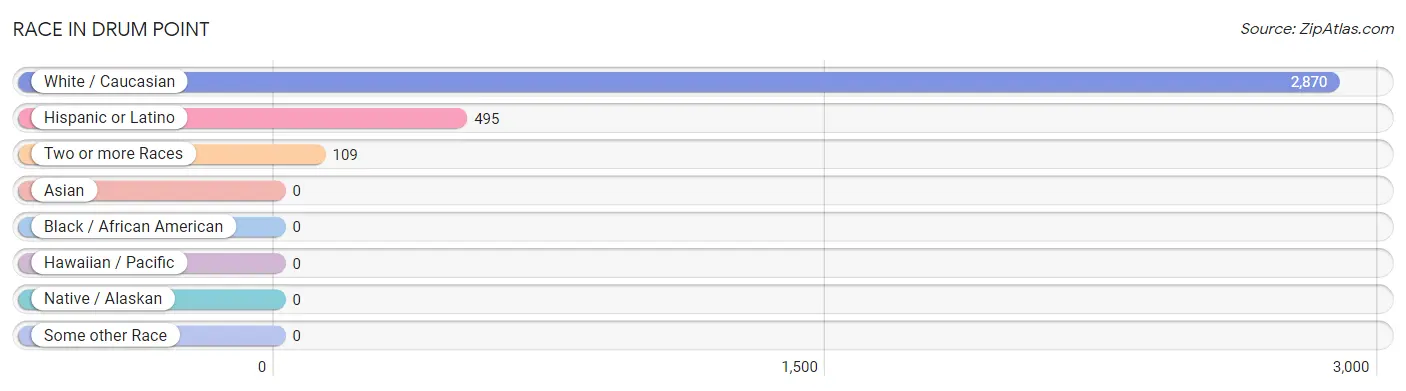
Race in Drum Point
The most populous races in Drum Point are White / Caucasian (2,870 | 96.3%), Hispanic or Latino (495 | 16.6%), and Two or more Races (109 | 3.7%).
| Race | # Population | % Population |
| Asian | 0 | 0.0% |
| Black / African American | 0 | 0.0% |
| Hawaiian / Pacific | 0 | 0.0% |
| Hispanic or Latino | 495 | 16.6% |
| Native / Alaskan | 0 | 0.0% |
| White / Caucasian | 2,870 | 96.3% |
| Two or more Races | 109 | 3.7% |
| Some other Race | 0 | 0.0% |
| Total | 2,979 | 100.0% |
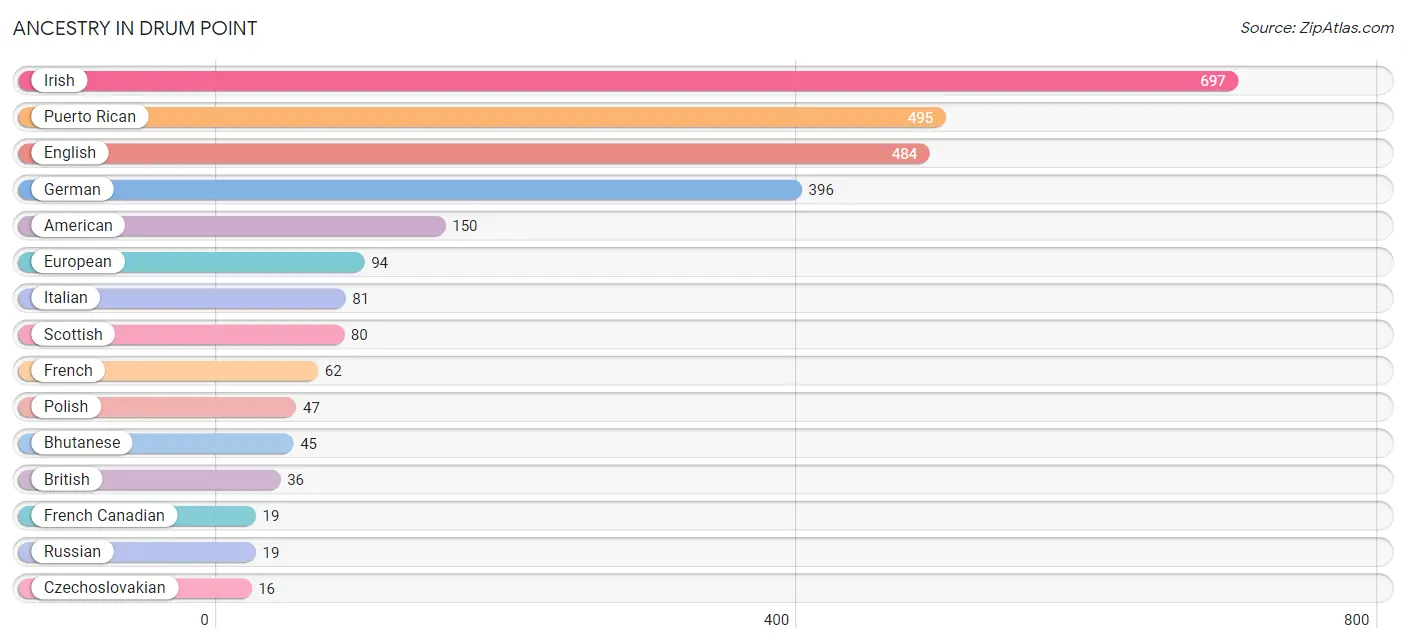
Ancestry in Drum Point
The most populous ancestries reported in Drum Point are Irish (697 | 23.4%), Puerto Rican (495 | 16.6%), English (484 | 16.3%), German (396 | 13.3%), and American (150 | 5.0%), together accounting for 74.6% of all Drum Point residents.
| Ancestry | # Population | % Population |
| American | 150 | 5.0% |
| Bhutanese | 45 | 1.5% |
| British | 36 | 1.2% |
| Czechoslovakian | 16 | 0.5% |
| English | 484 | 16.3% |
| European | 94 | 3.2% |
| French | 62 | 2.1% |
| French Canadian | 19 | 0.6% |
| German | 396 | 13.3% |
| Irish | 697 | 23.4% |
| Italian | 81 | 2.7% |
| Lithuanian | 8 | 0.3% |
| Norwegian | 6 | 0.2% |
| Polish | 47 | 1.6% |
| Puerto Rican | 495 | 16.6% |
| Russian | 19 | 0.6% |
| Scottish | 80 | 2.7% |
| Welsh | 16 | 0.5% | View All 18 Rows |
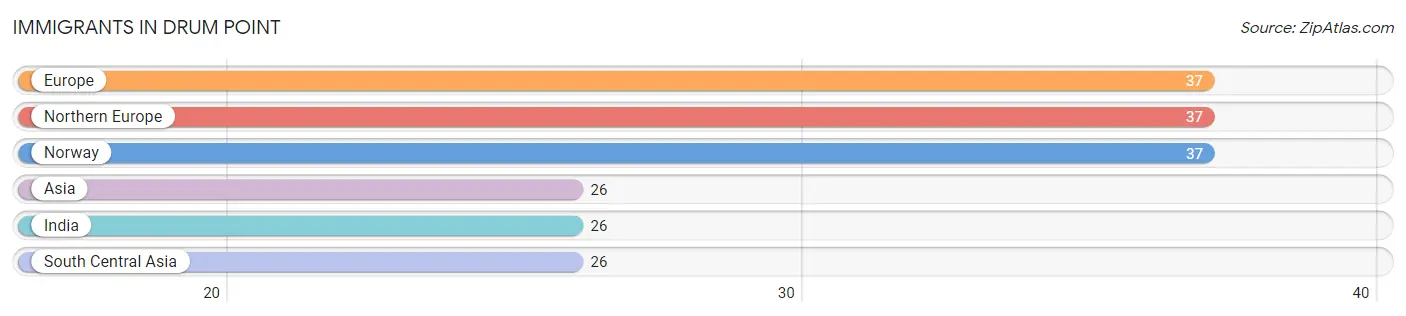
Immigrants in Drum Point
The most numerous immigrant groups reported in Drum Point came from Europe (37 | 1.2%), Northern Europe (37 | 1.2%), Norway (37 | 1.2%), Asia (26 | 0.9%), and India (26 | 0.9%), together accounting for 5.5% of all Drum Point residents.
| Immigration Origin | # Population | % Population |
| Asia | 26 | 0.9% |
| Europe | 37 | 1.2% |
| India | 26 | 0.9% |
| Northern Europe | 37 | 1.2% |
| Norway | 37 | 1.2% |
| South Central Asia | 26 | 0.9% | View All 6 Rows |
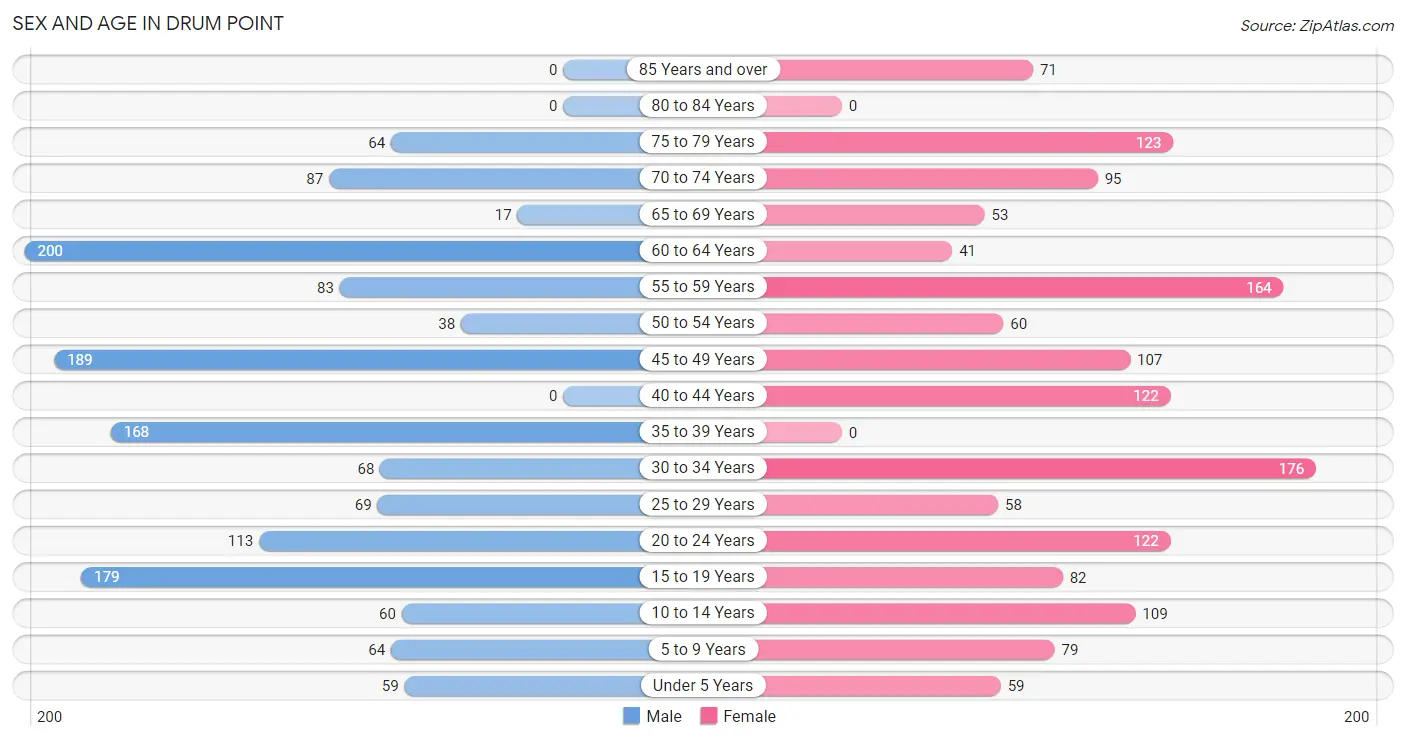
Sex and Age in Drum Point
Sex and Age in Drum Point
The most populous age groups in Drum Point are 60 to 64 Years (200 | 13.7%) for men and 30 to 34 Years (176 | 11.6%) for women.
| Age Bracket | Male | Female |
| Under 5 Years | 59 (4.1%) | 59 (3.9%) |
| 5 to 9 Years | 64 (4.4%) | 79 (5.2%) |
| 10 to 14 Years | 60 (4.1%) | 109 (7.2%) |
| 15 to 19 Years | 179 (12.3%) | 82 (5.4%) |
| 20 to 24 Years | 113 (7.7%) | 122 (8.0%) |
| 25 to 29 Years | 69 (4.7%) | 58 (3.8%) |
| 30 to 34 Years | 68 (4.7%) | 176 (11.6%) |
| 35 to 39 Years | 168 (11.5%) | 0 (0.0%) |
| 40 to 44 Years | 0 (0.0%) | 122 (8.0%) |
| 45 to 49 Years | 189 (13.0%) | 107 (7.0%) |
| 50 to 54 Years | 38 (2.6%) | 60 (3.9%) |
| 55 to 59 Years | 83 (5.7%) | 164 (10.8%) |
| 60 to 64 Years | 200 (13.7%) | 41 (2.7%) |
| 65 to 69 Years | 17 (1.2%) | 53 (3.5%) |
| 70 to 74 Years | 87 (6.0%) | 95 (6.2%) |
| 75 to 79 Years | 64 (4.4%) | 123 (8.1%) |
| 80 to 84 Years | 0 (0.0%) | 0 (0.0%) |
| 85 Years and over | 0 (0.0%) | 71 (4.7%) |
| Total | 1,458 (100.0%) | 1,521 (100.0%) |
Families and Households in Drum Point
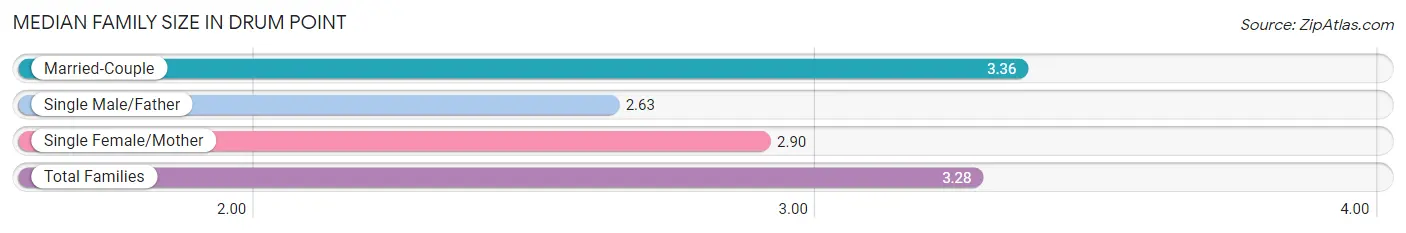
Median Family Size in Drum Point
The median family size in Drum Point is 3.28 persons per family, with married-couple families (719 | 86.5%) accounting for the largest median family size of 3.36 persons per family. On the other hand, single male/father families (40 | 4.8%) represent the smallest median family size with 2.63 persons per family.
| Family Type | # Families | Family Size |
| Married-Couple | 719 (86.5%) | 3.36 |
| Single Male/Father | 40 (4.8%) | 2.63 |
| Single Female/Mother | 72 (8.7%) | 2.90 |
| Total Families | 831 (100.0%) | 3.28 |
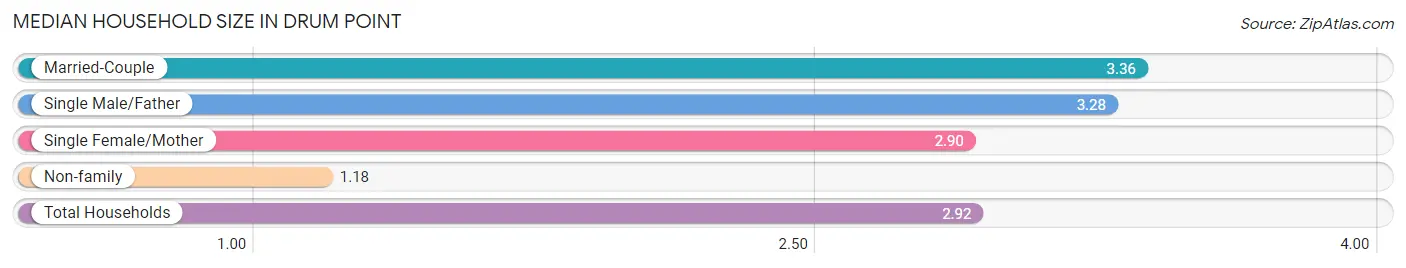
Median Household Size in Drum Point
The median household size in Drum Point is 2.92 persons per household, with married-couple households (719 | 70.4%) accounting for the largest median household size of 3.36 persons per household. non-family households (190 | 18.6%) represent the smallest median household size with 1.18 persons per household.
| Household Type | # Households | Household Size |
| Married-Couple | 719 (70.4%) | 3.36 |
| Single Male/Father | 40 (3.9%) | 3.28 |
| Single Female/Mother | 72 (7.0%) | 2.90 |
| Non-family | 190 (18.6%) | 1.18 |
| Total Households | 1,021 (100.0%) | 2.92 |
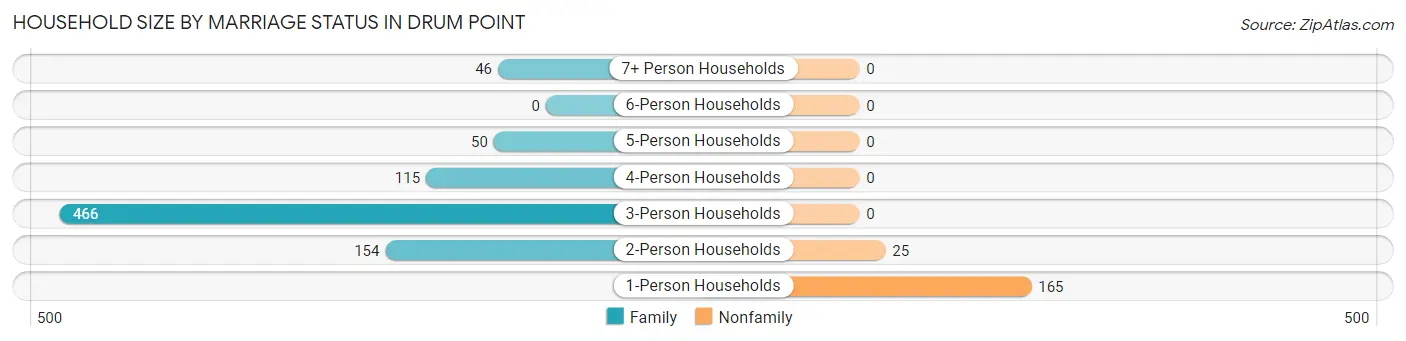
Household Size by Marriage Status in Drum Point
Out of a total of 1,021 households in Drum Point, 831 (81.4%) are family households, while 190 (18.6%) are nonfamily households. The most numerous type of family households are 3-person households, comprising 466, and the most common type of nonfamily households are 1-person households, comprising 165.
| Household Size | Family Households | Nonfamily Households |
| 1-Person Households | - | 165 (16.2%) |
| 2-Person Households | 154 (15.1%) | 25 (2.5%) |
| 3-Person Households | 466 (45.6%) | 0 (0.0%) |
| 4-Person Households | 115 (11.3%) | 0 (0.0%) |
| 5-Person Households | 50 (4.9%) | 0 (0.0%) |
| 6-Person Households | 0 (0.0%) | 0 (0.0%) |
| 7+ Person Households | 46 (4.5%) | 0 (0.0%) |
| Total | 831 (81.4%) | 190 (18.6%) |
Female Fertility in Drum Point
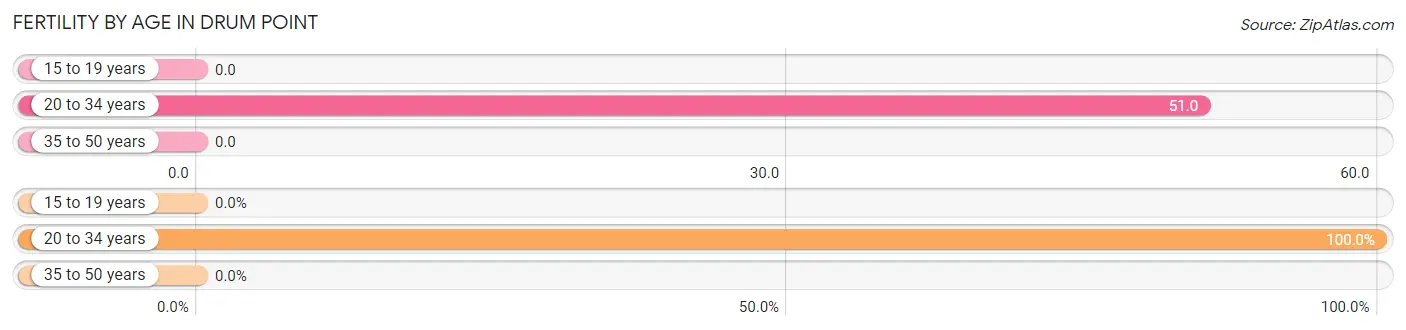
Fertility by Age in Drum Point
Average fertility rate in Drum Point is 27.0 births per 1,000 women. Women in the age bracket of 20 to 34 years have the highest fertility rate with 51.0 births per 1,000 women. Women in the age bracket of 20 to 34 years acount for 100.0% of all women with births.
| Age Bracket | Women with Births | Births / 1,000 Women |
| 15 to 19 years | 0 (0.0%) | 0.0 |
| 20 to 34 years | 18 (100.0%) | 51.0 |
| 35 to 50 years | 0 (0.0%) | 0.0 |
| Total | 18 (100.0%) | 27.0 |
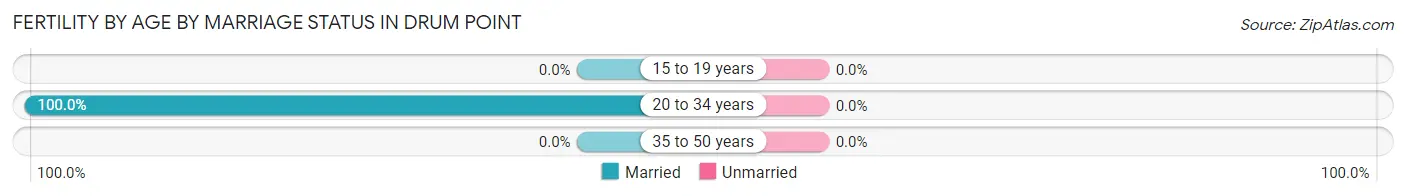
Fertility by Age by Marriage Status in Drum Point
| Age Bracket | Married | Unmarried |
| 15 to 19 years | 0 (0.0%) | 0 (0.0%) |
| 20 to 34 years | 18 (100.0%) | 0 (0.0%) |
| 35 to 50 years | 0 (0.0%) | 0 (0.0%) |
| Total | 18 (100.0%) | 0 (0.0%) |
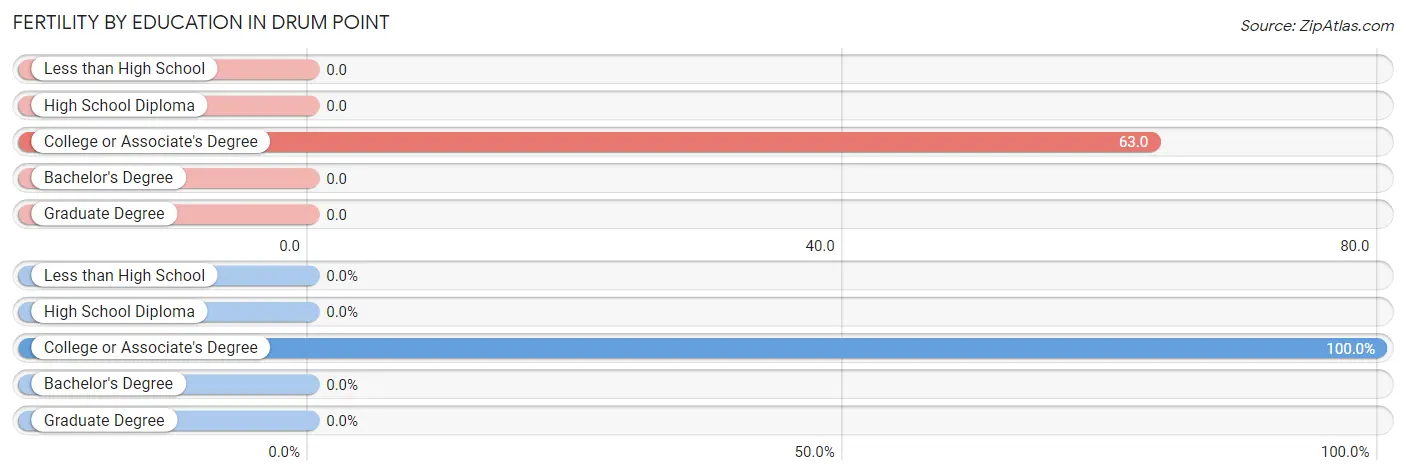
Fertility by Education in Drum Point
| Educational Attainment | Women with Births | Births / 1,000 Women |
| Less than High School | 0 (0.0%) | 0.0 |
| High School Diploma | 0 (0.0%) | 0.0 |
| College or Associate's Degree | 18 (100.0%) | 63.0 |
| Bachelor's Degree | 0 (0.0%) | 0.0 |
| Graduate Degree | 0 (0.0%) | 0.0 |
| Total | 18 (100.0%) | 27.0 |
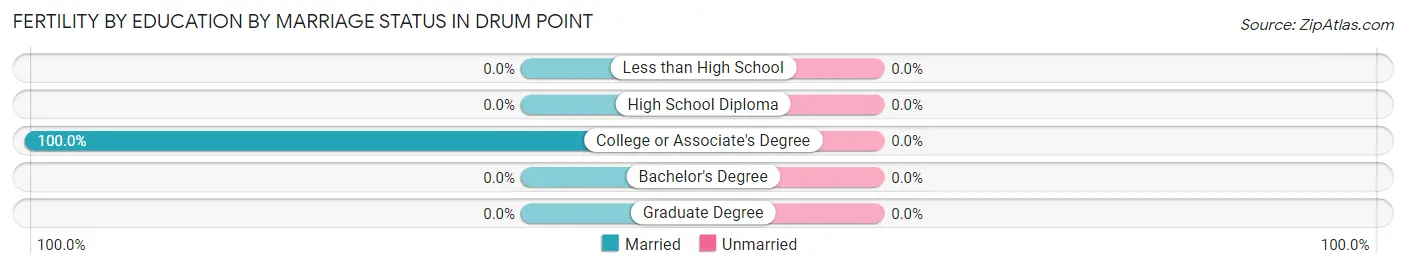
Fertility by Education by Marriage Status in Drum Point
| Educational Attainment | Married | Unmarried |
| Less than High School | 0 (0.0%) | 0 (0.0%) |
| High School Diploma | 0 (0.0%) | 0 (0.0%) |
| College or Associate's Degree | 18 (100.0%) | 0 (0.0%) |
| Bachelor's Degree | 0 (0.0%) | 0 (0.0%) |
| Graduate Degree | 0 (0.0%) | 0 (0.0%) |
| Total | 18 (100.0%) | 0 (0.0%) |
Income in Drum Point
Income Overview in Drum Point
Per Capita Income in Drum Point is $52,842, while median incomes of families and households are $150,386 and $135,216 respectively.
| Characteristic | Number | Measure |
| Per Capita Income | 2,979 | $52,842 |
| Median Family Income | 831 | $150,386 |
| Mean Family Income | 831 | $170,225 |
| Median Household Income | 1,021 | $135,216 |
| Mean Household Income | 1,021 | $148,864 |
| Income Deficit | 831 | $0 |
| Wage / Income Gap (%) | 2,979 | 29.43% |
| Wage / Income Gap ($) | 2,979 | 70.57¢ per $1 |
| Gini / Inequality Index | 2,979 | 0.44 |
Earnings by Sex in Drum Point
Average Earnings in Drum Point are $66,968, $78,944 for men and $55,714 for women, a difference of 29.4%.
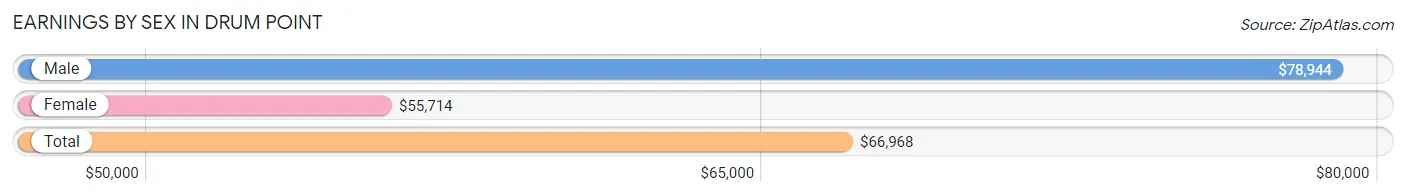
| Sex | Number | Average Earnings |
| Male | 830 (53.3%) | $78,944 |
| Female | 728 (46.7%) | $55,714 |
| Total | 1,558 (100.0%) | $66,968 |
Earnings by Sex by Income Bracket in Drum Point
The most common earnings brackets in Drum Point are $100,000+ for men (305 | 36.7%) and $100,000+ for women (122 | 16.8%).
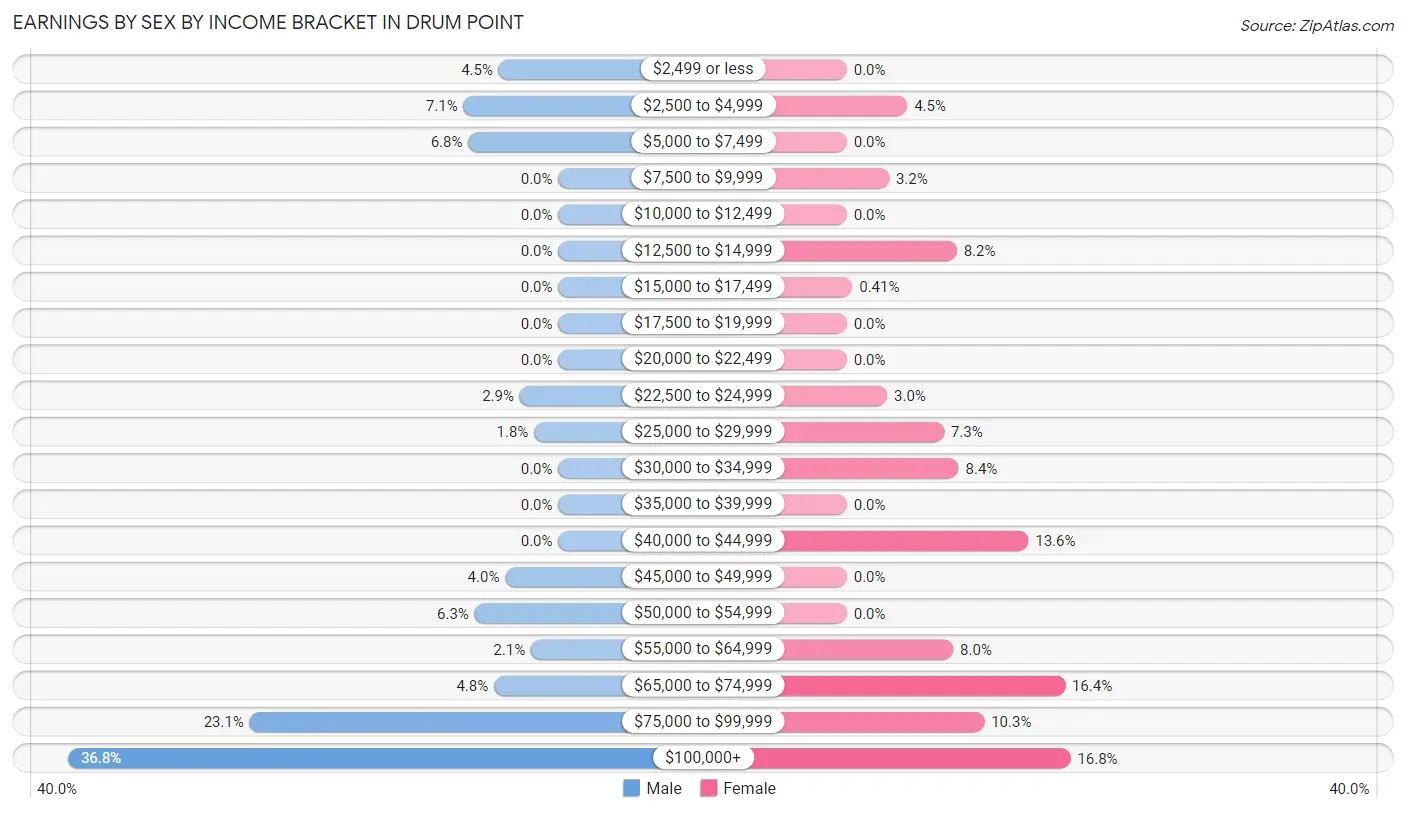
| Income | Male | Female |
| $2,499 or less | 37 (4.5%) | 0 (0.0%) |
| $2,500 to $4,999 | 59 (7.1%) | 33 (4.5%) |
| $5,000 to $7,499 | 56 (6.8%) | 0 (0.0%) |
| $7,500 to $9,999 | 0 (0.0%) | 23 (3.2%) |
| $10,000 to $12,499 | 0 (0.0%) | 0 (0.0%) |
| $12,500 to $14,999 | 0 (0.0%) | 60 (8.2%) |
| $15,000 to $17,499 | 0 (0.0%) | 3 (0.4%) |
| $17,500 to $19,999 | 0 (0.0%) | 0 (0.0%) |
| $20,000 to $22,499 | 0 (0.0%) | 0 (0.0%) |
| $22,500 to $24,999 | 24 (2.9%) | 22 (3.0%) |
| $25,000 to $29,999 | 15 (1.8%) | 53 (7.3%) |
| $30,000 to $34,999 | 0 (0.0%) | 61 (8.4%) |
| $35,000 to $39,999 | 0 (0.0%) | 0 (0.0%) |
| $40,000 to $44,999 | 0 (0.0%) | 99 (13.6%) |
| $45,000 to $49,999 | 33 (4.0%) | 0 (0.0%) |
| $50,000 to $54,999 | 52 (6.3%) | 0 (0.0%) |
| $55,000 to $64,999 | 17 (2.1%) | 58 (8.0%) |
| $65,000 to $74,999 | 40 (4.8%) | 119 (16.4%) |
| $75,000 to $99,999 | 192 (23.1%) | 75 (10.3%) |
| $100,000+ | 305 (36.7%) | 122 (16.8%) |
| Total | 830 (100.0%) | 728 (100.0%) |
Earnings by Sex by Educational Attainment in Drum Point
Average earnings in Drum Point are $79,639 for men and $65,346 for women, a difference of 17.9%. Men with an educational attainment of bachelor's degree enjoy the highest average annual earnings of $141,250, while those with high school diploma education earn the least with $51,250. Women with an educational attainment of graduate degree earn the most with the average annual earnings of $67,247, while those with high school diploma education have the smallest earnings of $42,311.
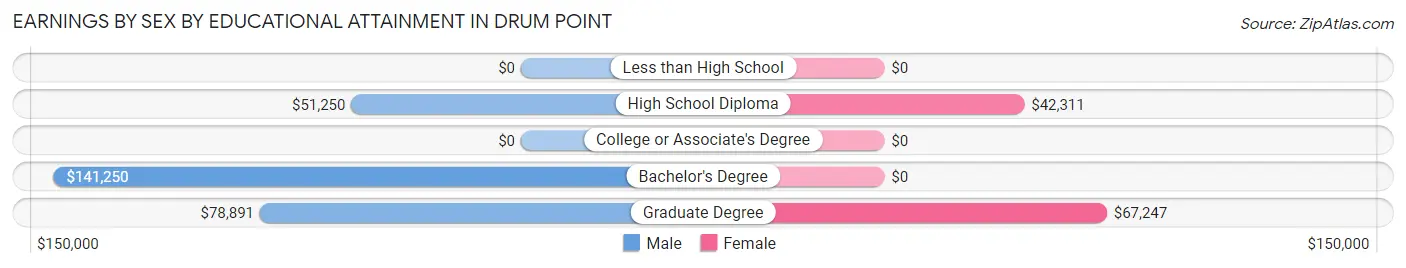
| Educational Attainment | Male Income | Female Income |
| Less than High School | - | - |
| High School Diploma | $51,250 | $42,311 |
| College or Associate's Degree | - | - |
| Bachelor's Degree | $141,250 | $0 |
| Graduate Degree | $78,891 | $67,247 |
| Total | $79,639 | $65,346 |
Family Income in Drum Point
Family Income Brackets in Drum Point
According to the Drum Point family income data, there are 229 families falling into the $200,000+ income range, which is the most common income bracket and makes up 27.6% of all families.
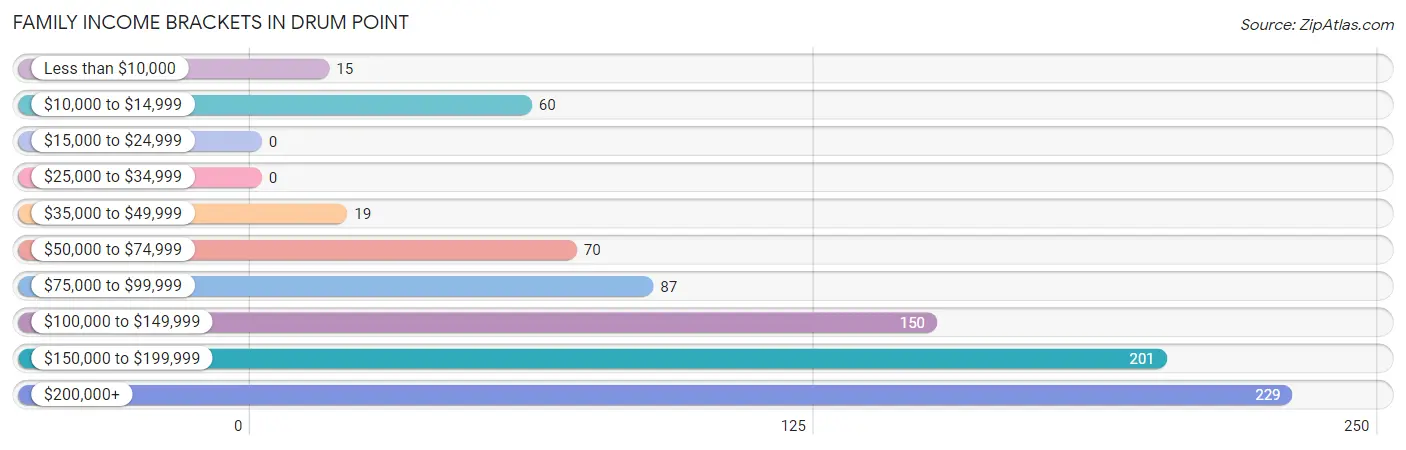
| Income Bracket | # Families | % Families |
| Less than $10,000 | 15 | 1.8% |
| $10,000 to $14,999 | 60 | 7.2% |
| $15,000 to $24,999 | 0 | 0.0% |
| $25,000 to $34,999 | 0 | 0.0% |
| $35,000 to $49,999 | 19 | 2.3% |
| $50,000 to $74,999 | 70 | 8.4% |
| $75,000 to $99,999 | 87 | 10.5% |
| $100,000 to $149,999 | 150 | 18.1% |
| $150,000 to $199,999 | 201 | 24.2% |
| $200,000+ | 229 | 27.6% |
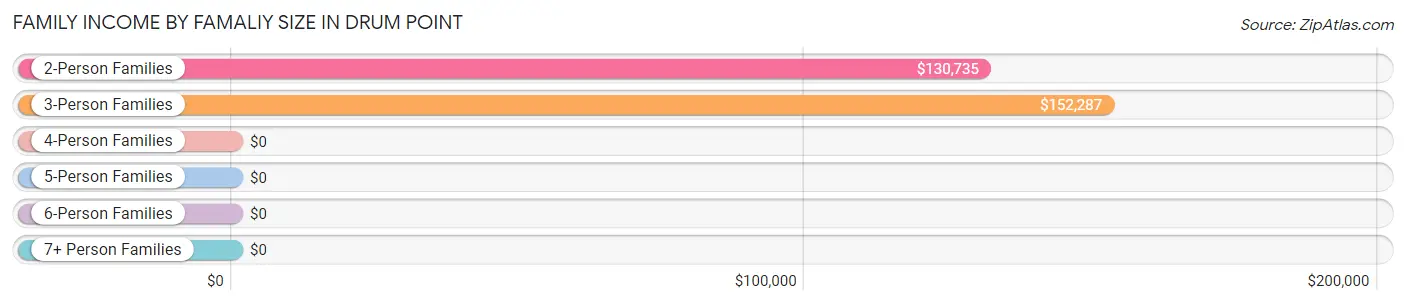
Family Income by Famaliy Size in Drum Point
3-person families (440 | 52.9%) account for the highest median family income in Drum Point with $152,287 per family, while 2-person families (180 | 21.7%) have the highest median income of $65,368 per family member.
| Income Bracket | # Families | Median Income |
| 2-Person Families | 180 (21.7%) | $130,735 |
| 3-Person Families | 440 (52.9%) | $152,287 |
| 4-Person Families | 115 (13.8%) | $0 |
| 5-Person Families | 50 (6.0%) | $0 |
| 6-Person Families | 0 (0.0%) | $0 |
| 7+ Person Families | 46 (5.5%) | $0 |
| Total | 831 (100.0%) | $150,386 |
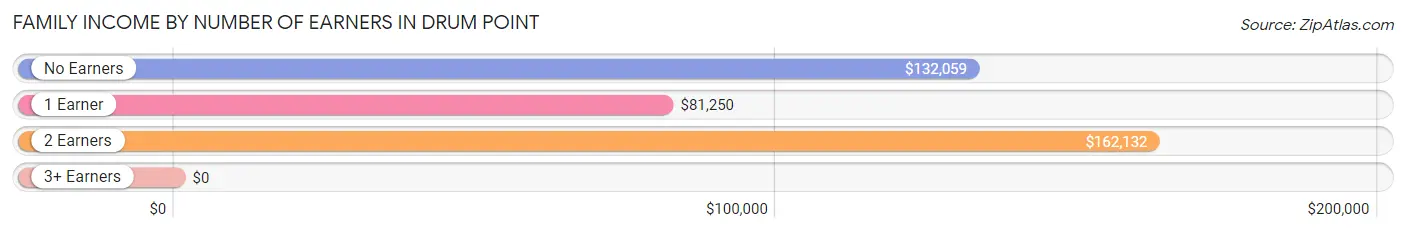
Family Income by Number of Earners in Drum Point
| Number of Earners | # Families | Median Income |
| No Earners | 114 (13.7%) | $132,059 |
| 1 Earner | 220 (26.5%) | $81,250 |
| 2 Earners | 387 (46.6%) | $162,132 |
| 3+ Earners | 110 (13.2%) | $0 |
| Total | 831 (100.0%) | $150,386 |
Household Income in Drum Point
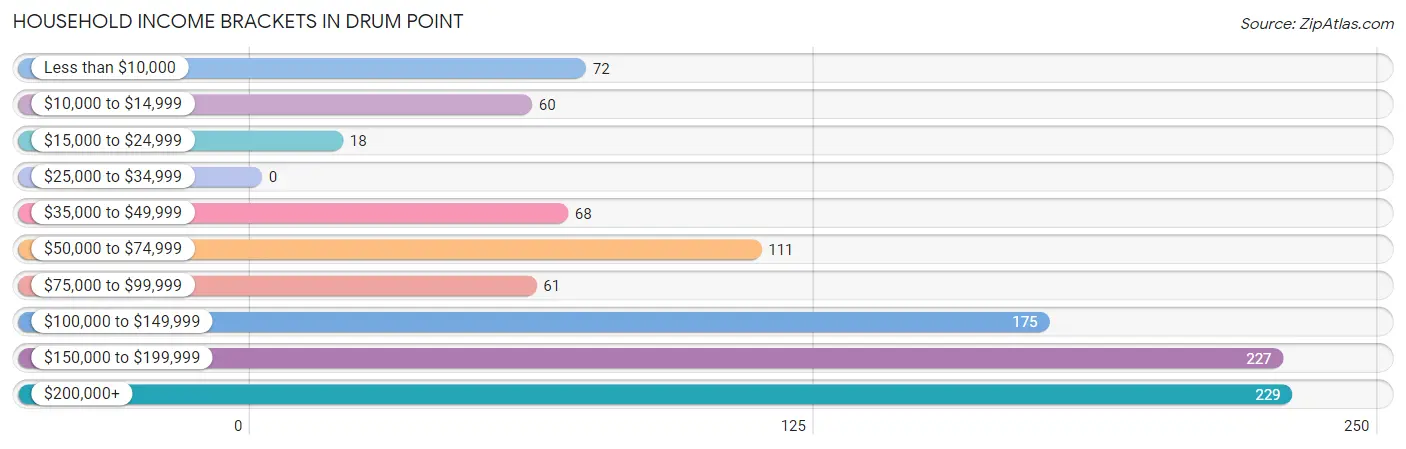
Household Income Brackets in Drum Point
With 229 households falling in the category, the $200,000+ income range is the most frequent in Drum Point, accounting for 22.4% of all households.
| Income Bracket | # Households | % Households |
| Less than $10,000 | 72 | 7.1% |
| $10,000 to $14,999 | 60 | 5.9% |
| $15,000 to $24,999 | 18 | 1.8% |
| $25,000 to $34,999 | 0 | 0.0% |
| $35,000 to $49,999 | 68 | 6.7% |
| $50,000 to $74,999 | 111 | 10.9% |
| $75,000 to $99,999 | 61 | 6.0% |
| $100,000 to $149,999 | 175 | 17.1% |
| $150,000 to $199,999 | 227 | 22.2% |
| $200,000+ | 229 | 22.4% |
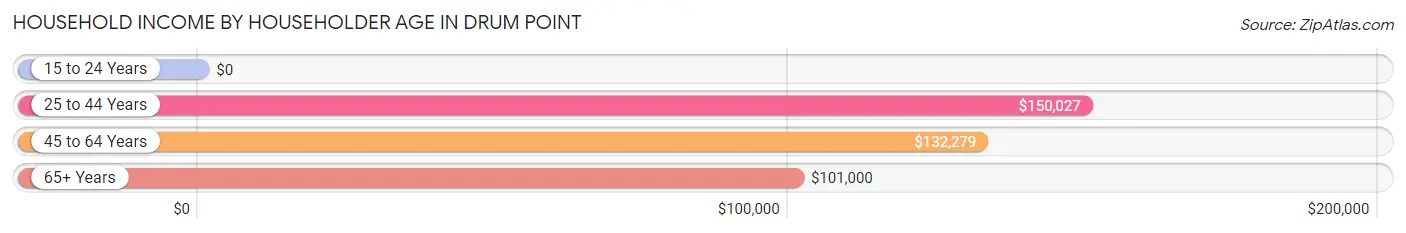
Household Income by Householder Age in Drum Point
The median household income in Drum Point is $135,216, with the highest median household income of $150,027 found in the 25 to 44 years age bracket for the primary householder. A total of 330 households (32.3%) fall into this category.
| Income Bracket | # Households | Median Income |
| 15 to 24 Years | 0 (0.0%) | $0 |
| 25 to 44 Years | 330 (32.3%) | $150,027 |
| 45 to 64 Years | 459 (45.0%) | $132,279 |
| 65+ Years | 232 (22.7%) | $101,000 |
| Total | 1,021 (100.0%) | $135,216 |
Poverty in Drum Point
Income Below Poverty by Sex and Age in Drum Point
With 6.5% poverty level for males and 12.7% for females among the residents of Drum Point, 6 to 11 year old males and 12 to 14 year old females are the most vulnerable to poverty, with 23 males (31.1%) and 50 females (92.6%) in their respective age groups living below the poverty level.
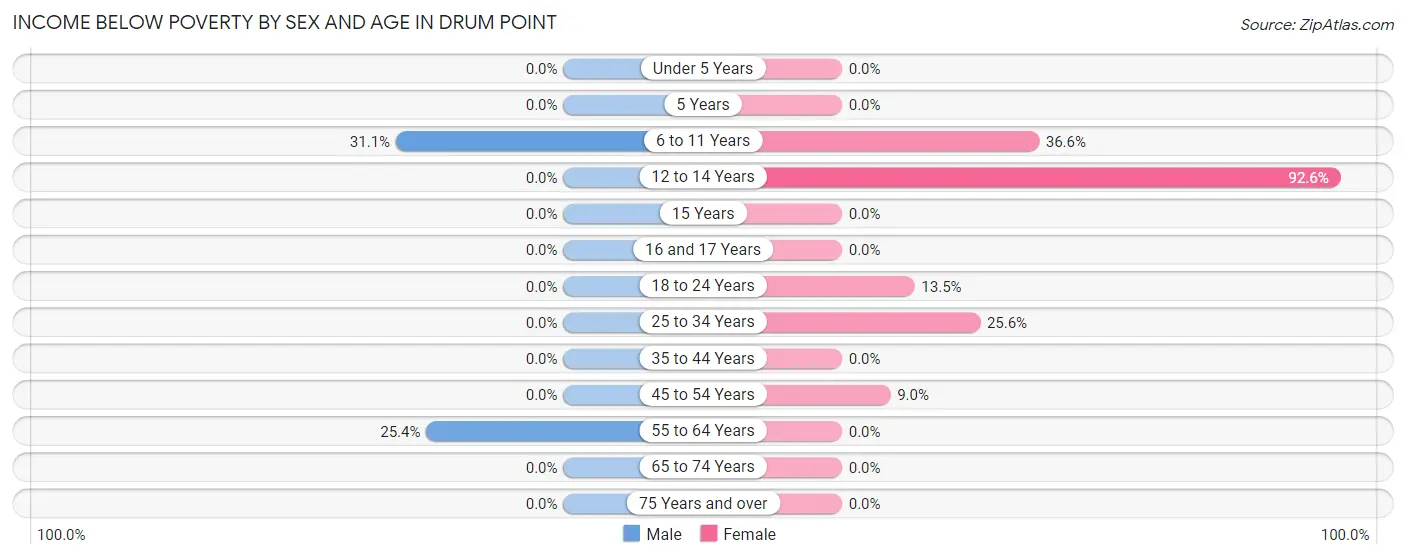
| Age Bracket | Male | Female |
| Under 5 Years | 0 (0.0%) | 0 (0.0%) |
| 5 Years | 0 (0.0%) | 0 (0.0%) |
| 6 to 11 Years | 23 (31.1%) | 49 (36.6%) |
| 12 to 14 Years | 0 (0.0%) | 50 (92.6%) |
| 15 Years | 0 (0.0%) | 0 (0.0%) |
| 16 and 17 Years | 0 (0.0%) | 0 (0.0%) |
| 18 to 24 Years | 0 (0.0%) | 19 (13.5%) |
| 25 to 34 Years | 0 (0.0%) | 60 (25.6%) |
| 35 to 44 Years | 0 (0.0%) | 0 (0.0%) |
| 45 to 54 Years | 0 (0.0%) | 15 (9.0%) |
| 55 to 64 Years | 72 (25.4%) | 0 (0.0%) |
| 65 to 74 Years | 0 (0.0%) | 0 (0.0%) |
| 75 Years and over | 0 (0.0%) | 0 (0.0%) |
| Total | 95 (6.5%) | 193 (12.7%) |
Income Above Poverty by Sex and Age in Drum Point
According to the poverty statistics in Drum Point, males aged under 5 years and females aged under 5 years are the age groups that are most secure financially, with 100.0% of males and 100.0% of females in these age groups living above the poverty line.

| Age Bracket | Male | Female |
| Under 5 Years | 59 (100.0%) | 59 (100.0%) |
| 5 Years | 13 (100.0%) | 0 (0.0%) |
| 6 to 11 Years | 51 (68.9%) | 85 (63.4%) |
| 12 to 14 Years | 37 (100.0%) | 4 (7.4%) |
| 15 Years | 75 (100.0%) | 14 (100.0%) |
| 16 and 17 Years | 11 (100.0%) | 49 (100.0%) |
| 18 to 24 Years | 206 (100.0%) | 122 (86.5%) |
| 25 to 34 Years | 137 (100.0%) | 174 (74.4%) |
| 35 to 44 Years | 168 (100.0%) | 122 (100.0%) |
| 45 to 54 Years | 227 (100.0%) | 152 (91.0%) |
| 55 to 64 Years | 211 (74.6%) | 205 (100.0%) |
| 65 to 74 Years | 104 (100.0%) | 148 (100.0%) |
| 75 Years and over | 64 (100.0%) | 194 (100.0%) |
| Total | 1,363 (93.5%) | 1,328 (87.3%) |
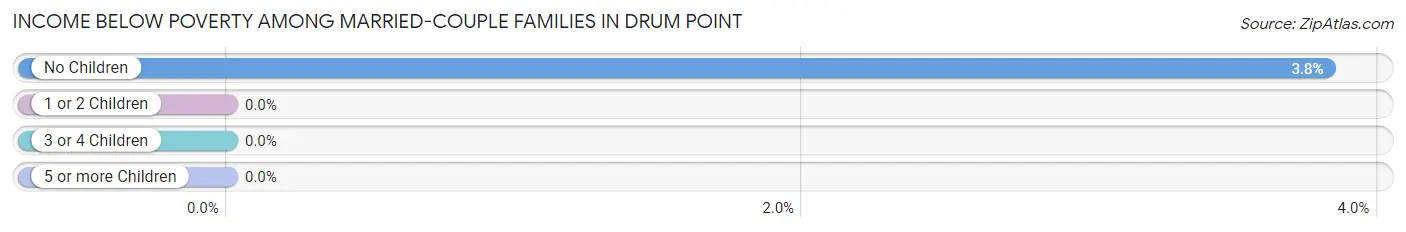
Income Below Poverty Among Married-Couple Families in Drum Point
The poverty statistics for married-couple families in Drum Point show that 2.1% or 15 of the total 719 families live below the poverty line. Families with no children have the highest poverty rate of 3.8%, comprising of 15 families. On the other hand, families with 1 or 2 children have the lowest poverty rate of 0.0%, which includes 0 families.
| Children | Above Poverty | Below Poverty |
| No Children | 378 (96.2%) | 15 (3.8%) |
| 1 or 2 Children | 276 (100.0%) | 0 (0.0%) |
| 3 or 4 Children | 50 (100.0%) | 0 (0.0%) |
| 5 or more Children | 0 (0.0%) | 0 (0.0%) |
| Total | 704 (97.9%) | 15 (2.1%) |
Income Below Poverty Among Single-Parent Households in Drum Point
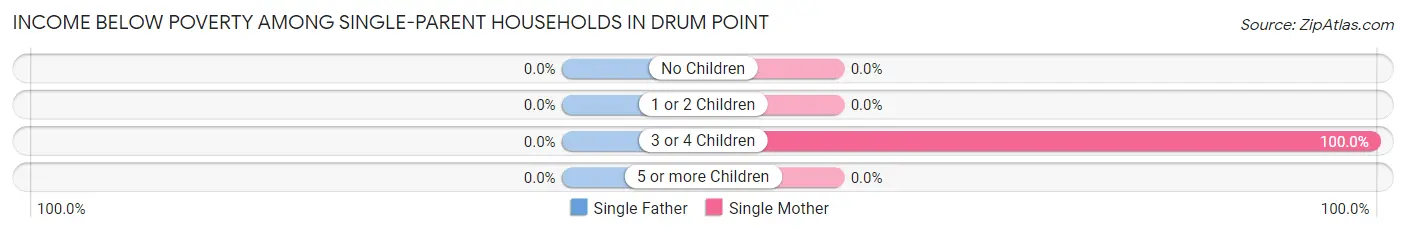
| Children | Single Father | Single Mother |
| No Children | 0 (0.0%) | 0 (0.0%) |
| 1 or 2 Children | 0 (0.0%) | 0 (0.0%) |
| 3 or 4 Children | 0 (0.0%) | 60 (100.0%) |
| 5 or more Children | 0 (0.0%) | 0 (0.0%) |
| Total | 0 (0.0%) | 60 (83.3%) |
Income Below Poverty Among Married-Couple vs Single-Parent Households in Drum Point
The poverty data for Drum Point shows that 15 of the married-couple family households (2.1%) and 60 of the single-parent households (53.6%) are living below the poverty level. Within the married-couple family households, those with no children have the highest poverty rate, with 15 households (3.8%) falling below the poverty line. Among the single-parent households, those with 3 or 4 children have the highest poverty rate, with 60 household (100.0%) living below poverty.
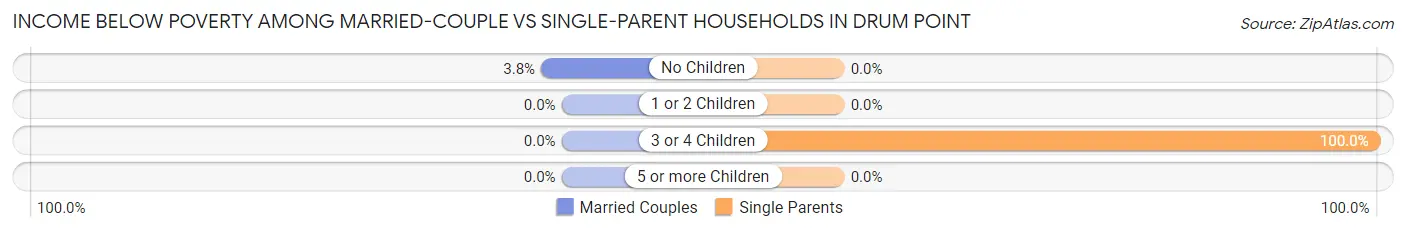
| Children | Married-Couple Families | Single-Parent Households |
| No Children | 15 (3.8%) | 0 (0.0%) |
| 1 or 2 Children | 0 (0.0%) | 0 (0.0%) |
| 3 or 4 Children | 0 (0.0%) | 60 (100.0%) |
| 5 or more Children | 0 (0.0%) | 0 (0.0%) |
| Total | 15 (2.1%) | 60 (53.6%) |
Employment Characteristics in Drum Point
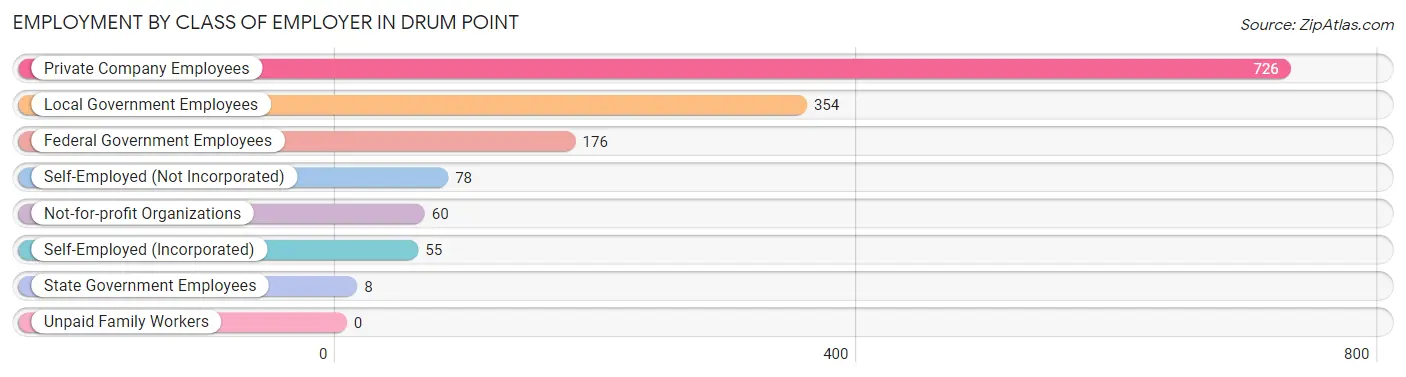
Employment by Class of Employer in Drum Point
Among the 1,457 employed individuals in Drum Point, private company employees (726 | 49.8%), local government employees (354 | 24.3%), and federal government employees (176 | 12.1%) make up the most common classes of employment.
| Employer Class | # Employees | % Employees |
| Private Company Employees | 726 | 49.8% |
| Self-Employed (Incorporated) | 55 | 3.8% |
| Self-Employed (Not Incorporated) | 78 | 5.3% |
| Not-for-profit Organizations | 60 | 4.1% |
| Local Government Employees | 354 | 24.3% |
| State Government Employees | 8 | 0.5% |
| Federal Government Employees | 176 | 12.1% |
| Unpaid Family Workers | 0 | 0.0% |
| Total | 1,457 | 100.0% |
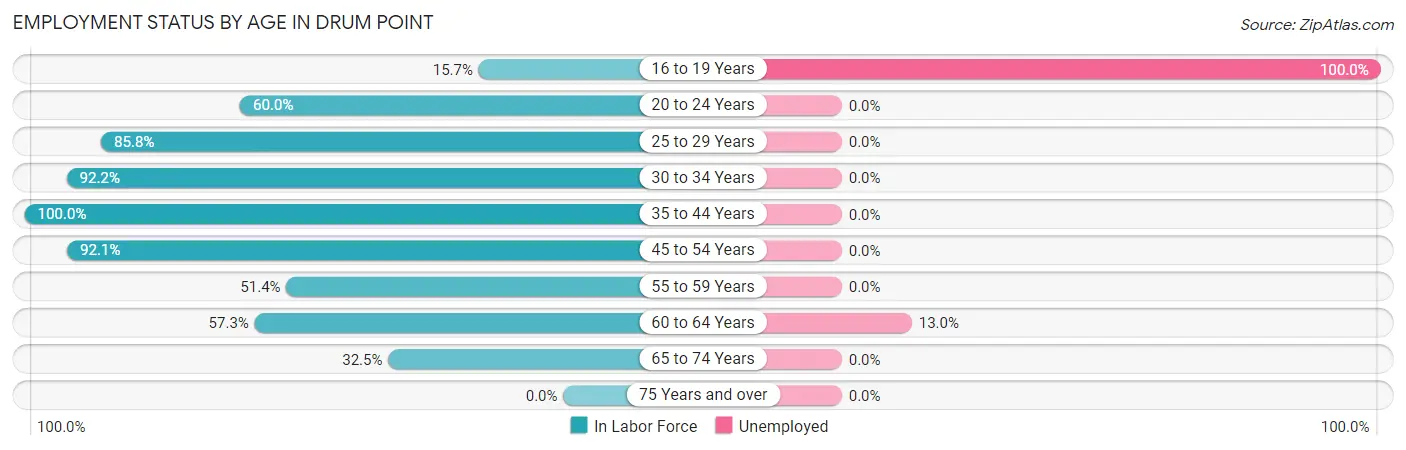
Employment Status by Age in Drum Point
According to the labor force statistics for Drum Point, out of the total population over 16 years of age (2,460), 61.1% or 1,503 individuals are in the labor force, with 3.0% or 45 of them unemployed. The age group with the highest labor force participation rate is 35 to 44 years, with 100.0% or 290 individuals in the labor force. Within the labor force, the 16 to 19 years age range has the highest percentage of unemployed individuals, with 100.0% or 27 of them being unemployed.
| Age Bracket | In Labor Force | Unemployed |
| 16 to 19 Years | 27 (15.7%) | 27 (100.0%) |
| 20 to 24 Years | 141 (60.0%) | 0 (0.0%) |
| 25 to 29 Years | 109 (85.8%) | 0 (0.0%) |
| 30 to 34 Years | 225 (92.2%) | 0 (0.0%) |
| 35 to 44 Years | 290 (100.0%) | 0 (0.0%) |
| 45 to 54 Years | 363 (92.1%) | 0 (0.0%) |
| 55 to 59 Years | 127 (51.4%) | 0 (0.0%) |
| 60 to 64 Years | 138 (57.3%) | 18 (13.0%) |
| 65 to 74 Years | 82 (32.5%) | 0 (0.0%) |
| 75 Years and over | 0 (0.0%) | 0 (0.0%) |
| Total | 1,503 (61.1%) | 45 (3.0%) |
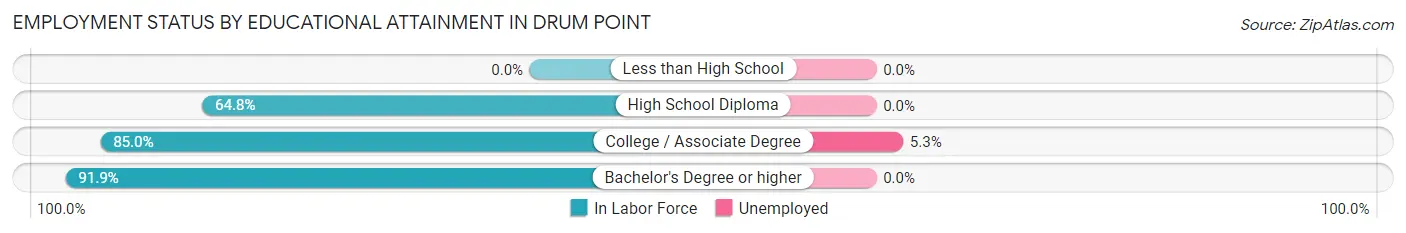
Employment Status by Educational Attainment in Drum Point
According to labor force statistics for Drum Point, 81.1% of individuals (1,251) out of the total population between 25 and 64 years of age (1,543) are in the labor force, with 1.5% or 19 of them being unemployed. The group with the highest labor force participation rate are those with the educational attainment of bachelor's degree or higher, with 91.9% or 567 individuals in the labor force. Within the labor force, individuals with college / associate degree education have the highest percentage of unemployment, with 5.3% or 19 of them being unemployed.
| Educational Attainment | In Labor Force | Unemployed |
| Less than High School | 0 (0.0%) | 0 (0.0%) |
| High School Diploma | 328 (64.8%) | 0 (0.0%) |
| College / Associate Degree | 357 (85.0%) | 22 (5.3%) |
| Bachelor's Degree or higher | 567 (91.9%) | 0 (0.0%) |
| Total | 1,251 (81.1%) | 23 (1.5%) |
Employment Occupations by Sex in Drum Point
Management, Business, Science and Arts Occupations
The most common Management, Business, Science and Arts occupations in Drum Point are Community & Social Service (340 | 23.6%), Education Instruction & Library (307 | 21.3%), Management (200 | 13.9%), Health Diagnosing & Treating (199 | 13.8%), and Computers, Engineering & Science (143 | 9.9%).
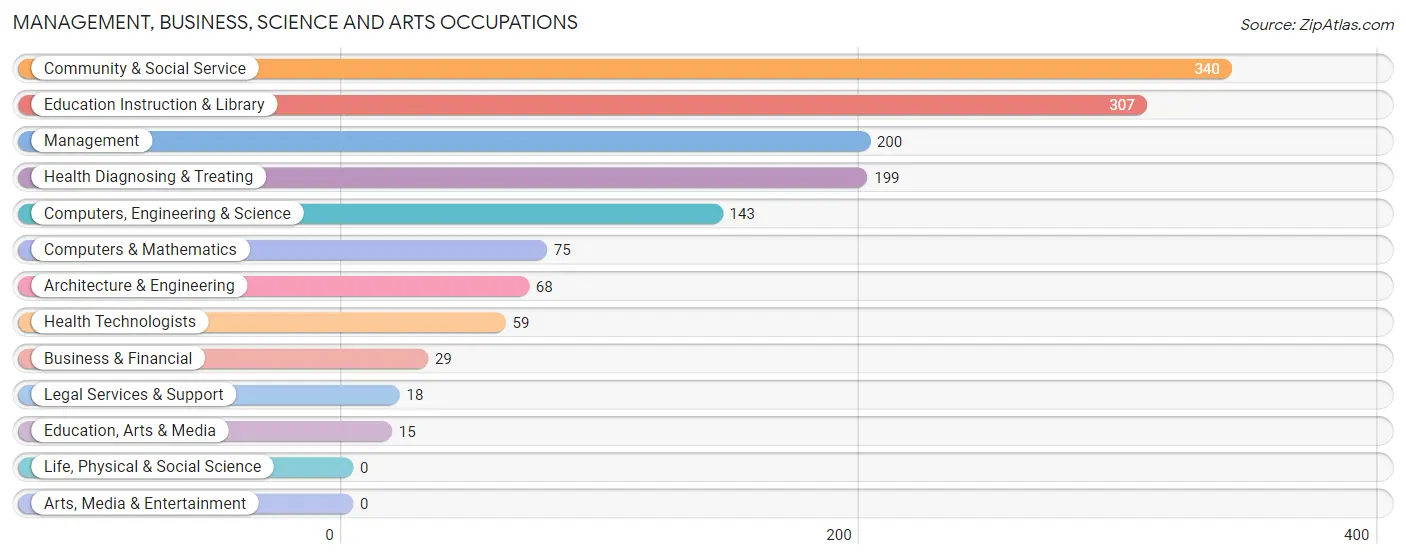
Management, Business, Science and Arts Occupations by Sex
Within the Management, Business, Science and Arts occupations in Drum Point, the most male-oriented occupations are Architecture & Engineering (100.0%), Computers, Engineering & Science (93.0%), and Computers & Mathematics (86.7%), while the most female-oriented occupations are Education, Arts & Media (100.0%), Legal Services & Support (100.0%), and Health Technologists (100.0%).
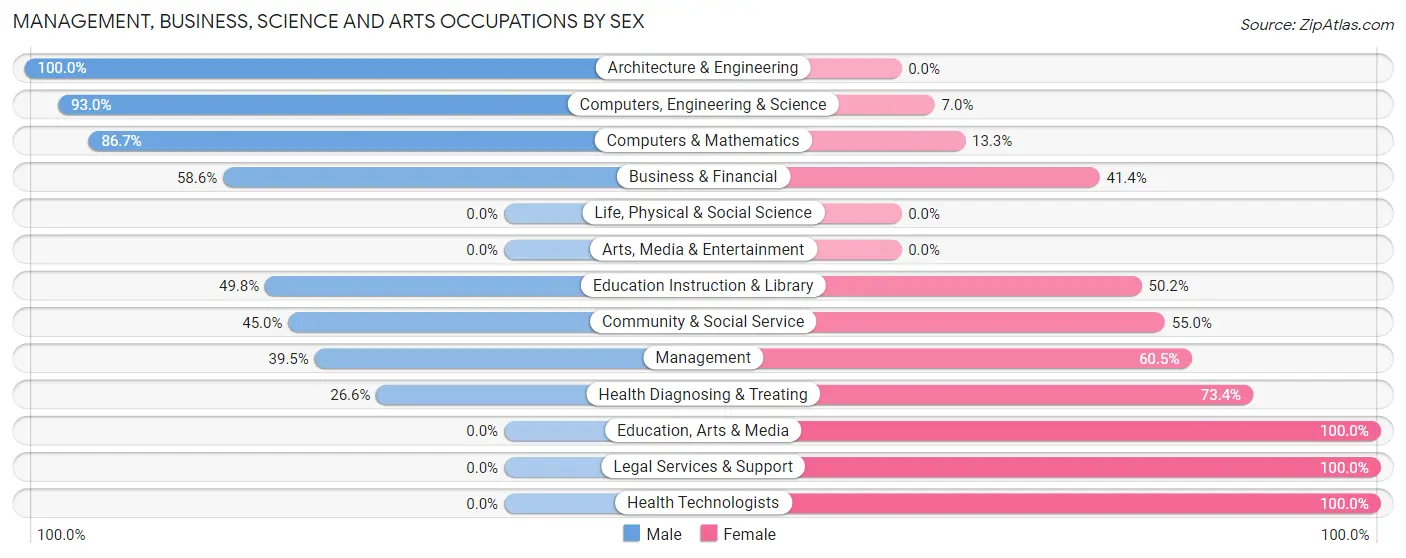
| Occupation | Male | Female |
| Management | 79 (39.5%) | 121 (60.5%) |
| Business & Financial | 17 (58.6%) | 12 (41.4%) |
| Computers, Engineering & Science | 133 (93.0%) | 10 (7.0%) |
| Computers & Mathematics | 65 (86.7%) | 10 (13.3%) |
| Architecture & Engineering | 68 (100.0%) | 0 (0.0%) |
| Life, Physical & Social Science | 0 (0.0%) | 0 (0.0%) |
| Community & Social Service | 153 (45.0%) | 187 (55.0%) |
| Education, Arts & Media | 0 (0.0%) | 15 (100.0%) |
| Legal Services & Support | 0 (0.0%) | 18 (100.0%) |
| Education Instruction & Library | 153 (49.8%) | 154 (50.2%) |
| Arts, Media & Entertainment | 0 (0.0%) | 0 (0.0%) |
| Health Diagnosing & Treating | 53 (26.6%) | 146 (73.4%) |
| Health Technologists | 0 (0.0%) | 59 (100.0%) |
| Total (Category) | 435 (47.7%) | 476 (52.2%) |
| Total (Overall) | 747 (51.8%) | 695 (48.2%) |
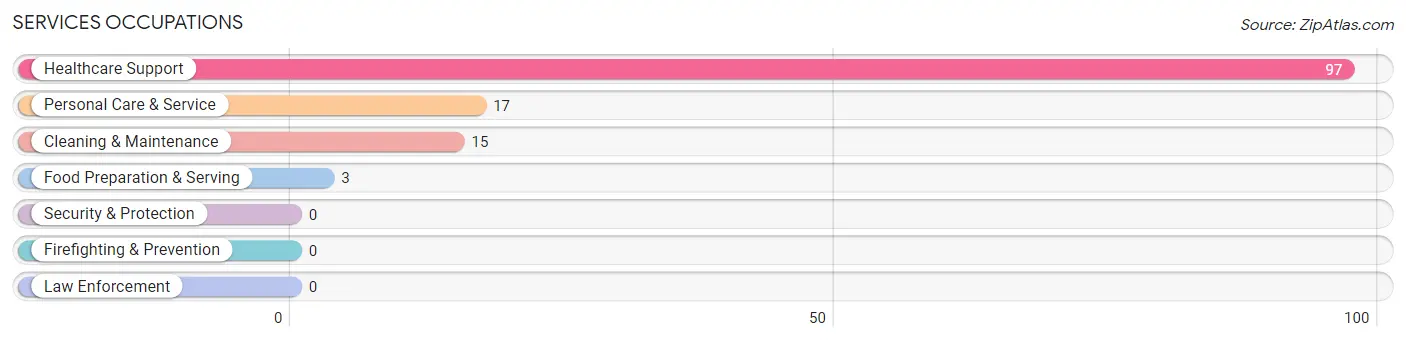
Services Occupations
The most common Services occupations in Drum Point are Healthcare Support (97 | 6.7%), Personal Care & Service (17 | 1.2%), Cleaning & Maintenance (15 | 1.0%), and Food Preparation & Serving (3 | 0.2%).
Services Occupations by Sex
Within the Services occupations in Drum Point, the most male-oriented occupations are Cleaning & Maintenance (100.0%), and Personal Care & Service (100.0%), while the most female-oriented occupations are Healthcare Support (100.0%), and Food Preparation & Serving (100.0%).
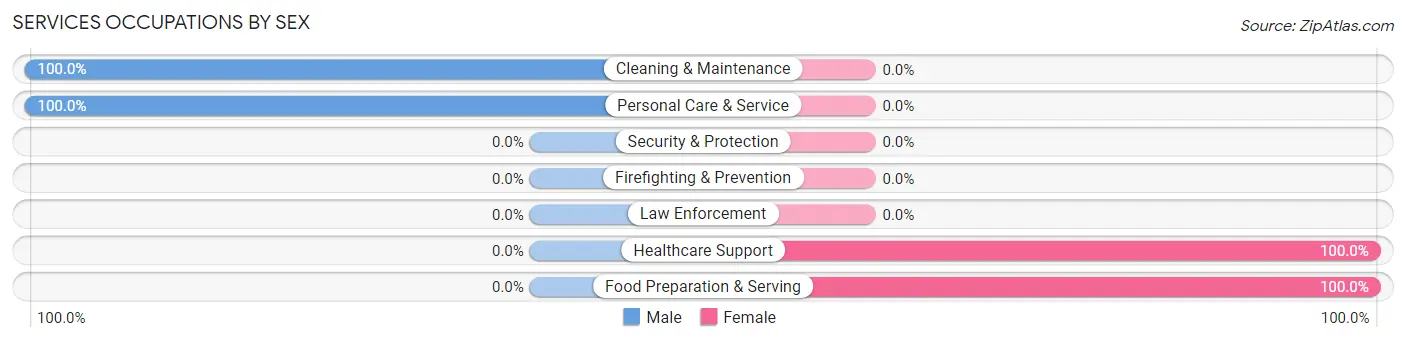
| Occupation | Male | Female |
| Healthcare Support | 0 (0.0%) | 97 (100.0%) |
| Security & Protection | 0 (0.0%) | 0 (0.0%) |
| Firefighting & Prevention | 0 (0.0%) | 0 (0.0%) |
| Law Enforcement | 0 (0.0%) | 0 (0.0%) |
| Food Preparation & Serving | 0 (0.0%) | 3 (100.0%) |
| Cleaning & Maintenance | 15 (100.0%) | 0 (0.0%) |
| Personal Care & Service | 17 (100.0%) | 0 (0.0%) |
| Total (Category) | 32 (24.2%) | 100 (75.8%) |
| Total (Overall) | 747 (51.8%) | 695 (48.2%) |
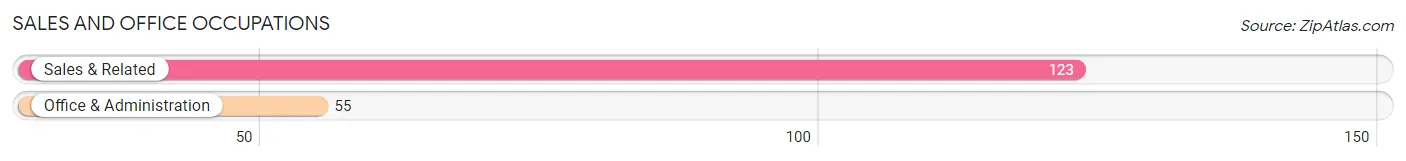
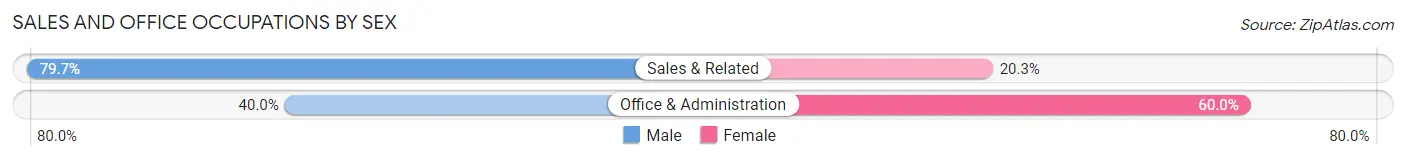
Sales and Office Occupations
The most common Sales and Office occupations in Drum Point are Sales & Related (123 | 8.5%), and Office & Administration (55 | 3.8%).
Sales and Office Occupations by Sex
| Occupation | Male | Female |
| Sales & Related | 98 (79.7%) | 25 (20.3%) |
| Office & Administration | 22 (40.0%) | 33 (60.0%) |
| Total (Category) | 120 (67.4%) | 58 (32.6%) |
| Total (Overall) | 747 (51.8%) | 695 (48.2%) |
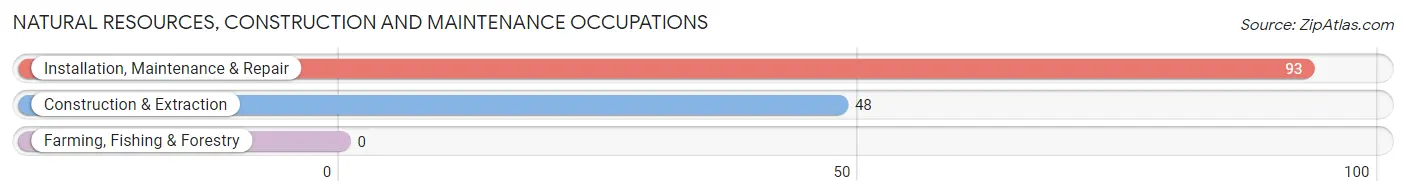
Natural Resources, Construction and Maintenance Occupations
The most common Natural Resources, Construction and Maintenance occupations in Drum Point are Installation, Maintenance & Repair (93 | 6.5%), and Construction & Extraction (48 | 3.3%).
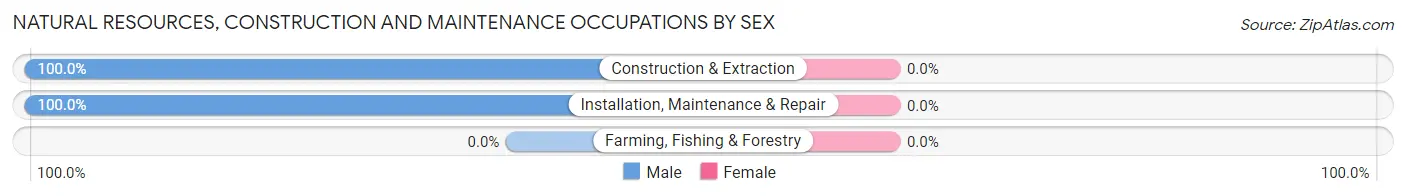
Natural Resources, Construction and Maintenance Occupations by Sex
| Occupation | Male | Female |
| Farming, Fishing & Forestry | 0 (0.0%) | 0 (0.0%) |
| Construction & Extraction | 48 (100.0%) | 0 (0.0%) |
| Installation, Maintenance & Repair | 93 (100.0%) | 0 (0.0%) |
| Total (Category) | 141 (100.0%) | 0 (0.0%) |
| Total (Overall) | 747 (51.8%) | 695 (48.2%) |
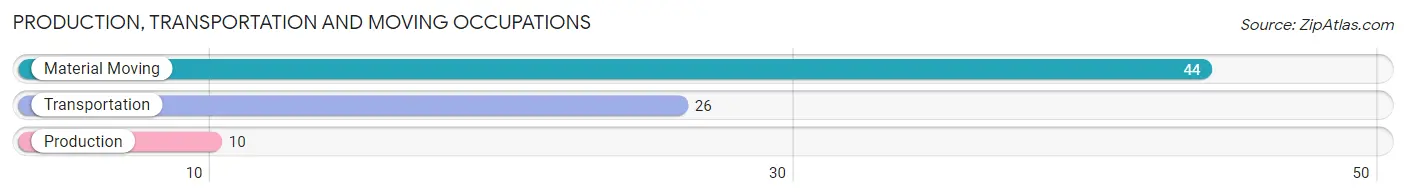
Production, Transportation and Moving Occupations
The most common Production, Transportation and Moving occupations in Drum Point are Material Moving (44 | 3.0%), Transportation (26 | 1.8%), and Production (10 | 0.7%).
Production, Transportation and Moving Occupations by Sex
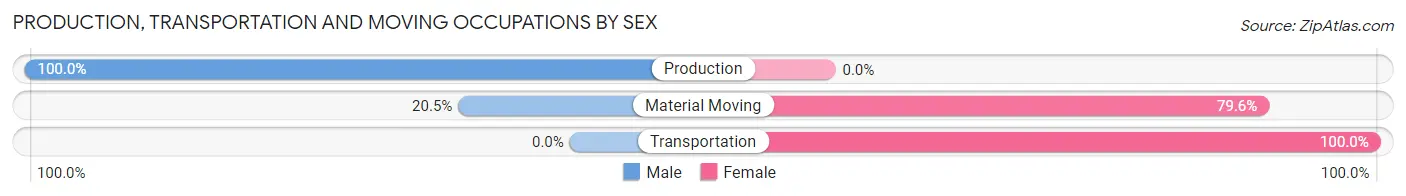
| Occupation | Male | Female |
| Production | 10 (100.0%) | 0 (0.0%) |
| Transportation | 0 (0.0%) | 26 (100.0%) |
| Material Moving | 9 (20.4%) | 35 (79.5%) |
| Total (Category) | 19 (23.7%) | 61 (76.2%) |
| Total (Overall) | 747 (51.8%) | 695 (48.2%) |
Employment Industries by Sex in Drum Point
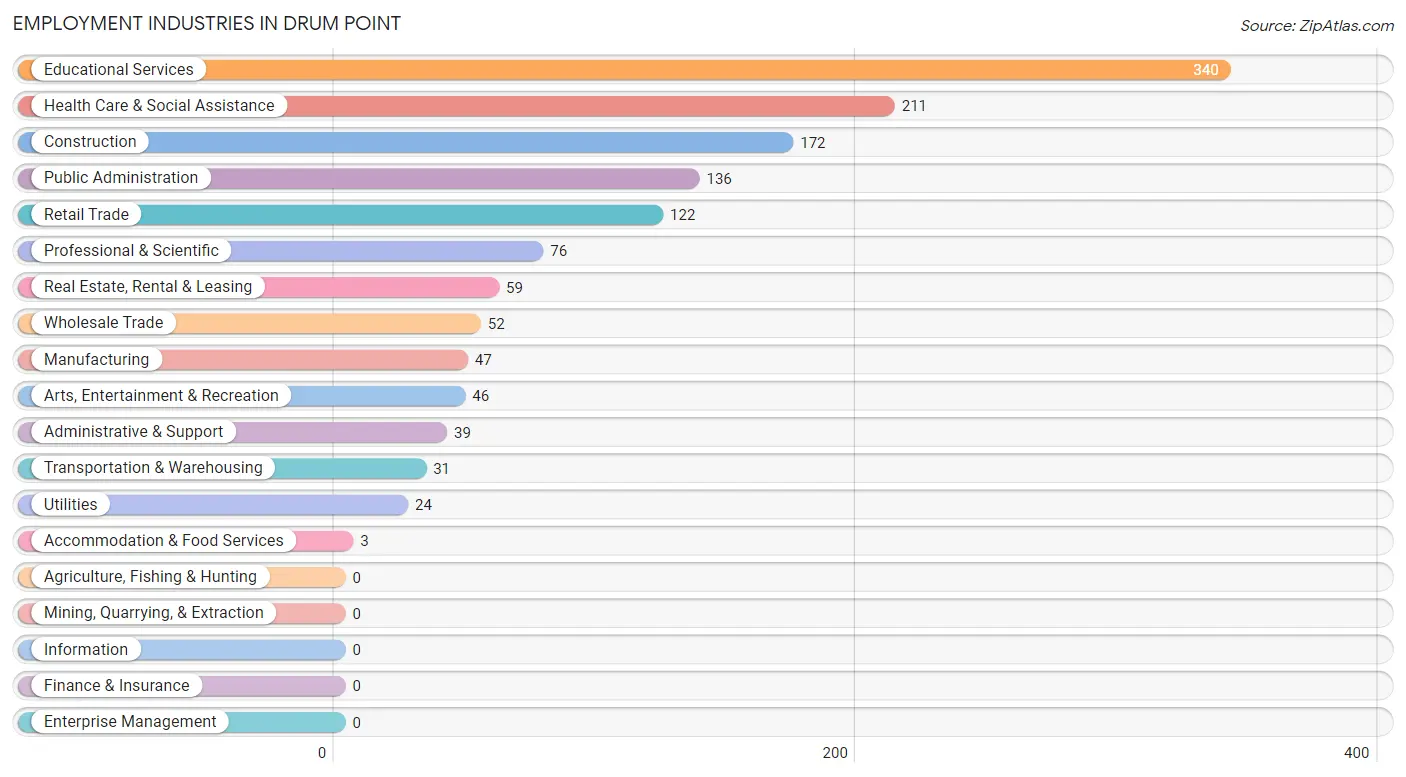
Employment Industries in Drum Point
The major employment industries in Drum Point include Educational Services (340 | 23.6%), Health Care & Social Assistance (211 | 14.6%), Construction (172 | 11.9%), Public Administration (136 | 9.4%), and Retail Trade (122 | 8.5%).
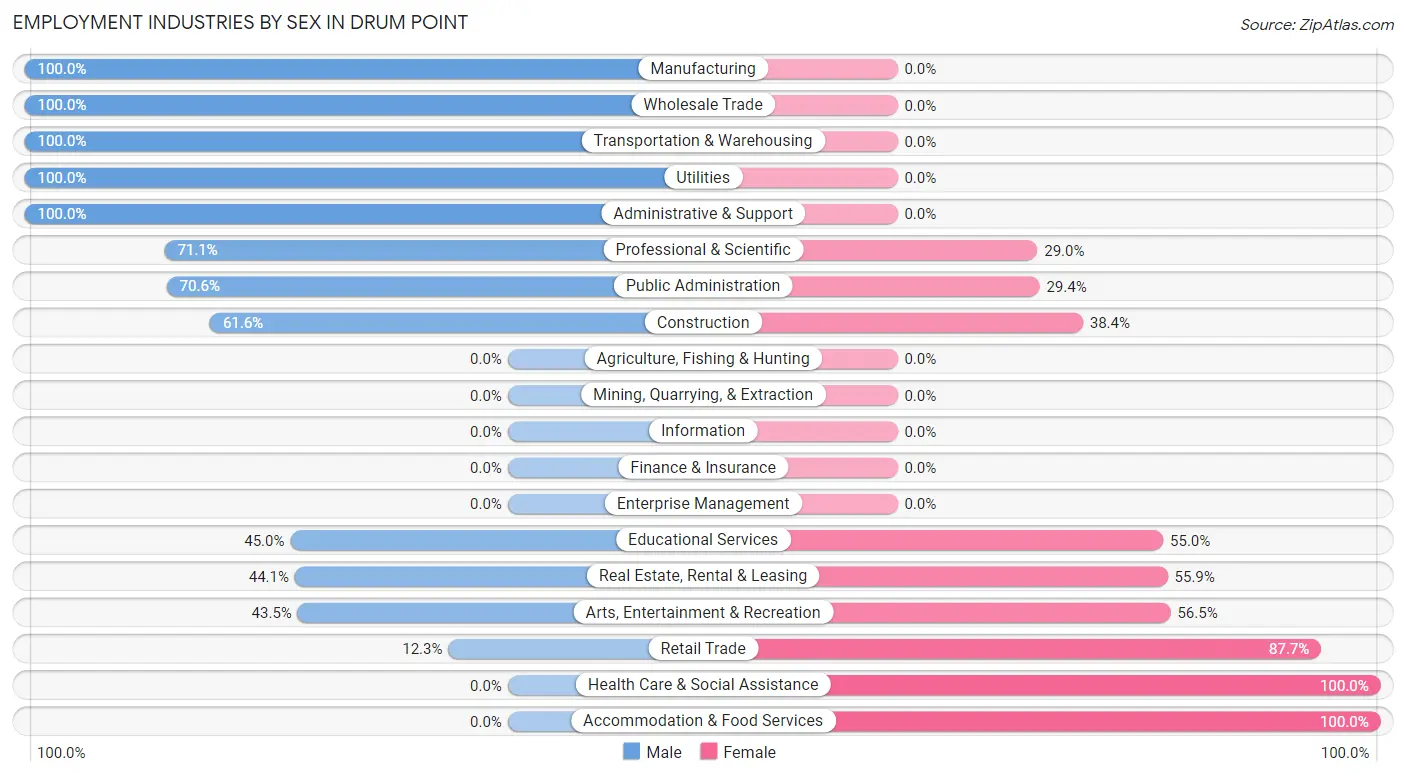
Employment Industries by Sex in Drum Point
The Drum Point industries that see more men than women are Manufacturing (100.0%), Wholesale Trade (100.0%), and Transportation & Warehousing (100.0%), whereas the industries that tend to have a higher number of women are Health Care & Social Assistance (100.0%), Accommodation & Food Services (100.0%), and Retail Trade (87.7%).
| Industry | Male | Female |
| Agriculture, Fishing & Hunting | 0 (0.0%) | 0 (0.0%) |
| Mining, Quarrying, & Extraction | 0 (0.0%) | 0 (0.0%) |
| Construction | 106 (61.6%) | 66 (38.4%) |
| Manufacturing | 47 (100.0%) | 0 (0.0%) |
| Wholesale Trade | 52 (100.0%) | 0 (0.0%) |
| Retail Trade | 15 (12.3%) | 107 (87.7%) |
| Transportation & Warehousing | 31 (100.0%) | 0 (0.0%) |
| Utilities | 24 (100.0%) | 0 (0.0%) |
| Information | 0 (0.0%) | 0 (0.0%) |
| Finance & Insurance | 0 (0.0%) | 0 (0.0%) |
| Real Estate, Rental & Leasing | 26 (44.1%) | 33 (55.9%) |
| Professional & Scientific | 54 (71.1%) | 22 (28.9%) |
| Enterprise Management | 0 (0.0%) | 0 (0.0%) |
| Administrative & Support | 39 (100.0%) | 0 (0.0%) |
| Educational Services | 153 (45.0%) | 187 (55.0%) |
| Health Care & Social Assistance | 0 (0.0%) | 211 (100.0%) |
| Arts, Entertainment & Recreation | 20 (43.5%) | 26 (56.5%) |
| Accommodation & Food Services | 0 (0.0%) | 3 (100.0%) |
| Public Administration | 96 (70.6%) | 40 (29.4%) |
| Total | 747 (51.8%) | 695 (48.2%) |
Education in Drum Point
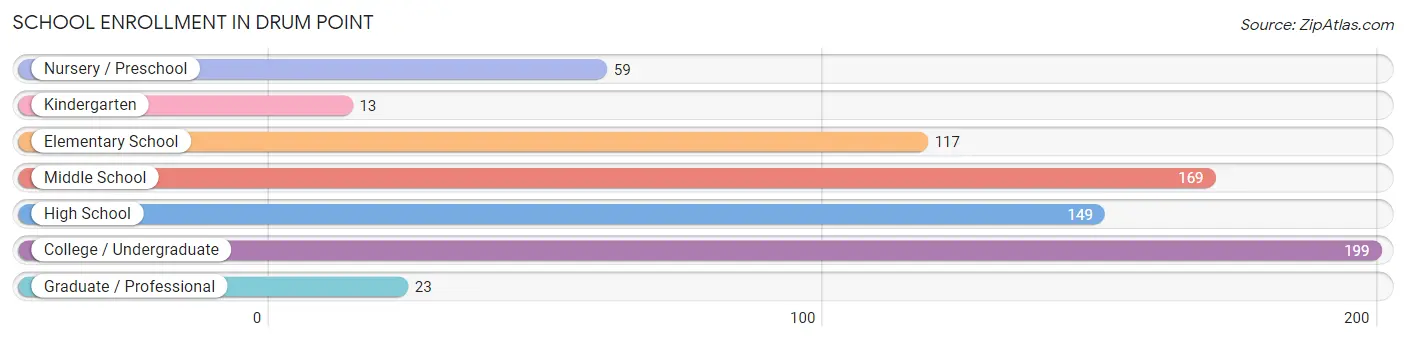
School Enrollment in Drum Point
The most common levels of schooling among the 729 students in Drum Point are college / undergraduate (199 | 27.3%), middle school (169 | 23.2%), and high school (149 | 20.4%).
| School Level | # Students | % Students |
| Nursery / Preschool | 59 | 8.1% |
| Kindergarten | 13 | 1.8% |
| Elementary School | 117 | 16.1% |
| Middle School | 169 | 23.2% |
| High School | 149 | 20.4% |
| College / Undergraduate | 199 | 27.3% |
| Graduate / Professional | 23 | 3.2% |
| Total | 729 | 100.0% |
School Enrollment by Age by Funding Source in Drum Point
Out of a total of 729 students who are enrolled in schools in Drum Point, 153 (21.0%) attend a private institution, while the remaining 576 (79.0%) are enrolled in public schools. The age group of 3 to 4 year olds has the highest likelihood of being enrolled in private schools, with 59 (100.0% in the age bracket) enrolled. Conversely, the age group of 18 to 19 year olds has the lowest likelihood of being enrolled in a private school, with 85 (100.0% in the age bracket) attending a public institution.
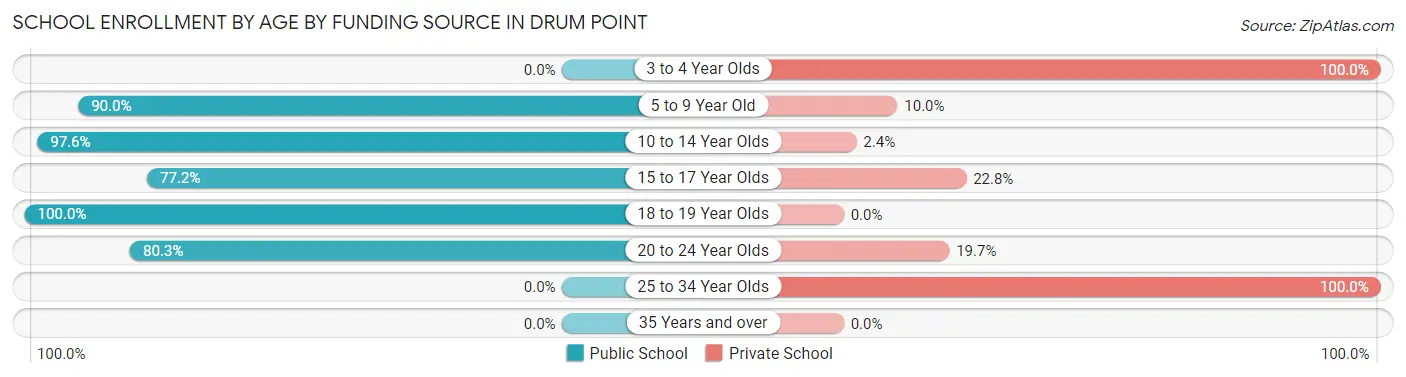
| Age Bracket | Public School | Private School |
| 3 to 4 Year Olds | 0 (0.0%) | 59 (100.0%) |
| 5 to 9 Year Old | 117 (90.0%) | 13 (10.0%) |
| 10 to 14 Year Olds | 165 (97.6%) | 4 (2.4%) |
| 15 to 17 Year Olds | 115 (77.2%) | 34 (22.8%) |
| 18 to 19 Year Olds | 85 (100.0%) | 0 (0.0%) |
| 20 to 24 Year Olds | 94 (80.3%) | 23 (19.7%) |
| 25 to 34 Year Olds | 0 (0.0%) | 20 (100.0%) |
| 35 Years and over | 0 (0.0%) | 0 (0.0%) |
| Total | 576 (79.0%) | 153 (21.0%) |
Educational Attainment by Field of Study in Drum Point
Education (209 | 24.2%), business (132 | 15.3%), computers & mathematics (120 | 13.9%), engineering (100 | 11.6%), and literature & languages (87 | 10.1%) are the most common fields of study among 865 individuals in Drum Point who have obtained a bachelor's degree or higher.
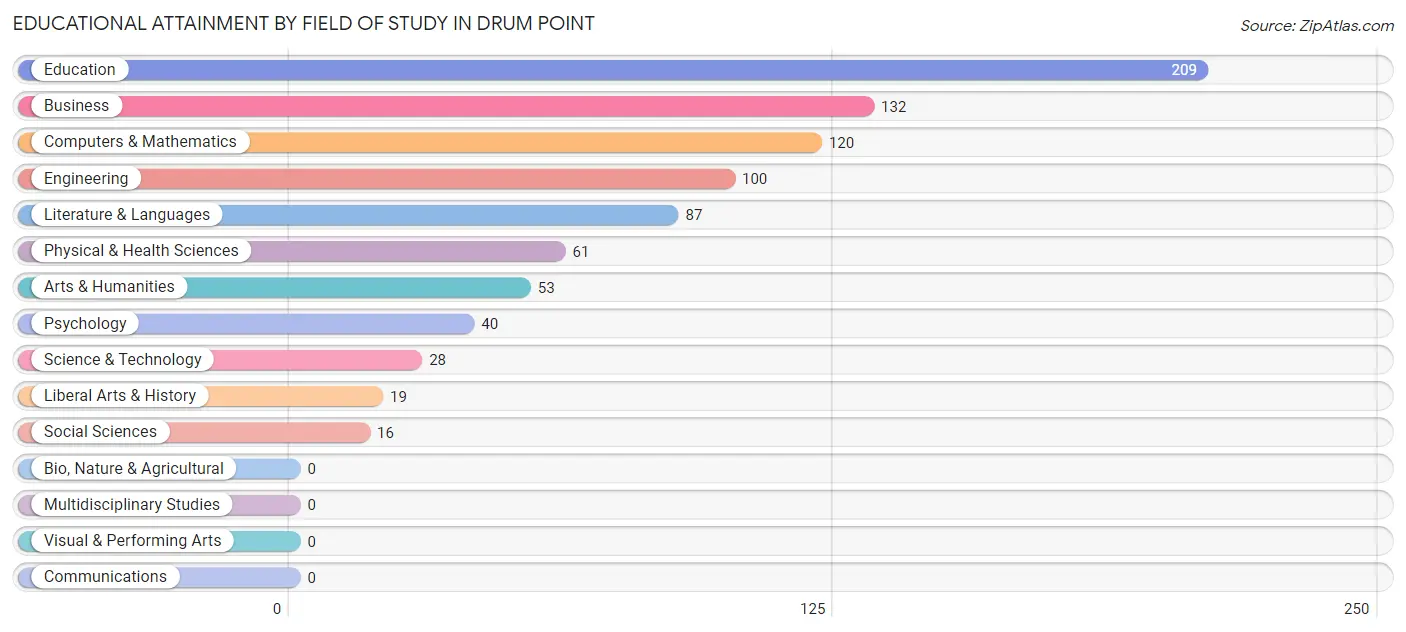
| Field of Study | # Graduates | % Graduates |
| Computers & Mathematics | 120 | 13.9% |
| Bio, Nature & Agricultural | 0 | 0.0% |
| Physical & Health Sciences | 61 | 7.0% |
| Psychology | 40 | 4.6% |
| Social Sciences | 16 | 1.8% |
| Engineering | 100 | 11.6% |
| Multidisciplinary Studies | 0 | 0.0% |
| Science & Technology | 28 | 3.2% |
| Business | 132 | 15.3% |
| Education | 209 | 24.2% |
| Literature & Languages | 87 | 10.1% |
| Liberal Arts & History | 19 | 2.2% |
| Visual & Performing Arts | 0 | 0.0% |
| Communications | 0 | 0.0% |
| Arts & Humanities | 53 | 6.1% |
| Total | 865 | 100.0% |
Transportation & Commute in Drum Point
Vehicle Availability by Sex in Drum Point
The most prevalent vehicle ownership categories in Drum Point are males with 2 vehicles (306, accounting for 40.2%) and females with 2 vehicles (213, making up 44.0%).
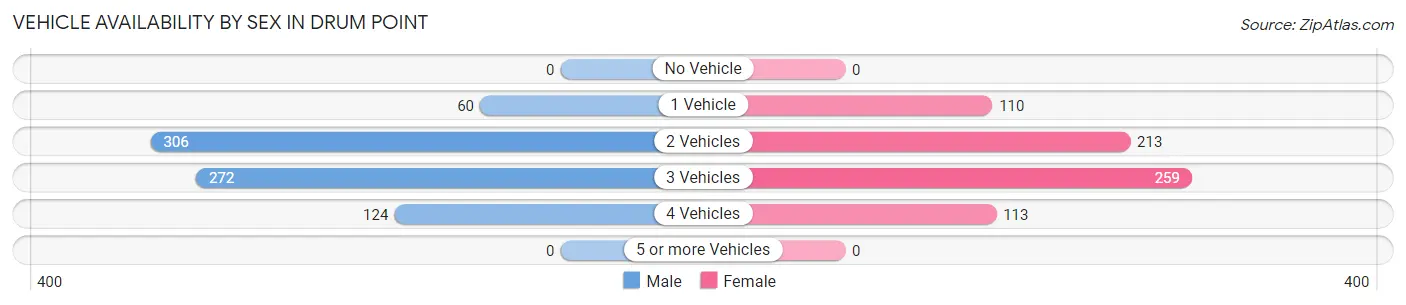
| Vehicles Available | Male | Female |
| No Vehicle | 0 (0.0%) | 0 (0.0%) |
| 1 Vehicle | 60 (7.9%) | 110 (15.8%) |
| 2 Vehicles | 306 (40.2%) | 213 (30.6%) |
| 3 Vehicles | 272 (35.7%) | 259 (37.3%) |
| 4 Vehicles | 124 (16.3%) | 113 (16.3%) |
| 5 or more Vehicles | 0 (0.0%) | 0 (0.0%) |
| Total | 762 (100.0%) | 695 (100.0%) |
Commute Time in Drum Point
The most frequently occuring commute durations in Drum Point are 90 or more minutes (204 commuters, 17.7%), 10 to 14 minutes (177 commuters, 15.4%), and 20 to 24 minutes (167 commuters, 14.5%).
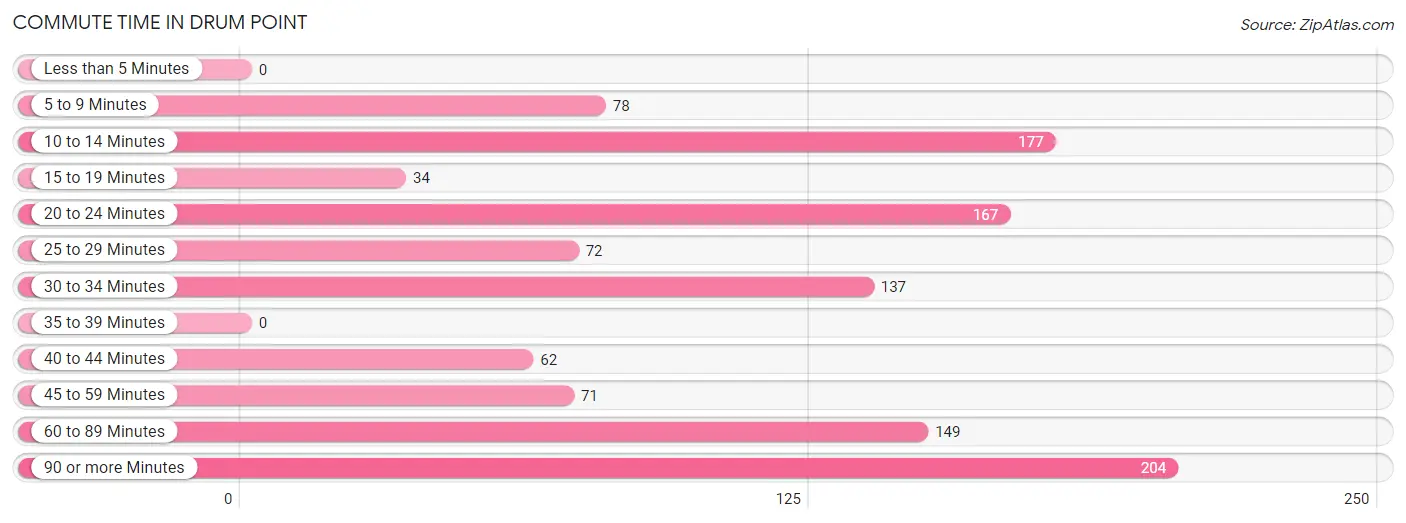
| Commute Time | # Commuters | % Commuters |
| Less than 5 Minutes | 0 | 0.0% |
| 5 to 9 Minutes | 78 | 6.8% |
| 10 to 14 Minutes | 177 | 15.4% |
| 15 to 19 Minutes | 34 | 2.9% |
| 20 to 24 Minutes | 167 | 14.5% |
| 25 to 29 Minutes | 72 | 6.3% |
| 30 to 34 Minutes | 137 | 11.9% |
| 35 to 39 Minutes | 0 | 0.0% |
| 40 to 44 Minutes | 62 | 5.4% |
| 45 to 59 Minutes | 71 | 6.2% |
| 60 to 89 Minutes | 149 | 13.0% |
| 90 or more Minutes | 204 | 17.7% |
Commute Time by Sex in Drum Point
The most common commute times in Drum Point are 90 or more minutes (189 commuters, 31.0%) for males and 10 to 14 minutes (106 commuters, 19.6%) for females.
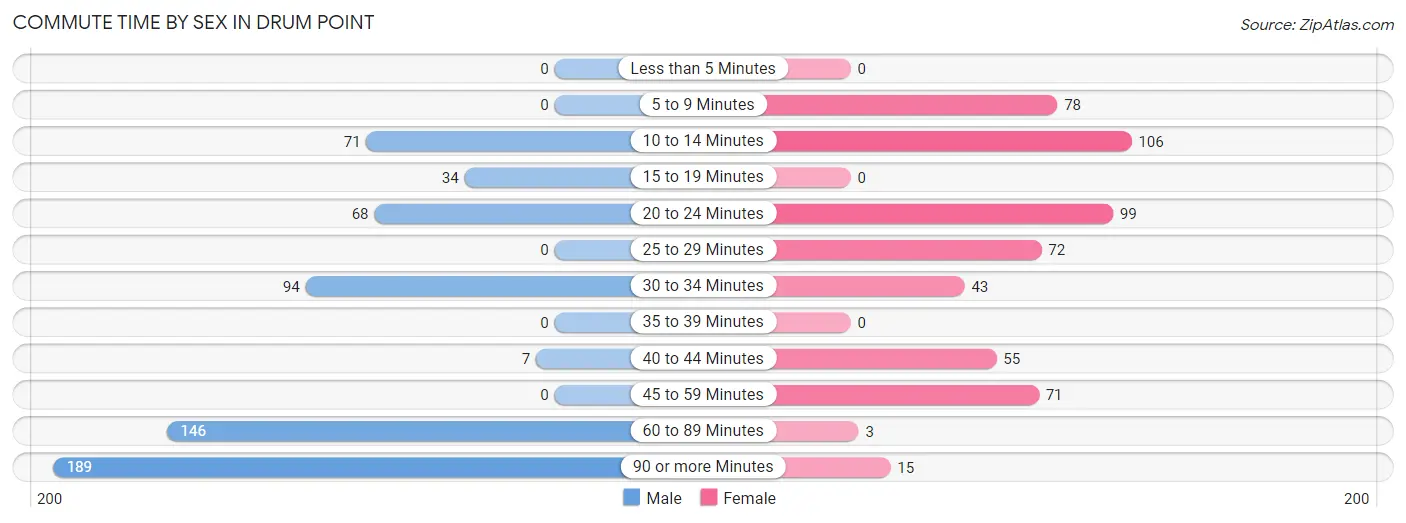
| Commute Time | Male | Female |
| Less than 5 Minutes | 0 (0.0%) | 0 (0.0%) |
| 5 to 9 Minutes | 0 (0.0%) | 78 (14.4%) |
| 10 to 14 Minutes | 71 (11.7%) | 106 (19.6%) |
| 15 to 19 Minutes | 34 (5.6%) | 0 (0.0%) |
| 20 to 24 Minutes | 68 (11.2%) | 99 (18.3%) |
| 25 to 29 Minutes | 0 (0.0%) | 72 (13.3%) |
| 30 to 34 Minutes | 94 (15.4%) | 43 (7.9%) |
| 35 to 39 Minutes | 0 (0.0%) | 0 (0.0%) |
| 40 to 44 Minutes | 7 (1.1%) | 55 (10.2%) |
| 45 to 59 Minutes | 0 (0.0%) | 71 (13.1%) |
| 60 to 89 Minutes | 146 (24.0%) | 3 (0.5%) |
| 90 or more Minutes | 189 (31.0%) | 15 (2.8%) |
Time of Departure to Work by Sex in Drum Point
The most frequent times of departure to work in Drum Point are 12:00 AM to 4:59 AM (171, 28.1%) for males and 7:00 AM to 7:29 AM (119, 22.0%) for females.
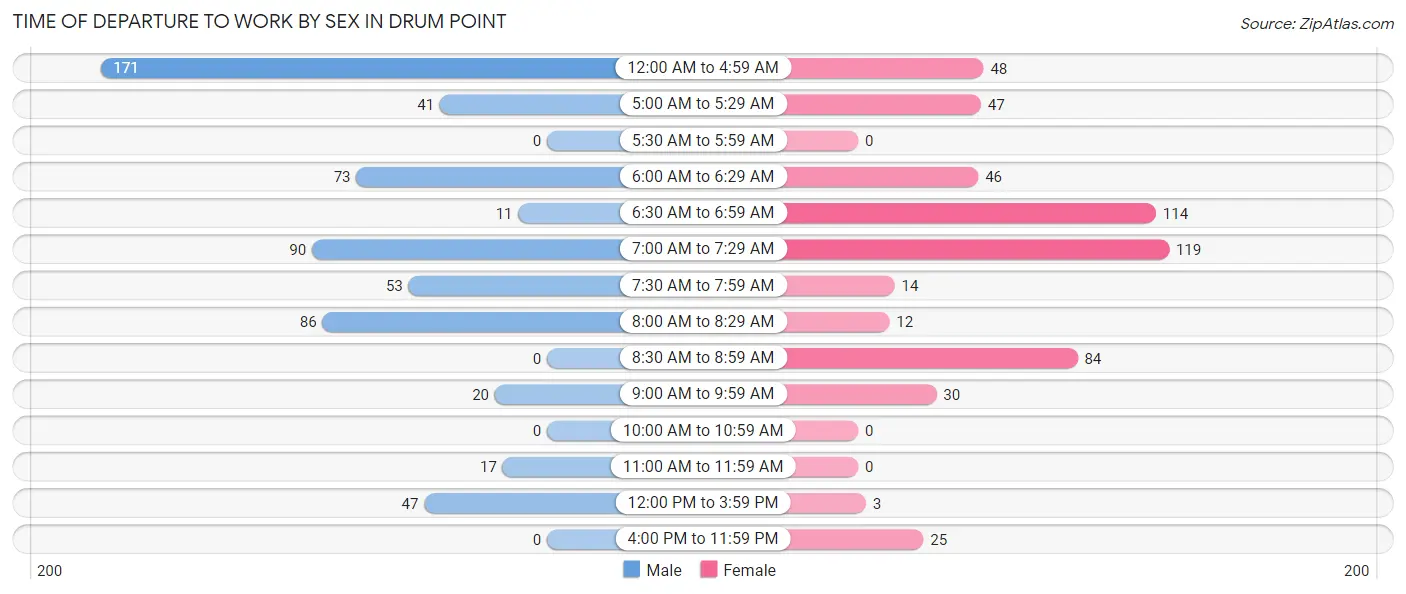
| Time of Departure | Male | Female |
| 12:00 AM to 4:59 AM | 171 (28.1%) | 48 (8.9%) |
| 5:00 AM to 5:29 AM | 41 (6.7%) | 47 (8.7%) |
| 5:30 AM to 5:59 AM | 0 (0.0%) | 0 (0.0%) |
| 6:00 AM to 6:29 AM | 73 (12.0%) | 46 (8.5%) |
| 6:30 AM to 6:59 AM | 11 (1.8%) | 114 (21.0%) |
| 7:00 AM to 7:29 AM | 90 (14.8%) | 119 (22.0%) |
| 7:30 AM to 7:59 AM | 53 (8.7%) | 14 (2.6%) |
| 8:00 AM to 8:29 AM | 86 (14.1%) | 12 (2.2%) |
| 8:30 AM to 8:59 AM | 0 (0.0%) | 84 (15.5%) |
| 9:00 AM to 9:59 AM | 20 (3.3%) | 30 (5.5%) |
| 10:00 AM to 10:59 AM | 0 (0.0%) | 0 (0.0%) |
| 11:00 AM to 11:59 AM | 17 (2.8%) | 0 (0.0%) |
| 12:00 PM to 3:59 PM | 47 (7.7%) | 3 (0.5%) |
| 4:00 PM to 11:59 PM | 0 (0.0%) | 25 (4.6%) |
| Total | 609 (100.0%) | 542 (100.0%) |
Housing Occupancy in Drum Point
Occupancy by Ownership in Drum Point
Of the total 1,021 dwellings in Drum Point, owner-occupied units account for 937 (91.8%), while renter-occupied units make up 84 (8.2%).
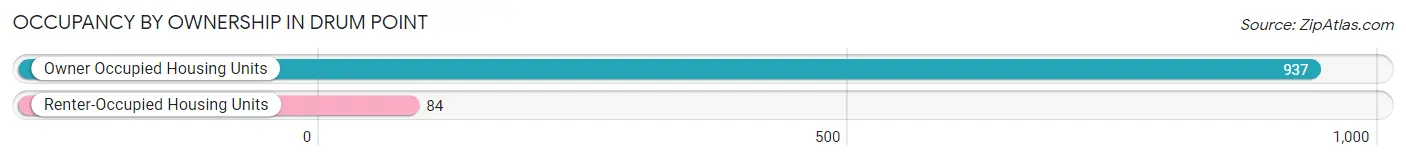
| Occupancy | # Housing Units | % Housing Units |
| Owner Occupied Housing Units | 937 | 91.8% |
| Renter-Occupied Housing Units | 84 | 8.2% |
| Total Occupied Housing Units | 1,021 | 100.0% |
Occupancy by Household Size in Drum Point
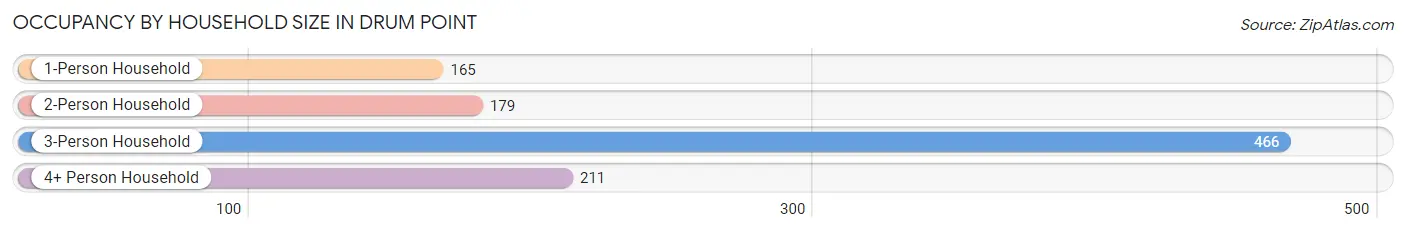
| Household Size | # Housing Units | % Housing Units |
| 1-Person Household | 165 | 16.2% |
| 2-Person Household | 179 | 17.5% |
| 3-Person Household | 466 | 45.6% |
| 4+ Person Household | 211 | 20.7% |
| Total Housing Units | 1,021 | 100.0% |
Occupancy by Ownership by Household Size in Drum Point
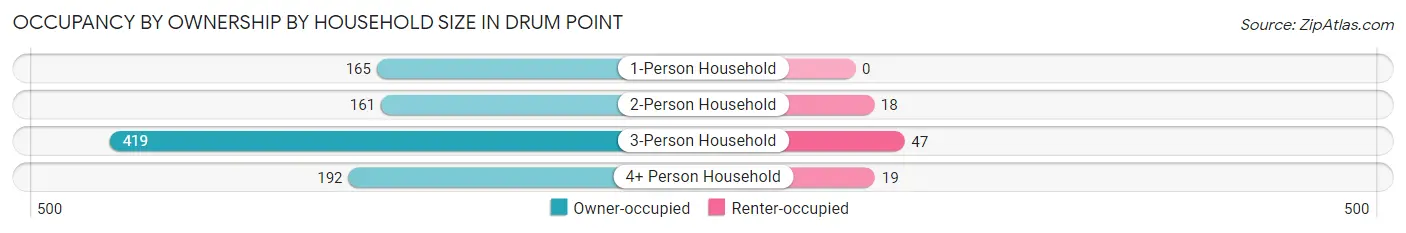
| Household Size | Owner-occupied | Renter-occupied |
| 1-Person Household | 165 (100.0%) | 0 (0.0%) |
| 2-Person Household | 161 (89.9%) | 18 (10.1%) |
| 3-Person Household | 419 (89.9%) | 47 (10.1%) |
| 4+ Person Household | 192 (91.0%) | 19 (9.0%) |
| Total Housing Units | 937 (91.8%) | 84 (8.2%) |
Occupancy by Educational Attainment in Drum Point
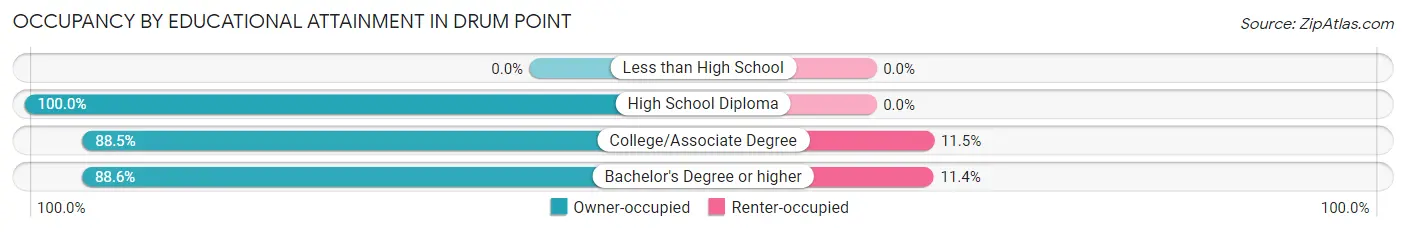
| Household Size | Owner-occupied | Renter-occupied |
| Less than High School | 0 (0.0%) | 0 (0.0%) |
| High School Diploma | 285 (100.0%) | 0 (0.0%) |
| College/Associate Degree | 286 (88.5%) | 37 (11.5%) |
| Bachelor's Degree or higher | 366 (88.6%) | 47 (11.4%) |
Occupancy by Age of Householder in Drum Point
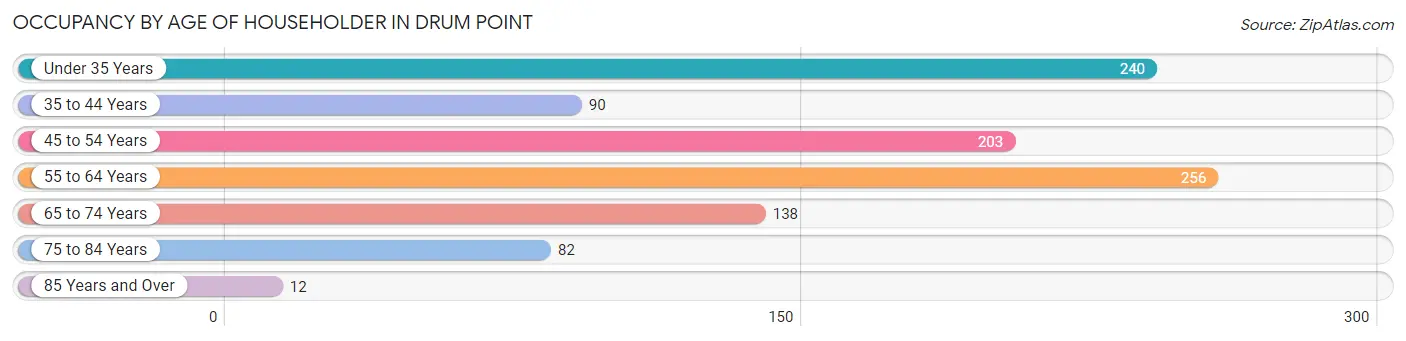
| Age Bracket | # Households | % Households |
| Under 35 Years | 240 | 23.5% |
| 35 to 44 Years | 90 | 8.8% |
| 45 to 54 Years | 203 | 19.9% |
| 55 to 64 Years | 256 | 25.1% |
| 65 to 74 Years | 138 | 13.5% |
| 75 to 84 Years | 82 | 8.0% |
| 85 Years and Over | 12 | 1.2% |
| Total | 1,021 | 100.0% |
Housing Finances in Drum Point
Median Income by Occupancy in Drum Point
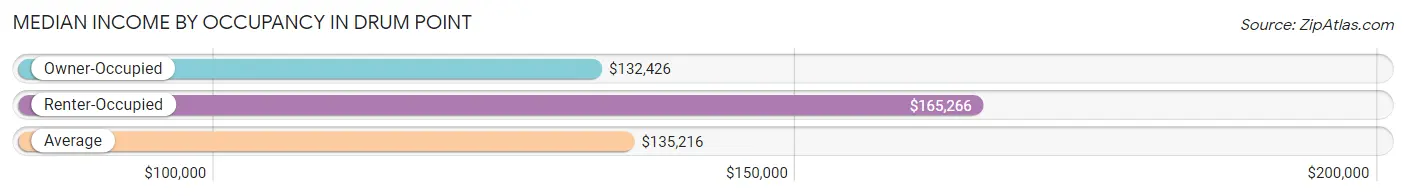
| Occupancy Type | # Households | Median Income |
| Owner-Occupied | 937 (91.8%) | $132,426 |
| Renter-Occupied | 84 (8.2%) | $165,266 |
| Average | 1,021 (100.0%) | $135,216 |
Occupancy by Householder Income Bracket in Drum Point
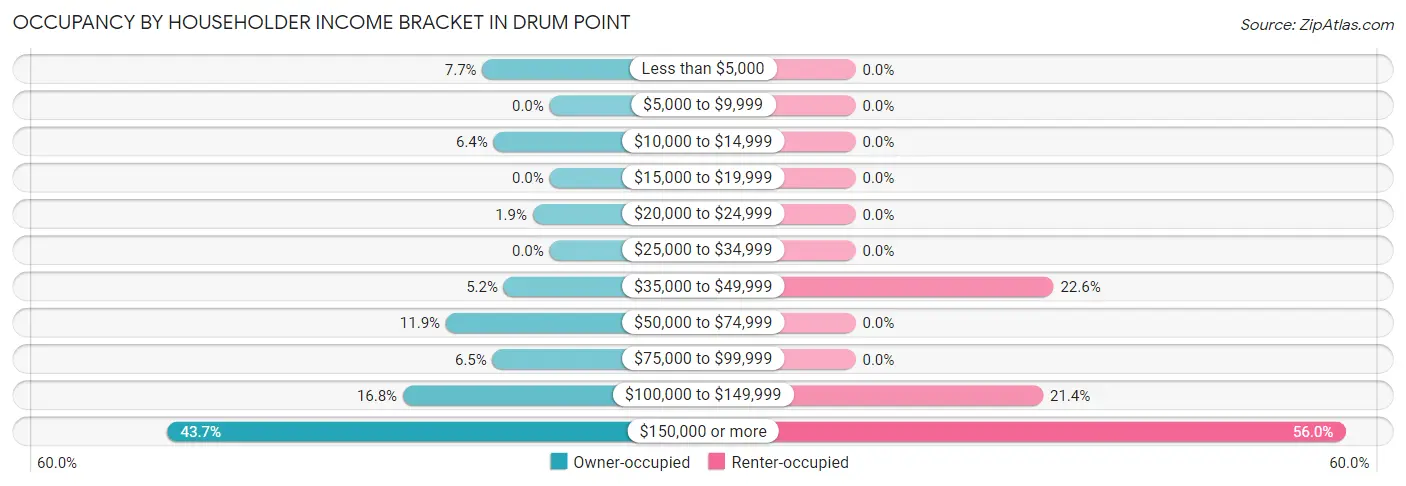
| Income Bracket | Owner-occupied | Renter-occupied |
| Less than $5,000 | 72 (7.7%) | 0 (0.0%) |
| $5,000 to $9,999 | 0 (0.0%) | 0 (0.0%) |
| $10,000 to $14,999 | 60 (6.4%) | 0 (0.0%) |
| $15,000 to $19,999 | 0 (0.0%) | 0 (0.0%) |
| $20,000 to $24,999 | 18 (1.9%) | 0 (0.0%) |
| $25,000 to $34,999 | 0 (0.0%) | 0 (0.0%) |
| $35,000 to $49,999 | 49 (5.2%) | 19 (22.6%) |
| $50,000 to $74,999 | 111 (11.8%) | 0 (0.0%) |
| $75,000 to $99,999 | 61 (6.5%) | 0 (0.0%) |
| $100,000 to $149,999 | 157 (16.8%) | 18 (21.4%) |
| $150,000 or more | 409 (43.6%) | 47 (55.9%) |
| Total | 937 (100.0%) | 84 (100.0%) |
Monthly Housing Cost Tiers in Drum Point
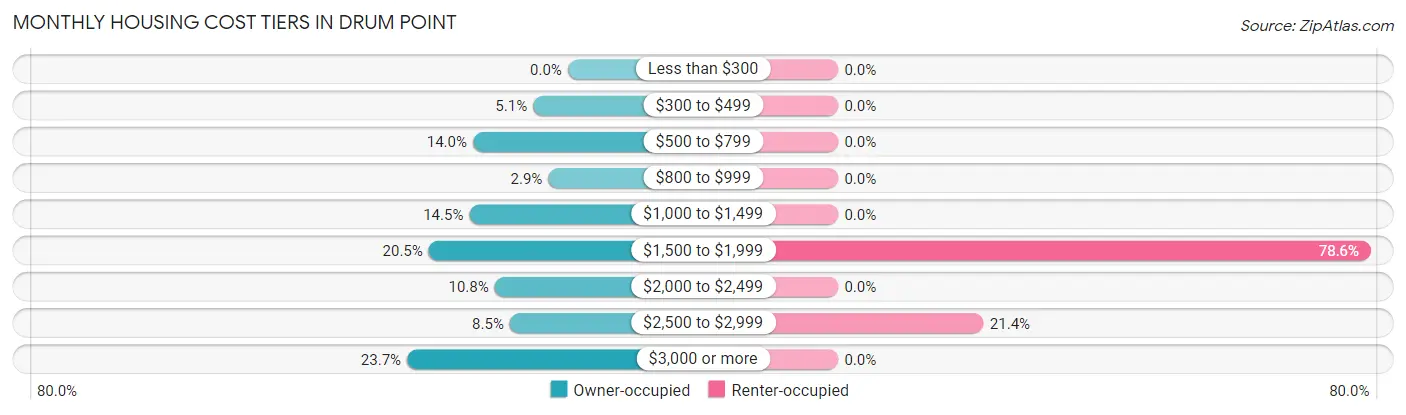
| Monthly Cost | Owner-occupied | Renter-occupied |
| Less than $300 | 0 (0.0%) | 0 (0.0%) |
| $300 to $499 | 48 (5.1%) | 0 (0.0%) |
| $500 to $799 | 131 (14.0%) | 0 (0.0%) |
| $800 to $999 | 27 (2.9%) | 0 (0.0%) |
| $1,000 to $1,499 | 136 (14.5%) | 0 (0.0%) |
| $1,500 to $1,999 | 192 (20.5%) | 66 (78.6%) |
| $2,000 to $2,499 | 101 (10.8%) | 0 (0.0%) |
| $2,500 to $2,999 | 80 (8.5%) | 18 (21.4%) |
| $3,000 or more | 222 (23.7%) | 0 (0.0%) |
| Total | 937 (100.0%) | 84 (100.0%) |
Physical Housing Characteristics in Drum Point
Housing Structures in Drum Point
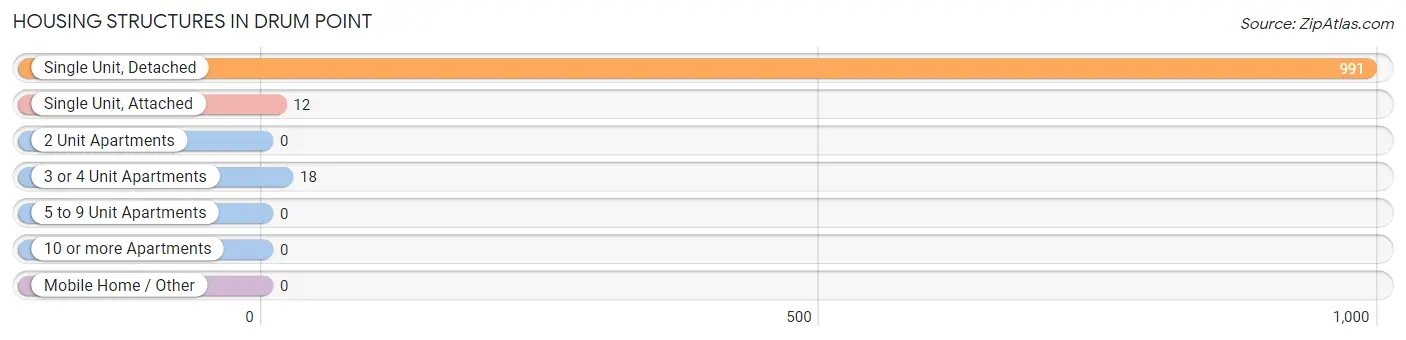
| Structure Type | # Housing Units | % Housing Units |
| Single Unit, Detached | 991 | 97.1% |
| Single Unit, Attached | 12 | 1.2% |
| 2 Unit Apartments | 0 | 0.0% |
| 3 or 4 Unit Apartments | 18 | 1.8% |
| 5 to 9 Unit Apartments | 0 | 0.0% |
| 10 or more Apartments | 0 | 0.0% |
| Mobile Home / Other | 0 | 0.0% |
| Total | 1,021 | 100.0% |
Housing Structures by Occupancy in Drum Point
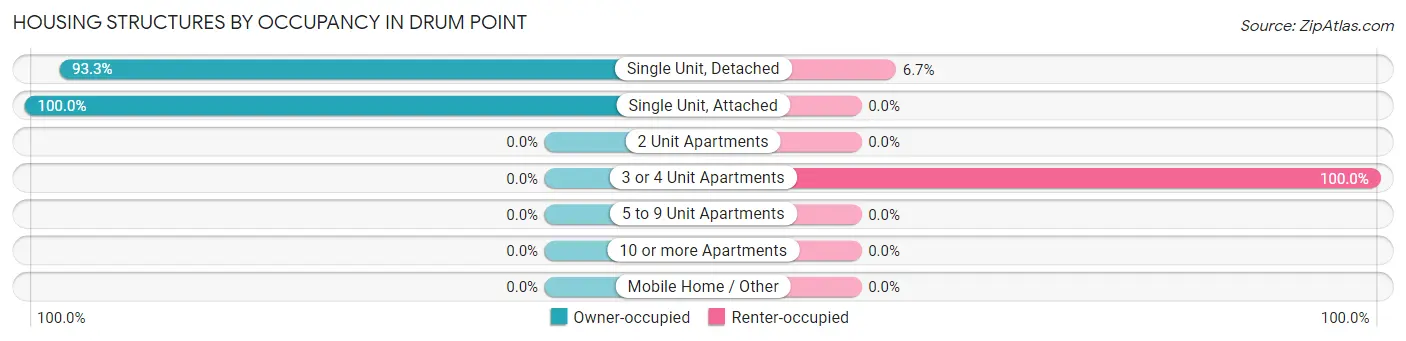
| Structure Type | Owner-occupied | Renter-occupied |
| Single Unit, Detached | 925 (93.3%) | 66 (6.7%) |
| Single Unit, Attached | 12 (100.0%) | 0 (0.0%) |
| 2 Unit Apartments | 0 (0.0%) | 0 (0.0%) |
| 3 or 4 Unit Apartments | 0 (0.0%) | 18 (100.0%) |
| 5 to 9 Unit Apartments | 0 (0.0%) | 0 (0.0%) |
| 10 or more Apartments | 0 (0.0%) | 0 (0.0%) |
| Mobile Home / Other | 0 (0.0%) | 0 (0.0%) |
| Total | 937 (91.8%) | 84 (8.2%) |
Housing Structures by Number of Rooms in Drum Point
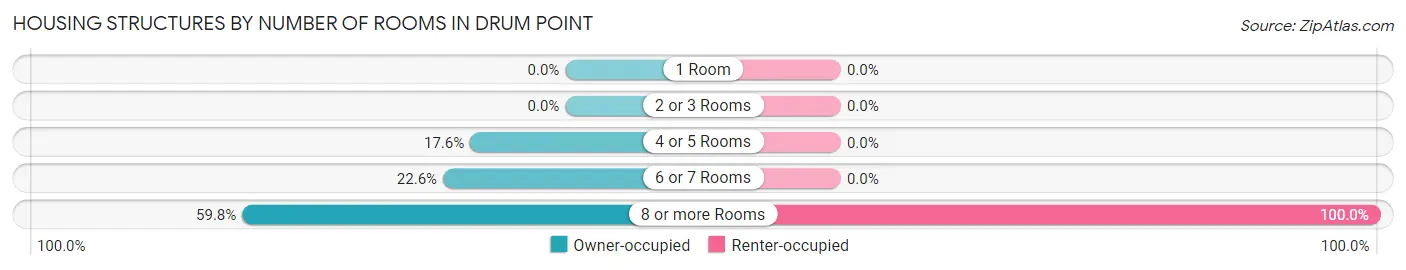
| Number of Rooms | Owner-occupied | Renter-occupied |
| 1 Room | 0 (0.0%) | 0 (0.0%) |
| 2 or 3 Rooms | 0 (0.0%) | 0 (0.0%) |
| 4 or 5 Rooms | 165 (17.6%) | 0 (0.0%) |
| 6 or 7 Rooms | 212 (22.6%) | 0 (0.0%) |
| 8 or more Rooms | 560 (59.8%) | 84 (100.0%) |
| Total | 937 (100.0%) | 84 (100.0%) |
Housing Structure by Heating Type in Drum Point
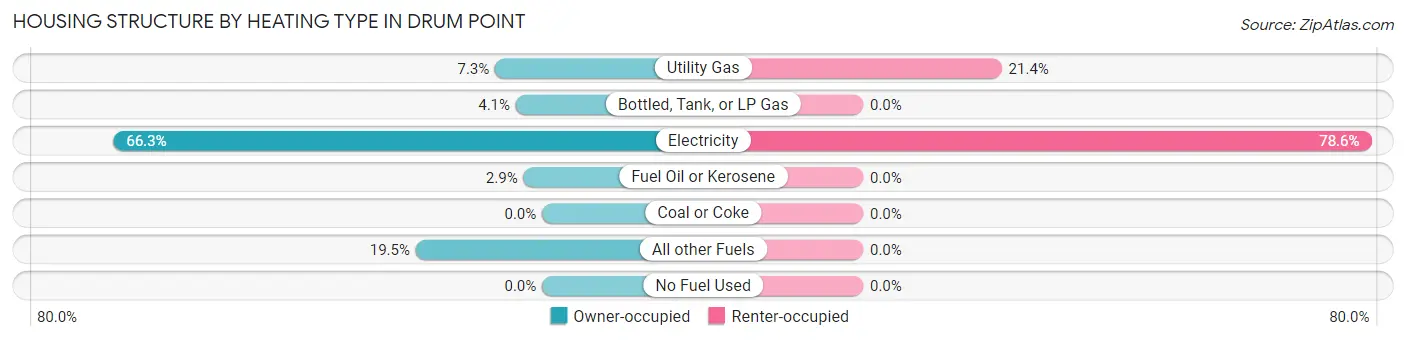
| Heating Type | Owner-occupied | Renter-occupied |
| Utility Gas | 68 (7.3%) | 18 (21.4%) |
| Bottled, Tank, or LP Gas | 38 (4.1%) | 0 (0.0%) |
| Electricity | 621 (66.3%) | 66 (78.6%) |
| Fuel Oil or Kerosene | 27 (2.9%) | 0 (0.0%) |
| Coal or Coke | 0 (0.0%) | 0 (0.0%) |
| All other Fuels | 183 (19.5%) | 0 (0.0%) |
| No Fuel Used | 0 (0.0%) | 0 (0.0%) |
| Total | 937 (100.0%) | 84 (100.0%) |
Household Vehicle Usage in Drum Point
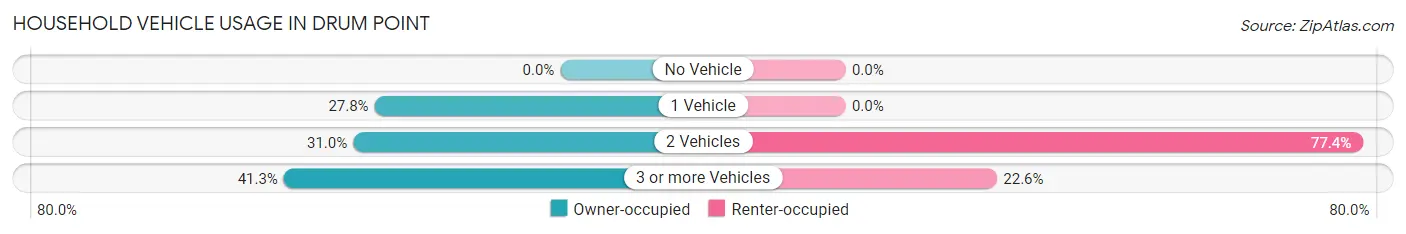
| Vehicles per Household | Owner-occupied | Renter-occupied |
| No Vehicle | 0 (0.0%) | 0 (0.0%) |
| 1 Vehicle | 260 (27.8%) | 0 (0.0%) |
| 2 Vehicles | 290 (30.9%) | 65 (77.4%) |
| 3 or more Vehicles | 387 (41.3%) | 19 (22.6%) |
| Total | 937 (100.0%) | 84 (100.0%) |
Real Estate & Mortgages in Drum Point
Real Estate and Mortgage Overview in Drum Point
| Characteristic | Without Mortgage | With Mortgage |
| Housing Units | 206 | 731 |
| Median Property Value | $409,800 | $393,500 |
| Median Household Income | - | - |
| Monthly Housing Costs | $596 | $222 |
| Real Estate Taxes | $3,375 | $0 |
Property Value by Mortgage Status in Drum Point
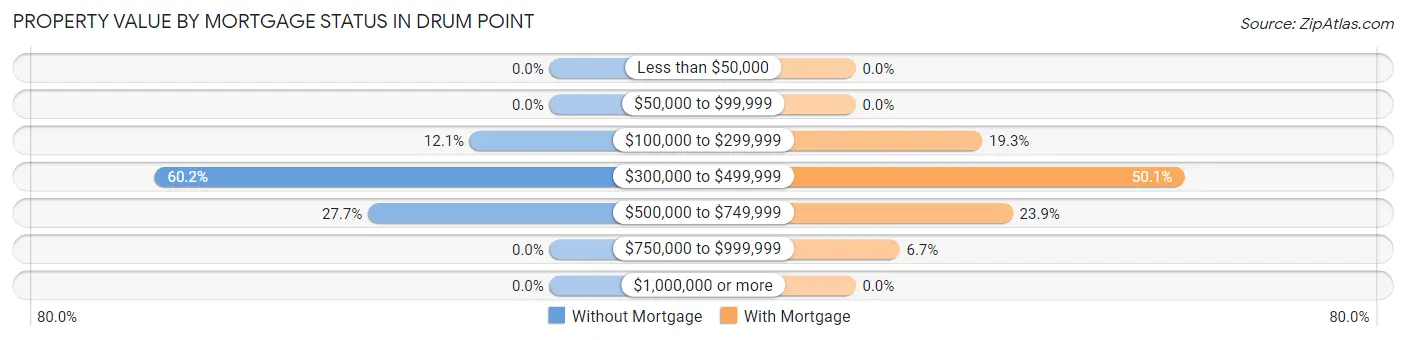
| Property Value | Without Mortgage | With Mortgage |
| Less than $50,000 | 0 (0.0%) | 0 (0.0%) |
| $50,000 to $99,999 | 0 (0.0%) | 0 (0.0%) |
| $100,000 to $299,999 | 25 (12.1%) | 141 (19.3%) |
| $300,000 to $499,999 | 124 (60.2%) | 366 (50.1%) |
| $500,000 to $749,999 | 57 (27.7%) | 175 (23.9%) |
| $750,000 to $999,999 | 0 (0.0%) | 49 (6.7%) |
| $1,000,000 or more | 0 (0.0%) | 0 (0.0%) |
| Total | 206 (100.0%) | 731 (100.0%) |
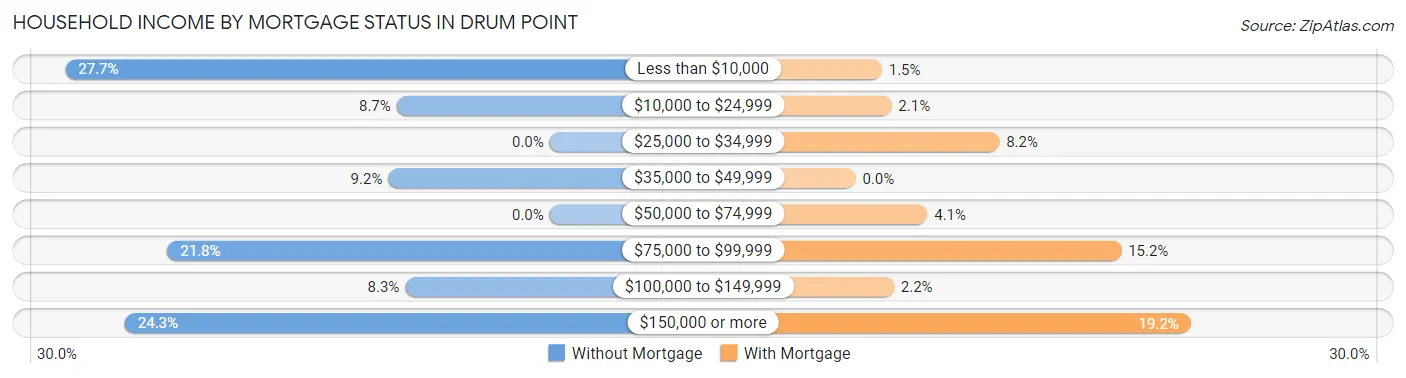
Household Income by Mortgage Status in Drum Point
| Household Income | Without Mortgage | With Mortgage |
| Less than $10,000 | 57 (27.7%) | 11 (1.5%) |
| $10,000 to $24,999 | 18 (8.7%) | 15 (2.1%) |
| $25,000 to $34,999 | 0 (0.0%) | 60 (8.2%) |
| $35,000 to $49,999 | 19 (9.2%) | 0 (0.0%) |
| $50,000 to $74,999 | 0 (0.0%) | 30 (4.1%) |
| $75,000 to $99,999 | 45 (21.8%) | 111 (15.2%) |
| $100,000 to $149,999 | 17 (8.3%) | 16 (2.2%) |
| $150,000 or more | 50 (24.3%) | 140 (19.2%) |
| Total | 206 (100.0%) | 731 (100.0%) |
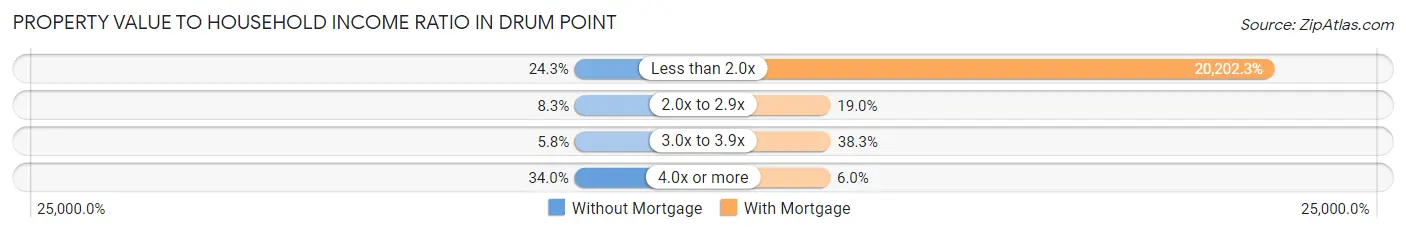
Property Value to Household Income Ratio in Drum Point
| Value-to-Income Ratio | Without Mortgage | With Mortgage |
| Less than 2.0x | 50 (24.3%) | 147,679 (20,202.3%) |
| 2.0x to 2.9x | 17 (8.3%) | 139 (19.0%) |
| 3.0x to 3.9x | 12 (5.8%) | 280 (38.3%) |
| 4.0x or more | 70 (34.0%) | 44 (6.0%) |
| Total | 206 (100.0%) | 731 (100.0%) |
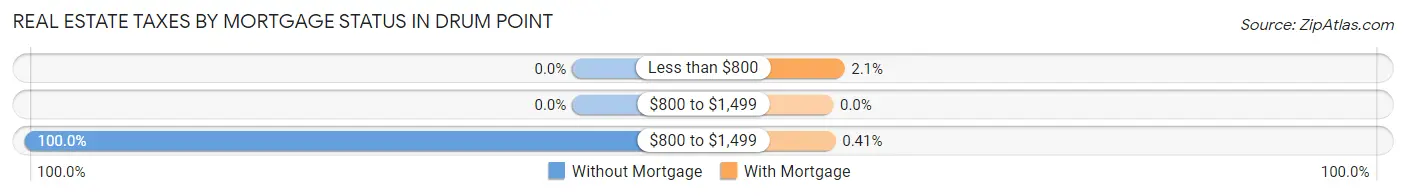
Real Estate Taxes by Mortgage Status in Drum Point
| Property Taxes | Without Mortgage | With Mortgage |
| Less than $800 | 0 (0.0%) | 15 (2.1%) |
| $800 to $1,499 | 0 (0.0%) | 0 (0.0%) |
| $800 to $1,499 | 206 (100.0%) | 3 (0.4%) |
| Total | 206 (100.0%) | 731 (100.0%) |
Health & Disability in Drum Point
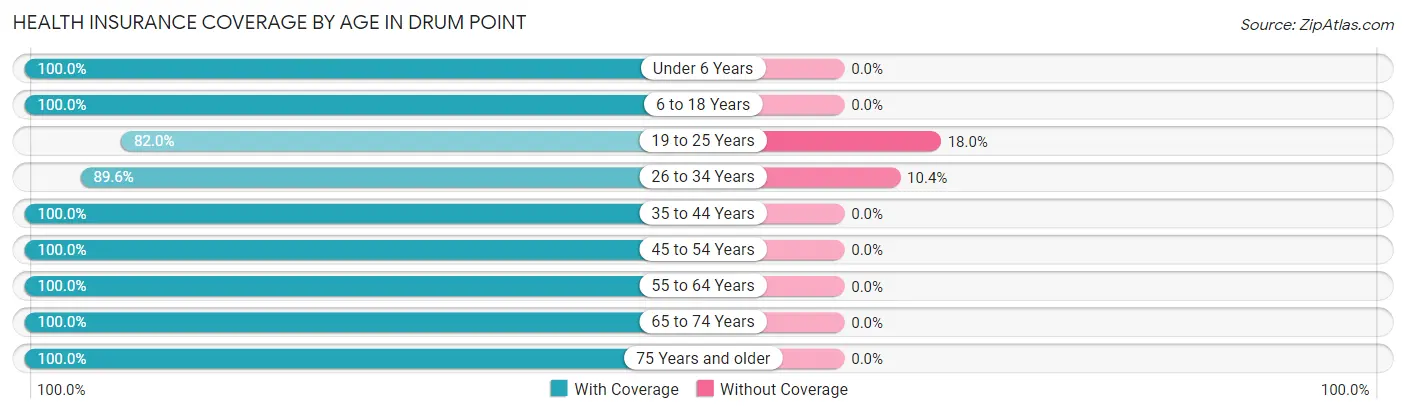
Health Insurance Coverage by Age in Drum Point
| Age Bracket | With Coverage | Without Coverage |
| Under 6 Years | 131 (100.0%) | 0 (0.0%) |
| 6 to 18 Years | 448 (100.0%) | 0 (0.0%) |
| 19 to 25 Years | 301 (82.0%) | 66 (18.0%) |
| 26 to 34 Years | 301 (89.6%) | 35 (10.4%) |
| 35 to 44 Years | 290 (100.0%) | 0 (0.0%) |
| 45 to 54 Years | 394 (100.0%) | 0 (0.0%) |
| 55 to 64 Years | 488 (100.0%) | 0 (0.0%) |
| 65 to 74 Years | 252 (100.0%) | 0 (0.0%) |
| 75 Years and older | 258 (100.0%) | 0 (0.0%) |
| Total | 2,863 (96.6%) | 101 (3.4%) |
Health Insurance Coverage by Citizenship Status in Drum Point
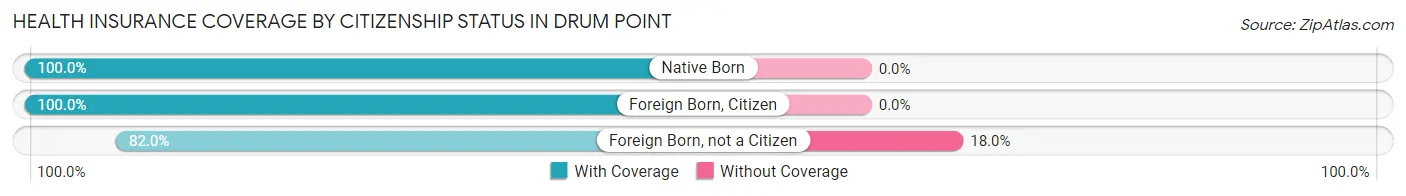
| Citizenship Status | With Coverage | Without Coverage |
| Native Born | 131 (100.0%) | 0 (0.0%) |
| Foreign Born, Citizen | 448 (100.0%) | 0 (0.0%) |
| Foreign Born, not a Citizen | 301 (82.0%) | 66 (18.0%) |
Health Insurance Coverage by Household Income in Drum Point
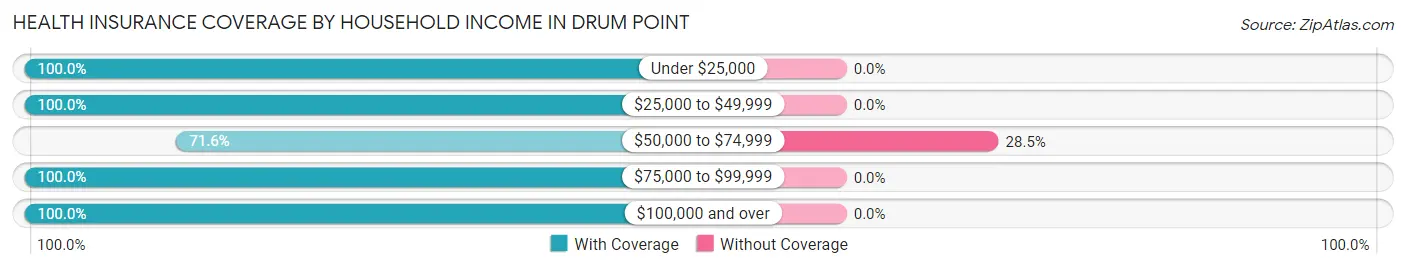
| Household Income | With Coverage | Without Coverage |
| Under $25,000 | 306 (100.0%) | 0 (0.0%) |
| $25,000 to $49,999 | 109 (100.0%) | 0 (0.0%) |
| $50,000 to $74,999 | 254 (71.6%) | 101 (28.4%) |
| $75,000 to $99,999 | 167 (100.0%) | 0 (0.0%) |
| $100,000 and over | 2,027 (100.0%) | 0 (0.0%) |
Public vs Private Health Insurance Coverage by Age in Drum Point
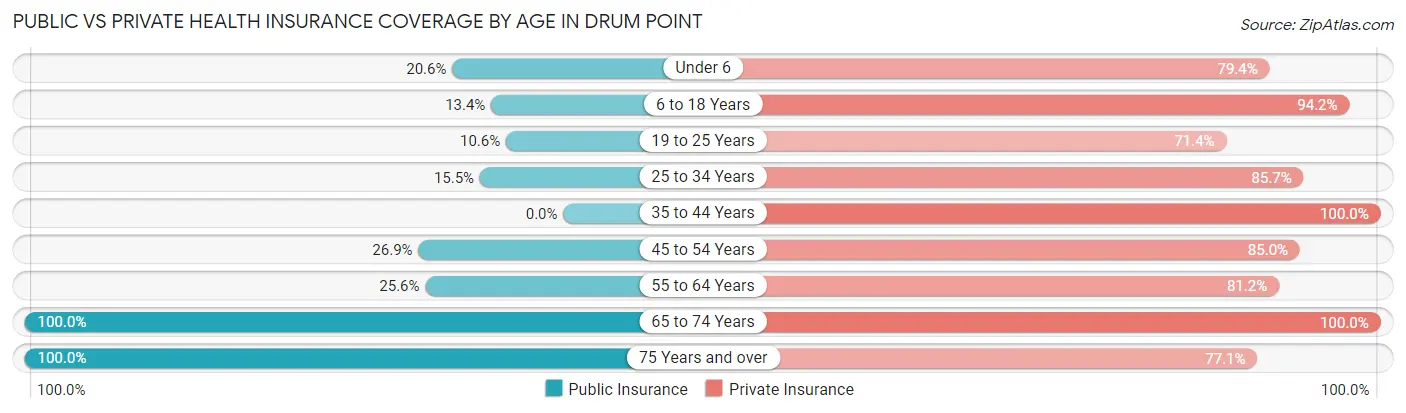
| Age Bracket | Public Insurance | Private Insurance |
| Under 6 | 27 (20.6%) | 104 (79.4%) |
| 6 to 18 Years | 60 (13.4%) | 422 (94.2%) |
| 19 to 25 Years | 39 (10.6%) | 262 (71.4%) |
| 25 to 34 Years | 52 (15.5%) | 288 (85.7%) |
| 35 to 44 Years | 0 (0.0%) | 290 (100.0%) |
| 45 to 54 Years | 106 (26.9%) | 335 (85.0%) |
| 55 to 64 Years | 125 (25.6%) | 396 (81.1%) |
| 65 to 74 Years | 252 (100.0%) | 252 (100.0%) |
| 75 Years and over | 258 (100.0%) | 199 (77.1%) |
| Total | 919 (31.0%) | 2,548 (86.0%) |
Disability Status by Sex by Age in Drum Point
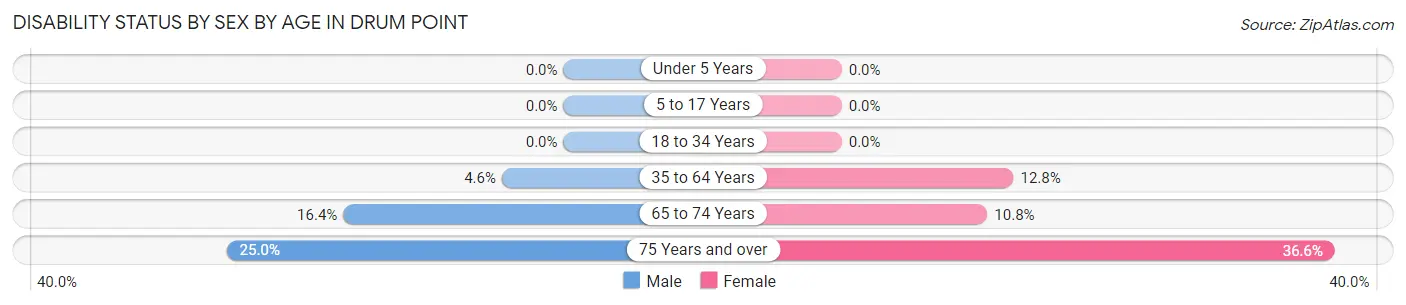
| Age Bracket | Male | Female |
| Under 5 Years | 0 (0.0%) | 0 (0.0%) |
| 5 to 17 Years | 0 (0.0%) | 0 (0.0%) |
| 18 to 34 Years | 0 (0.0%) | 0 (0.0%) |
| 35 to 64 Years | 31 (4.6%) | 63 (12.8%) |
| 65 to 74 Years | 17 (16.4%) | 16 (10.8%) |
| 75 Years and over | 16 (25.0%) | 71 (36.6%) |
Disability Class by Sex by Age in Drum Point
Disability Class: Hearing Difficulty
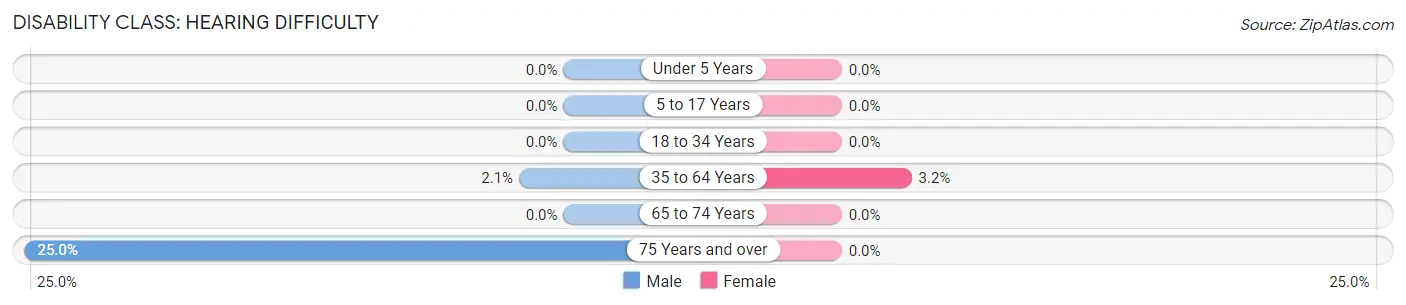
| Age Bracket | Male | Female |
| Under 5 Years | 0 (0.0%) | 0 (0.0%) |
| 5 to 17 Years | 0 (0.0%) | 0 (0.0%) |
| 18 to 34 Years | 0 (0.0%) | 0 (0.0%) |
| 35 to 64 Years | 14 (2.1%) | 16 (3.2%) |
| 65 to 74 Years | 0 (0.0%) | 0 (0.0%) |
| 75 Years and over | 16 (25.0%) | 0 (0.0%) |
Disability Class: Vision Difficulty
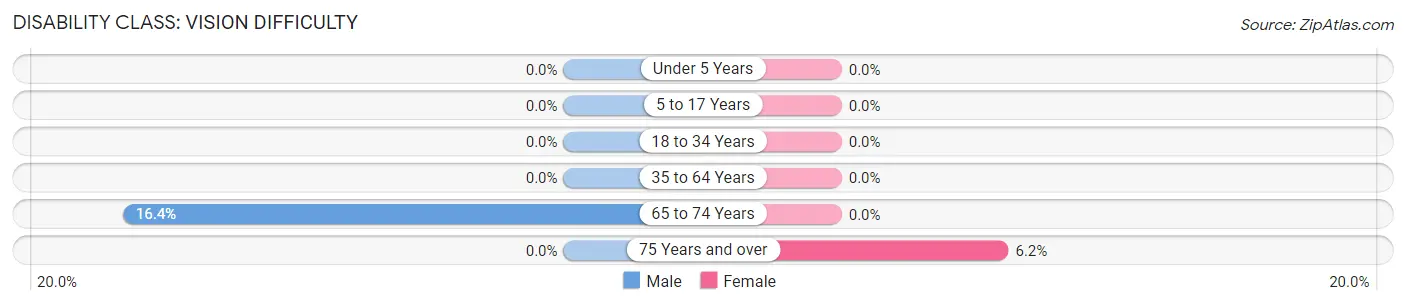
| Age Bracket | Male | Female |
| Under 5 Years | 0 (0.0%) | 0 (0.0%) |
| 5 to 17 Years | 0 (0.0%) | 0 (0.0%) |
| 18 to 34 Years | 0 (0.0%) | 0 (0.0%) |
| 35 to 64 Years | 0 (0.0%) | 0 (0.0%) |
| 65 to 74 Years | 17 (16.4%) | 0 (0.0%) |
| 75 Years and over | 0 (0.0%) | 12 (6.2%) |
Disability Class: Cognitive Difficulty
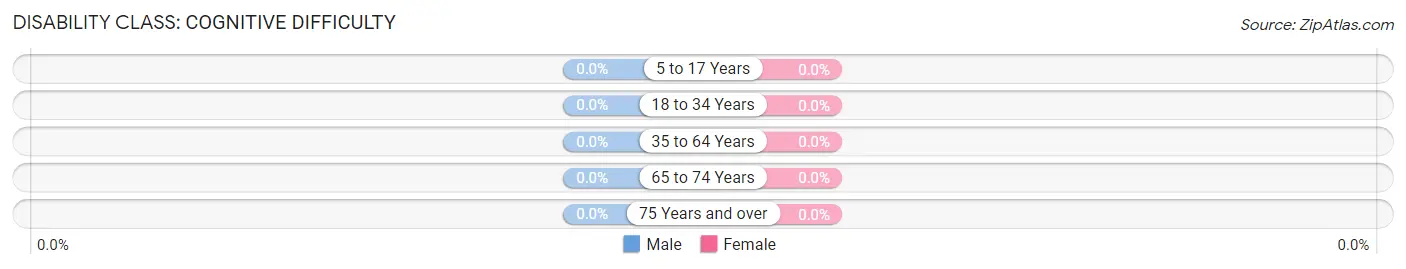
| Age Bracket | Male | Female |
| 5 to 17 Years | 0 (0.0%) | 0 (0.0%) |
| 18 to 34 Years | 0 (0.0%) | 0 (0.0%) |
| 35 to 64 Years | 0 (0.0%) | 0 (0.0%) |
| 65 to 74 Years | 0 (0.0%) | 0 (0.0%) |
| 75 Years and over | 0 (0.0%) | 0 (0.0%) |
Disability Class: Ambulatory Difficulty
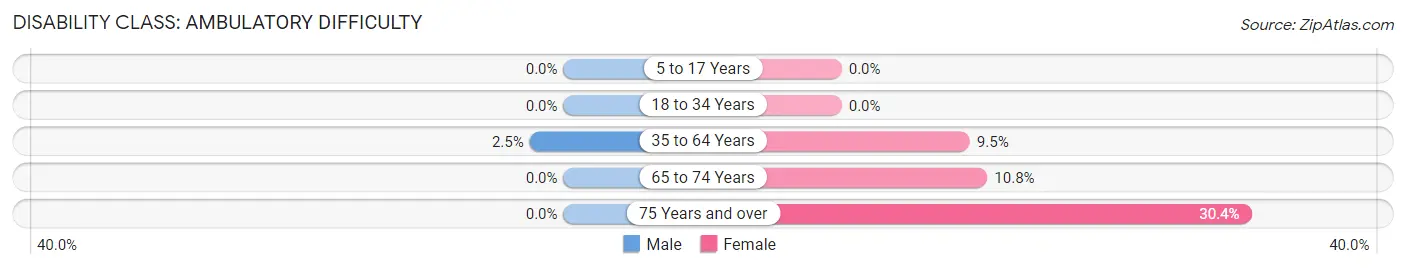
| Age Bracket | Male | Female |
| 5 to 17 Years | 0 (0.0%) | 0 (0.0%) |
| 18 to 34 Years | 0 (0.0%) | 0 (0.0%) |
| 35 to 64 Years | 17 (2.5%) | 47 (9.5%) |
| 65 to 74 Years | 0 (0.0%) | 16 (10.8%) |
| 75 Years and over | 0 (0.0%) | 59 (30.4%) |
Disability Class: Self-Care Difficulty
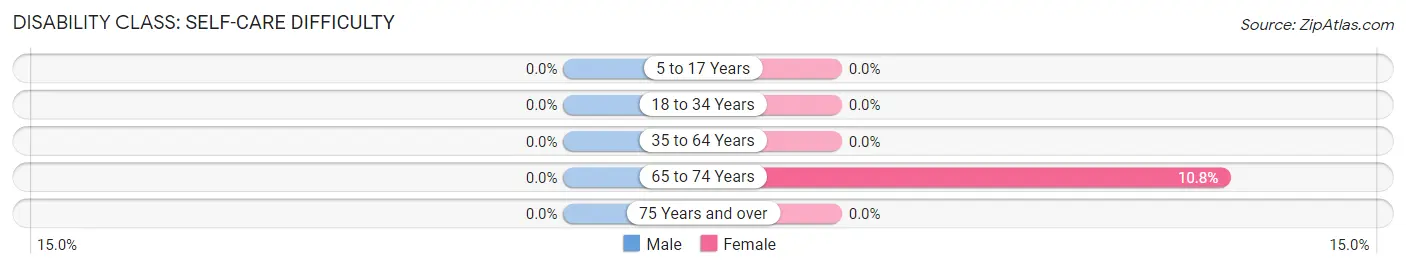
| Age Bracket | Male | Female |
| 5 to 17 Years | 0 (0.0%) | 0 (0.0%) |
| 18 to 34 Years | 0 (0.0%) | 0 (0.0%) |
| 35 to 64 Years | 0 (0.0%) | 0 (0.0%) |
| 65 to 74 Years | 0 (0.0%) | 16 (10.8%) |
| 75 Years and over | 0 (0.0%) | 0 (0.0%) |
Technology Access in Drum Point
Computing Device Access in Drum Point
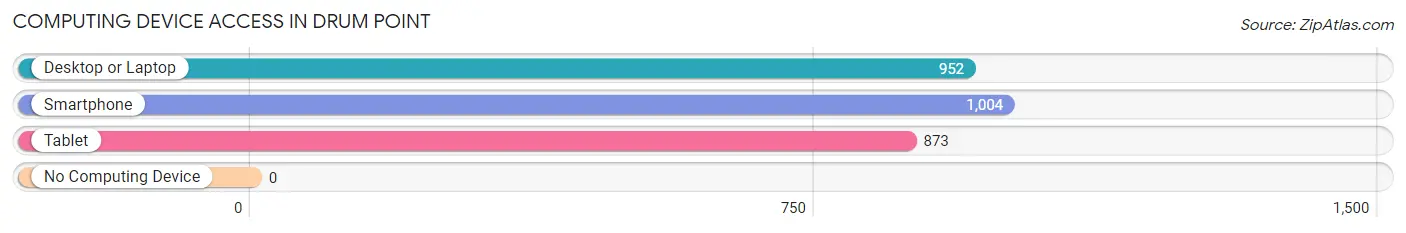
| Device Type | # Households | % Households |
| Desktop or Laptop | 952 | 93.2% |
| Smartphone | 1,004 | 98.3% |
| Tablet | 873 | 85.5% |
| No Computing Device | 0 | 0.0% |
| Total | 1,021 | 100.0% |
Internet Access in Drum Point
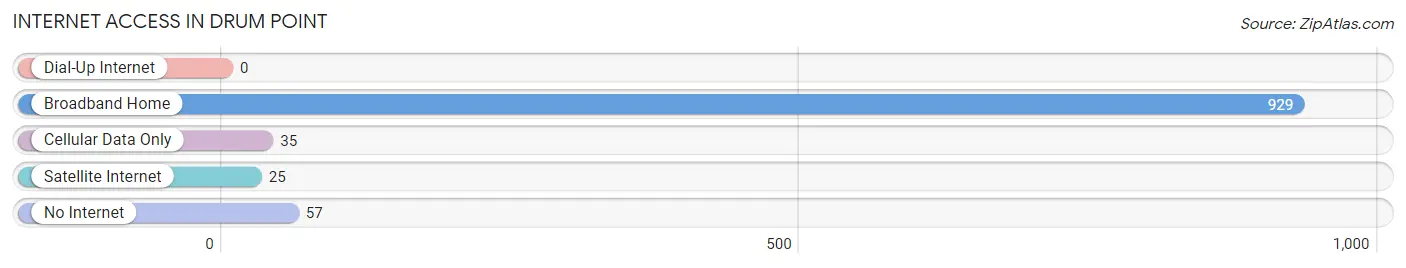
| Internet Type | # Households | % Households |
| Dial-Up Internet | 0 | 0.0% |
| Broadband Home | 929 | 91.0% |
| Cellular Data Only | 35 | 3.4% |
| Satellite Internet | 25 | 2.5% |
| No Internet | 57 | 5.6% |
| Total | 1,021 | 100.0% |
Drum Point Summary
Drum Point is a small unincorporated community located in Calvert County, Maryland. It is situated on the Patuxent River, approximately 25 miles south of Washington, D.C. The community is home to a variety of businesses, including a marina, a seafood market, and a crab house.
History
Drum Point was first settled in the early 1700s by English settlers. The area was originally known as “Drum Point Neck” and was part of a larger tract of land known as “Drum Point Plantation.” The plantation was owned by the Drummond family, who were prominent landowners in the area. The Drummonds were also involved in the slave trade, and the plantation was home to a large number of slaves.
In the late 1800s, the area began to develop as a fishing and crabbing community. The Drum Point Crab House was established in the early 1900s and is still in operation today. The community also became a popular destination for recreational boaters, and the Drum Point Marina was established in the 1950s.
Geography
Drum Point is located in Calvert County, Maryland, on the Patuxent River. The community is situated on a peninsula, with the Patuxent River to the east and the Chesapeake Bay to the west. The area is mostly flat, with some low hills and marshland.
The climate in Drum Point is humid subtropical, with hot, humid summers and mild winters. The average annual temperature is around 60 degrees Fahrenheit.
Economy
The economy of Drum Point is largely based on fishing and crabbing. The Drum Point Crab House is a popular destination for locals and tourists alike, and the Drum Point Marina is a popular spot for recreational boaters.
The community also has a number of small businesses, including a seafood market, a convenience store, and a gas station.
Demographics
As of the 2010 census, the population of Drum Point was 1,845. The racial makeup of the community was 94.3% White, 2.2% African American, 0.7% Asian, 0.3% Native American, and 2.5% from other races.
The median household income in Drum Point was $63,750, and the median family income was $71,250. The per capita income was $27,945.
Conclusion
Drum Point is a small unincorporated community located in Calvert County, Maryland. It is situated on the Patuxent River, approximately 25 miles south of Washington, D.C. The community is home to a variety of businesses, including a marina, a seafood market, and a crab house. The economy of Drum Point is largely based on fishing and crabbing, and the population of the community is 1,845 as of the 2010 census. Drum Point is a popular destination for recreational boaters, and the community has a number of small businesses.
Common Questions
What is the Total Population of Drum Point?
Total Population of Drum Point is 2,979.
What is the Total Male Population of Drum Point?
Total Male Population of Drum Point is 1,458.
What is the Total Female Population of Drum Point?
Total Female Population of Drum Point is 1,521.
What is the Ratio of Males per 100 Females in Drum Point?
There are 95.86 Males per 100 Females in Drum Point.
What is the Ratio of Females per 100 Males in Drum Point?
There are 104.32 Females per 100 Males in Drum Point.
What is the Median Population Age in Drum Point?
Median Population Age in Drum Point is 41.9 Years.
What is the Average Family Size in Drum Point
Average Family Size in Drum Point is 3.3 People.
What is the Average Household Size in Drum Point
Average Household Size in Drum Point is 2.9 People.
What is Per Capita Income in Drum Point?
Per Capita income in Drum Point is $52,842.
What is the Median Family Income in Drum Point?
Median Family Income in Drum Point is $150,386.
What is the Median Household income in Drum Point?
Median Household Income in Drum Point is $135,216.
What is Income or Wage Gap in Drum Point?
Income or Wage Gap in Drum Point is 29.4%.
Women in Drum Point earn 70.6 cents for every dollar earned by a man.
What is Inequality or Gini Index in Drum Point?
Inequality or Gini Index in Drum Point is 0.44.
How Large is the Labor Force in Drum Point?
There are 1,503 People in the Labor Forcein in Drum Point.
What is the Percentage of People in the Labor Force in Drum Point?
61.1% of People are in the Labor Force in Drum Point.
What is the Unemployment Rate in Drum Point?
Unemployment Rate in Drum Point is 3.0%.