Cities with the Highest Percentage of Immigrants from Northern Europe in Minnesota
RELATED REPORTS & OPTIONS
Northern Europe
Minnesota
Compare Cities
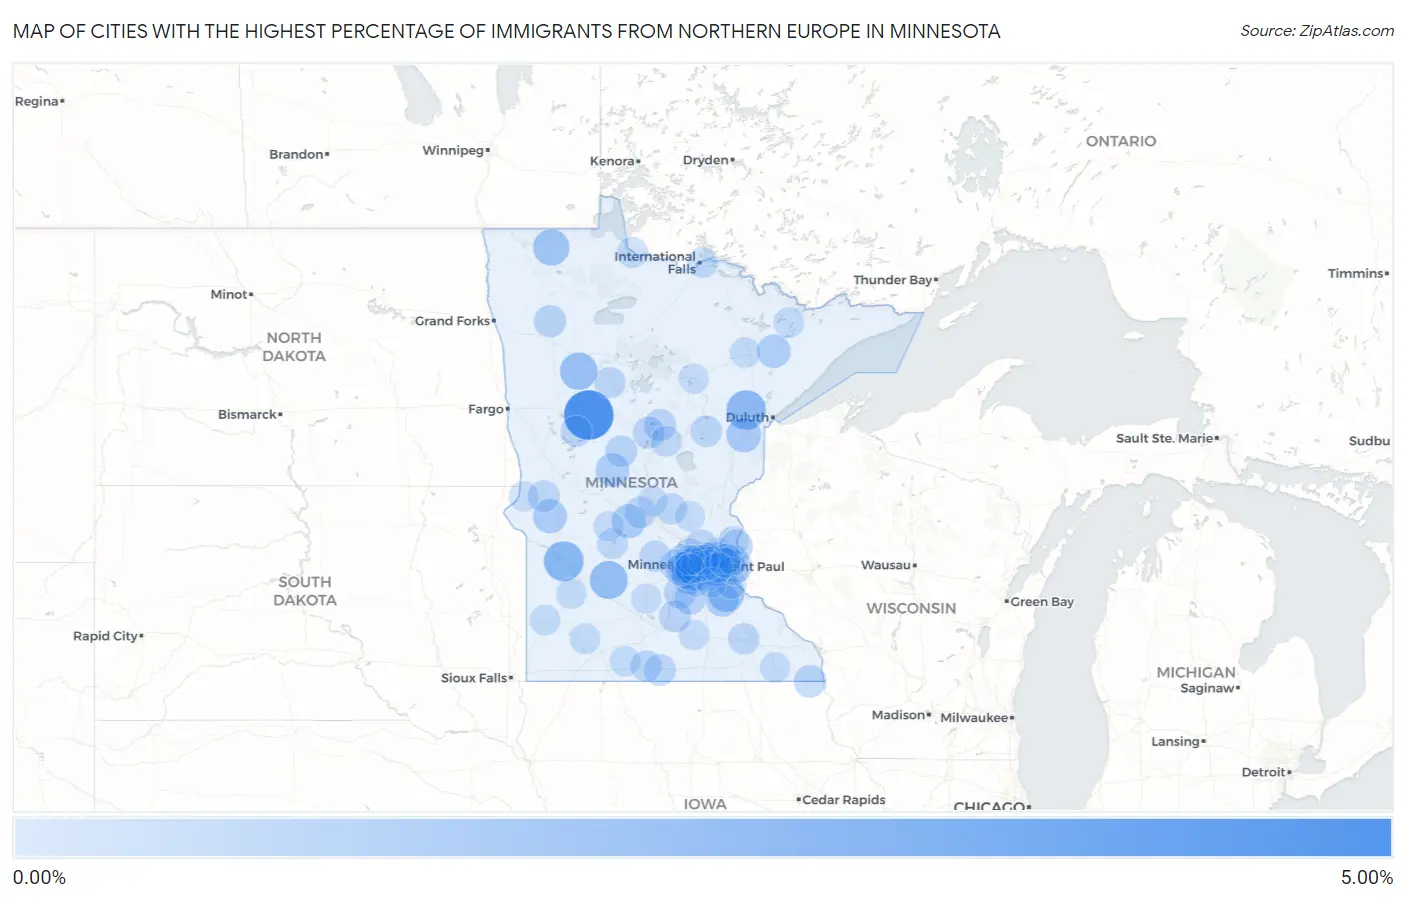
Map of Cities with the Highest Percentage of Immigrants from Northern Europe in Minnesota
0.00%
5.00%
Cities with the Highest Percentage of Immigrants from Northern Europe in Minnesota
| City | Northern Europe | vs State | vs National | |
| 1. | Wolf Lake | 4.11% | 0.14%(+3.97)#1 | 0.29%(+3.82)#150 |
| 2. | Watson | 2.09% | 0.14%(+1.95)#2 | 0.29%(+1.81)#497 |
| 3. | Brookston | 2.02% | 0.14%(+1.88)#3 | 0.29%(+1.73)#529 |
| 4. | Olivia | 1.74% | 0.14%(+1.60)#4 | 0.29%(+1.45)#662 |
| 5. | Roy Lake | 1.61% | 0.14%(+1.47)#5 | 0.29%(+1.33)#740 |
| 6. | New Trier | 1.39% | 0.14%(+1.25)#6 | 0.29%(+1.10)#923 |
| 7. | Badger | 1.38% | 0.14%(+1.24)#7 | 0.29%(+1.10)#926 |
| 8. | Minnetonka Beach | 1.30% | 0.14%(+1.15)#8 | 0.29%(+1.01)#1,017 |
| 9. | Mahtowa | 1.09% | 0.14%(+0.950)#9 | 0.29%(+0.808)#1,293 |
| 10. | Alberta | 0.99% | 0.14%(+0.847)#10 | 0.29%(+0.705)#1,494 |
| 11. | St Martin | 0.97% | 0.14%(+0.831)#11 | 0.29%(+0.689)#1,520 |
| 12. | Wayzata | 0.96% | 0.14%(+0.819)#12 | 0.29%(+0.677)#1,547 |
| 13. | Clarissa | 0.89% | 0.14%(+0.744)#13 | 0.29%(+0.602)#1,713 |
| 14. | Hoyt Lakes | 0.86% | 0.14%(+0.716)#14 | 0.29%(+0.574)#1,795 |
| 15. | Randolph | 0.83% | 0.14%(+0.683)#15 | 0.29%(+0.541)#1,887 |
| 16. | Chaska | 0.79% | 0.14%(+0.646)#16 | 0.29%(+0.503)#1,997 |
| 17. | Dresbach | 0.77% | 0.14%(+0.629)#17 | 0.29%(+0.487)#2,042 |
| 18. | West St Paul | 0.72% | 0.14%(+0.577)#18 | 0.29%(+0.435)#2,193 |
| 19. | Marine On St Croix | 0.69% | 0.14%(+0.550)#19 | 0.29%(+0.408)#2,281 |
| 20. | Eitzen | 0.63% | 0.14%(+0.484)#20 | 0.29%(+0.342)#2,522 |
| 21. | Spring Park | 0.63% | 0.14%(+0.482)#21 | 0.29%(+0.340)#2,534 |
| 22. | Plummer | 0.62% | 0.14%(+0.472)#22 | 0.29%(+0.330)#2,579 |
| 23. | Lakeland Shores | 0.61% | 0.14%(+0.463)#23 | 0.29%(+0.321)#2,622 |
| 24. | Belle Plaine | 0.60% | 0.14%(+0.454)#24 | 0.29%(+0.312)#2,655 |
| 25. | Eden Prairie | 0.60% | 0.14%(+0.452)#25 | 0.29%(+0.310)#2,665 |
| 26. | Crosslake | 0.57% | 0.14%(+0.427)#26 | 0.29%(+0.284)#2,801 |
| 27. | Pequot Lakes | 0.56% | 0.14%(+0.419)#27 | 0.29%(+0.277)#2,834 |
| 28. | Cleveland | 0.56% | 0.14%(+0.413)#28 | 0.29%(+0.271)#2,862 |
| 29. | New Prague | 0.54% | 0.14%(+0.396)#29 | 0.29%(+0.254)#2,942 |
| 30. | Greenwood | 0.54% | 0.14%(+0.396)#30 | 0.29%(+0.254)#2,945 |
| 31. | Staples | 0.52% | 0.14%(+0.379)#31 | 0.29%(+0.237)#3,031 |
| 32. | Deephaven | 0.52% | 0.14%(+0.376)#32 | 0.29%(+0.234)#3,052 |
| 33. | Orono | 0.51% | 0.14%(+0.368)#33 | 0.29%(+0.225)#3,088 |
| 34. | Golden Valley | 0.51% | 0.14%(+0.367)#34 | 0.29%(+0.225)#3,091 |
| 35. | Blue Earth | 0.50% | 0.14%(+0.360)#35 | 0.29%(+0.218)#3,122 |
| 36. | Avon | 0.50% | 0.14%(+0.353)#36 | 0.29%(+0.211)#3,165 |
| 37. | Mendota Heights | 0.49% | 0.14%(+0.346)#37 | 0.29%(+0.204)#3,201 |
| 38. | North Oaks | 0.48% | 0.14%(+0.338)#38 | 0.29%(+0.196)#3,243 |
| 39. | Herman | 0.47% | 0.14%(+0.328)#39 | 0.29%(+0.186)#3,305 |
| 40. | Shorewood | 0.47% | 0.14%(+0.323)#40 | 0.29%(+0.181)#3,338 |
| 41. | Lake Elmo | 0.46% | 0.14%(+0.312)#41 | 0.29%(+0.170)#3,394 |
| 42. | Mcgregor | 0.45% | 0.14%(+0.305)#42 | 0.29%(+0.163)#3,454 |
| 43. | Granada | 0.45% | 0.14%(+0.303)#43 | 0.29%(+0.161)#3,468 |
| 44. | Cokato | 0.43% | 0.14%(+0.290)#44 | 0.29%(+0.148)#3,547 |
| 45. | Foley | 0.41% | 0.14%(+0.265)#45 | 0.29%(+0.123)#3,733 |
| 46. | Byron | 0.41% | 0.14%(+0.265)#46 | 0.29%(+0.123)#3,735 |
| 47. | Independence | 0.40% | 0.14%(+0.260)#47 | 0.29%(+0.118)#3,772 |
| 48. | Anoka | 0.40% | 0.14%(+0.259)#48 | 0.29%(+0.117)#3,781 |
| 49. | Chanhassen | 0.40% | 0.14%(+0.255)#49 | 0.29%(+0.113)#3,824 |
| 50. | Perham | 0.40% | 0.14%(+0.254)#50 | 0.29%(+0.112)#3,832 |
| 51. | Lilydale | 0.39% | 0.14%(+0.251)#51 | 0.29%(+0.109)#3,850 |
| 52. | Lake George | 0.39% | 0.14%(+0.247)#52 | 0.29%(+0.105)#3,881 |
| 53. | Corcoran | 0.37% | 0.14%(+0.223)#53 | 0.29%(+0.081)#4,079 |
| 54. | Shoreview | 0.37% | 0.14%(+0.222)#54 | 0.29%(+0.080)#4,096 |
| 55. | Watertown | 0.36% | 0.14%(+0.218)#55 | 0.29%(+0.075)#4,127 |
| 56. | Ironton | 0.36% | 0.14%(+0.215)#56 | 0.29%(+0.072)#4,150 |
| 57. | Baudette | 0.35% | 0.14%(+0.211)#57 | 0.29%(+0.069)#4,184 |
| 58. | Spicer | 0.34% | 0.14%(+0.193)#58 | 0.29%(+0.051)#4,346 |
| 59. | Minnetrista | 0.34% | 0.14%(+0.192)#59 | 0.29%(+0.050)#4,352 |
| 60. | Columbia Heights | 0.33% | 0.14%(+0.191)#60 | 0.29%(+0.049)#4,361 |
| 61. | Ranier | 0.33% | 0.14%(+0.189)#61 | 0.29%(+0.047)#4,387 |
| 62. | New Brighton | 0.32% | 0.14%(+0.181)#62 | 0.29%(+0.039)#4,455 |
| 63. | Ely | 0.31% | 0.14%(+0.163)#63 | 0.29%(+0.021)#4,624 |
| 64. | Brooklyn Center | 0.30% | 0.14%(+0.156)#64 | 0.29%(+0.014)#4,690 |
| 65. | Trimont | 0.29% | 0.14%(+0.149)#65 | 0.29%(+0.007)#4,766 |
| 66. | Credit River | 0.29% | 0.14%(+0.147)#66 | 0.29%(+0.005)#4,791 |
| 67. | St Anthony City Hennepin And Ramsey Counties | 0.29% | 0.14%(+0.146)#67 | 0.29%(+0.004)#4,811 |
| 68. | Tyler | 0.29% | 0.14%(+0.145)#68 | 0.29%(+0.003)#4,829 |
| 69. | Roseville | 0.28% | 0.14%(+0.134)#69 | 0.29%(-0.008)#4,927 |
| 70. | Shakopee | 0.28% | 0.14%(+0.133)#70 | 0.29%(-0.009)#4,931 |
| 71. | Bloomington | 0.27% | 0.14%(+0.130)#71 | 0.29%(-0.012)#4,963 |
| 72. | Victoria | 0.27% | 0.14%(+0.128)#72 | 0.29%(-0.014)#4,982 |
| 73. | St Louis Park | 0.27% | 0.14%(+0.127)#73 | 0.29%(-0.015)#4,995 |
| 74. | Hastings | 0.27% | 0.14%(+0.124)#74 | 0.29%(-0.018)#5,034 |
| 75. | Minnetonka | 0.27% | 0.14%(+0.122)#75 | 0.29%(-0.020)#5,060 |
| 76. | Cottonwood | 0.26% | 0.14%(+0.118)#76 | 0.29%(-0.025)#5,106 |
| 77. | Minneapolis | 0.26% | 0.14%(+0.114)#77 | 0.29%(-0.028)#5,137 |
| 78. | St Bonifacius | 0.26% | 0.14%(+0.112)#78 | 0.29%(-0.030)#5,164 |
| 79. | Preston | 0.25% | 0.14%(+0.102)#79 | 0.29%(-0.040)#5,287 |
| 80. | Mountain Iron | 0.24% | 0.14%(+0.101)#80 | 0.29%(-0.041)#5,300 |
| 81. | Plymouth | 0.24% | 0.14%(+0.098)#81 | 0.29%(-0.044)#5,325 |
| 82. | Vadnais Heights | 0.24% | 0.14%(+0.098)#82 | 0.29%(-0.044)#5,330 |
| 83. | Westbrook | 0.24% | 0.14%(+0.097)#83 | 0.29%(-0.045)#5,335 |
| 84. | Afton | 0.24% | 0.14%(+0.094)#84 | 0.29%(-0.048)#5,387 |
| 85. | Belgrade | 0.24% | 0.14%(+0.093)#85 | 0.29%(-0.049)#5,397 |
| 86. | Winthrop | 0.23% | 0.14%(+0.088)#86 | 0.29%(-0.054)#5,456 |
| 87. | Oak Park Heights | 0.23% | 0.14%(+0.086)#87 | 0.29%(-0.056)#5,474 |
| 88. | Scandia | 0.23% | 0.14%(+0.084)#88 | 0.29%(-0.058)#5,508 |
| 89. | Pine Springs | 0.23% | 0.14%(+0.082)#89 | 0.29%(-0.060)#5,528 |
| 90. | Princeton | 0.22% | 0.14%(+0.081)#90 | 0.29%(-0.061)#5,546 |
| 91. | Wheaton | 0.22% | 0.14%(+0.080)#91 | 0.29%(-0.062)#5,555 |
| 92. | Rice | 0.21% | 0.14%(+0.067)#92 | 0.29%(-0.075)#5,739 |
| 93. | Robbinsdale | 0.21% | 0.14%(+0.064)#93 | 0.29%(-0.078)#5,781 |
| 94. | Medina | 0.21% | 0.14%(+0.064)#94 | 0.29%(-0.078)#5,783 |
| 95. | Waseca | 0.21% | 0.14%(+0.063)#95 | 0.29%(-0.079)#5,796 |
| 96. | Tonka Bay | 0.21% | 0.14%(+0.062)#96 | 0.29%(-0.080)#5,810 |
| 97. | Apple Valley | 0.20% | 0.14%(+0.056)#97 | 0.29%(-0.086)#5,888 |
| 98. | Grand Rapids | 0.20% | 0.14%(+0.054)#98 | 0.29%(-0.088)#5,925 |
| 99. | St Paul | 0.19% | 0.14%(+0.051)#99 | 0.29%(-0.091)#5,970 |
| 100. | Oakdale | 0.19% | 0.14%(+0.049)#100 | 0.29%(-0.093)#5,994 |
Common Questions
What are the Top 10 Cities with the Highest Percentage of Immigrants from Northern Europe in Minnesota?
Top 10 Cities with the Highest Percentage of Immigrants from Northern Europe in Minnesota are:
What city has the Highest Percentage of Immigrants from Northern Europe in Minnesota?
Wolf Lake has the Highest Percentage of Immigrants from Northern Europe in Minnesota with 4.11%.
What is the Percentage of Immigrants from Northern Europe in the State of Minnesota?
Percentage of Immigrants from Northern Europe in Minnesota is 0.14%.
What is the Percentage of Immigrants from Northern Europe in the United States?
Percentage of Immigrants from Northern Europe in the United States is 0.29%.