Cities with the Highest Percentage of Immigrants from Oceania in Maryland
RELATED REPORTS & OPTIONS
Oceania
Maryland
Compare Cities
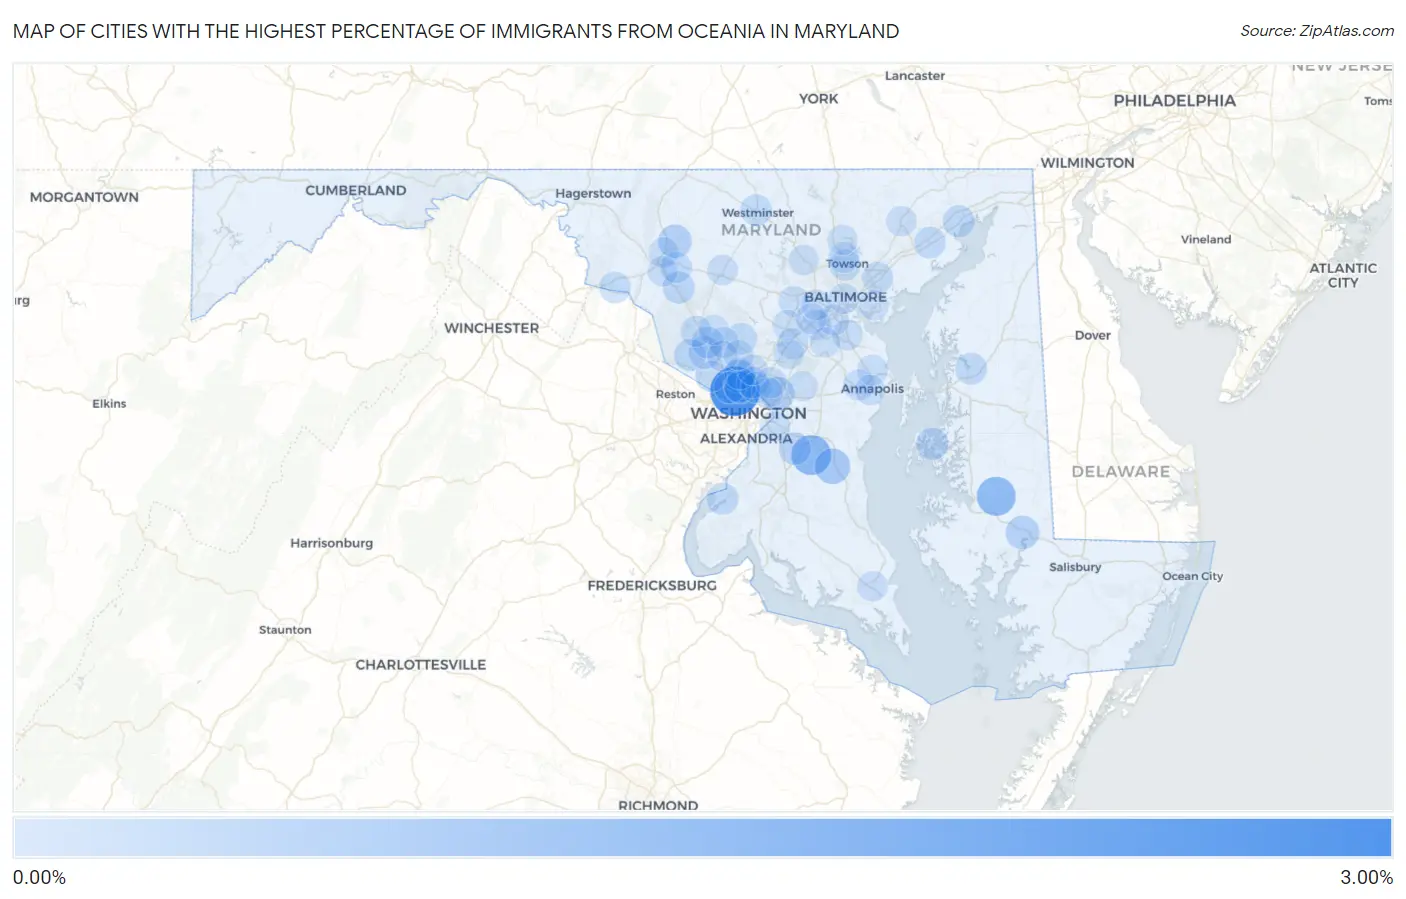
Map of Cities with the Highest Percentage of Immigrants from Oceania in Maryland
0.00%
3.00%
Cities with the Highest Percentage of Immigrants from Oceania in Maryland
| City | Oceania | vs State | vs National | |
| 1. | Somerset | 2.82% | 0.041%(+2.78)#-1 | 0.089%(+2.73)#0 |
| 2. | Croom | 1.37% | 0.041%(+1.33)#0 | 0.089%(+1.28)#1 |
| 3. | Secretary | 1.25% | 0.041%(+1.21)#1 | 0.089%(+1.16)#2 |
| 4. | Wildewood | 0.98% | 0.041%(+0.941)#2 | 0.089%(+0.893)#3 |
| 5. | Dunkirk | 0.75% | 0.041%(+0.706)#3 | 0.089%(+0.658)#4 |
| 6. | East Riverdale | 0.51% | 0.041%(+0.474)#4 | 0.089%(+0.426)#5 |
| 7. | Vienna | 0.49% | 0.041%(+0.452)#5 | 0.089%(+0.404)#6 |
| 8. | Walkersville | 0.46% | 0.041%(+0.424)#6 | 0.089%(+0.376)#7 |
| 9. | North Potomac | 0.34% | 0.041%(+0.304)#32 | 0.089%(+0.256)#178 |
| 10. | South Kensington | 0.32% | 0.041%(+0.282)#33 | 0.089%(+0.234)#179 |
| 11. | Rosaryville | 0.30% | 0.041%(+0.259)#34 | 0.089%(+0.211)#180 |
| 12. | Urbana | 0.28% | 0.041%(+0.244)#35 | 0.089%(+0.196)#181 |
| 13. | St Michaels | 0.26% | 0.041%(+0.222)#36 | 0.089%(+0.174)#182 |
| 14. | Chevy Chase Section Five | 0.25% | 0.041%(+0.211)#37 | 0.089%(+0.163)#183 |
| 15. | Havre De Grace | 0.25% | 0.041%(+0.210)#38 | 0.089%(+0.162)#184 |
| 16. | Darnestown | 0.24% | 0.041%(+0.199)#39 | 0.089%(+0.151)#185 |
| 17. | Centreville | 0.23% | 0.041%(+0.193)#40 | 0.089%(+0.145)#186 |
| 18. | Gaithersburg | 0.21% | 0.041%(+0.172)#41 | 0.089%(+0.124)#187 |
| 19. | Olney | 0.21% | 0.041%(+0.171)#42 | 0.089%(+0.123)#188 |
| 20. | Bethesda | 0.21% | 0.041%(+0.166)#43 | 0.089%(+0.118)#189 |
| 21. | Indian Head | 0.20% | 0.041%(+0.163)#44 | 0.089%(+0.115)#190 |
| 22. | Riverside | 0.20% | 0.041%(+0.162)#45 | 0.089%(+0.114)#191 |
| 23. | Chevy Chase Section Three | 0.19% | 0.041%(+0.154)#46 | 0.089%(+0.106)#192 |
| 24. | Brunswick | 0.19% | 0.041%(+0.152)#47 | 0.089%(+0.104)#193 |
| 25. | Silver Spring | 0.19% | 0.041%(+0.150)#48 | 0.089%(+0.102)#194 |
| 26. | Kensington | 0.18% | 0.041%(+0.138)#49 | 0.089%(+0.090)#195 |
| 27. | Westminster | 0.17% | 0.041%(+0.129)#50 | 0.089%(+0.081)#196 |
| 28. | Bartonsville | 0.17% | 0.041%(+0.128)#51 | 0.089%(+0.080)#197 |
| 29. | Rossville | 0.17% | 0.041%(+0.127)#52 | 0.089%(+0.079)#198 |
| 30. | North Laurel | 0.15% | 0.041%(+0.111)#53 | 0.089%(+0.063)#199 |
| 31. | Towson | 0.15% | 0.041%(+0.105)#54 | 0.089%(+0.057)#200 |
| 32. | Germantown | 0.13% | 0.041%(+0.086)#55 | 0.089%(+0.038)#201 |
| 33. | Takoma Park | 0.13% | 0.041%(+0.085)#56 | 0.089%(+0.037)#202 |
| 34. | Potomac | 0.11% | 0.041%(+0.067)#57 | 0.089%(+0.019)#203 |
| 35. | Parole | 0.097% | 0.041%(+0.057)#58 | 0.089%(+0.009)#204 |
| 36. | Arnold | 0.097% | 0.041%(+0.056)#59 | 0.089%(+0.008)#205 |
| 37. | College Park | 0.096% | 0.041%(+0.055)#60 | 0.089%(+0.007)#206 |
| 38. | Glen Burnie | 0.095% | 0.041%(+0.055)#61 | 0.089%(+0.007)#282 |
| 39. | Hyattsville | 0.077% | 0.041%(+0.036)#62 | 0.089%(-0.012)#283 |
| 40. | Redland | 0.076% | 0.041%(+0.036)#63 | 0.089%(-0.012)#284 |
| 41. | Rockville | 0.076% | 0.041%(+0.035)#64 | 0.089%(-0.013)#285 |
| 42. | Lutherville | 0.076% | 0.041%(+0.035)#65 | 0.089%(-0.013)#286 |
| 43. | Linthicum | 0.075% | 0.041%(+0.034)#66 | 0.089%(-0.014)#287 |
| 44. | Mount Airy | 0.072% | 0.041%(+0.032)#67 | 0.089%(-0.016)#288 |
| 45. | California | 0.059% | 0.041%(+0.018)#68 | 0.089%(-0.030)#289 |
| 46. | Ellicott City | 0.057% | 0.041%(+0.017)#69 | 0.089%(-0.032)#290 |
| 47. | Elkridge | 0.051% | 0.041%(+0.011)#70 | 0.089%(-0.037)#291 |
| 48. | Suitland | 0.050% | 0.041%(+0.010)#71 | 0.089%(-0.038)#292 |
| 49. | Kemp Mill | 0.050% | 0.041%(+0.009)#72 | 0.089%(-0.039)#293 |
| 50. | Frederick | 0.048% | 0.041%(+0.008)#73 | 0.089%(-0.040)#294 |
| 51. | Baltimore | 0.045% | 0.041%(+0.005)#74 | 0.089%(-0.043)#295 |
| 52. | Ilchester | 0.040% | 0.041%(-0.000)#75 | 0.089%(-0.048)#296 |
| 53. | Laurel | 0.037% | 0.041%(-0.003)#76 | 0.089%(-0.051)#297 |
| 54. | Owings Mills | 0.031% | 0.041%(-0.009)#77 | 0.089%(-0.057)#298 |
| 55. | Annapolis | 0.029% | 0.041%(-0.011)#78 | 0.089%(-0.059)#299 |
| 56. | Bel Air North | 0.029% | 0.041%(-0.012)#79 | 0.089%(-0.060)#300 |
| 57. | Flower Hill | 0.027% | 0.041%(-0.013)#80 | 0.089%(-0.061)#301 |
| 58. | Ballenger Creek | 0.025% | 0.041%(-0.016)#81 | 0.089%(-0.064)#302 |
| 59. | Severn | 0.023% | 0.041%(-0.018)#82 | 0.089%(-0.066)#303 |
| 60. | Cockeysville | 0.022% | 0.041%(-0.019)#83 | 0.089%(-0.067)#304 |
| 61. | Montgomery Village | 0.020% | 0.041%(-0.020)#84 | 0.089%(-0.068)#305 |
| 62. | Glenn Dale | 0.020% | 0.041%(-0.021)#85 | 0.089%(-0.069)#306 |
| 63. | Columbia | 0.018% | 0.041%(-0.023)#86 | 0.089%(-0.071)#307 |
| 64. | Dundalk | 0.014% | 0.041%(-0.027)#87 | 0.089%(-0.075)#308 |
| 65. | Aspen Hill | 0.013% | 0.041%(-0.028)#88 | 0.089%(-0.076)#309 |
| 66. | Catonsville | 0.012% | 0.041%(-0.029)#89 | 0.089%(-0.077)#310 |
Common Questions
What are the Top 10 Cities with the Highest Percentage of Immigrants from Oceania in Maryland?
Top 10 Cities with the Highest Percentage of Immigrants from Oceania in Maryland are:
#1
2.82%
#2
1.37%
#3
1.25%
#4
0.75%
#5
0.51%
#6
0.49%
#7
0.46%
#8
0.34%
#9
0.32%
#10
0.30%
What city has the Highest Percentage of Immigrants from Oceania in Maryland?
Somerset has the Highest Percentage of Immigrants from Oceania in Maryland with 2.82%.
What is the Percentage of Immigrants from Oceania in the State of Maryland?
Percentage of Immigrants from Oceania in Maryland is 0.041%.
What is the Percentage of Immigrants from Oceania in the United States?
Percentage of Immigrants from Oceania in the United States is 0.089%.