Cities with the Highest Percentage of Immigrants from Northern Europe in Massachusetts
RELATED REPORTS & OPTIONS
Northern Europe
Massachusetts
Compare Cities
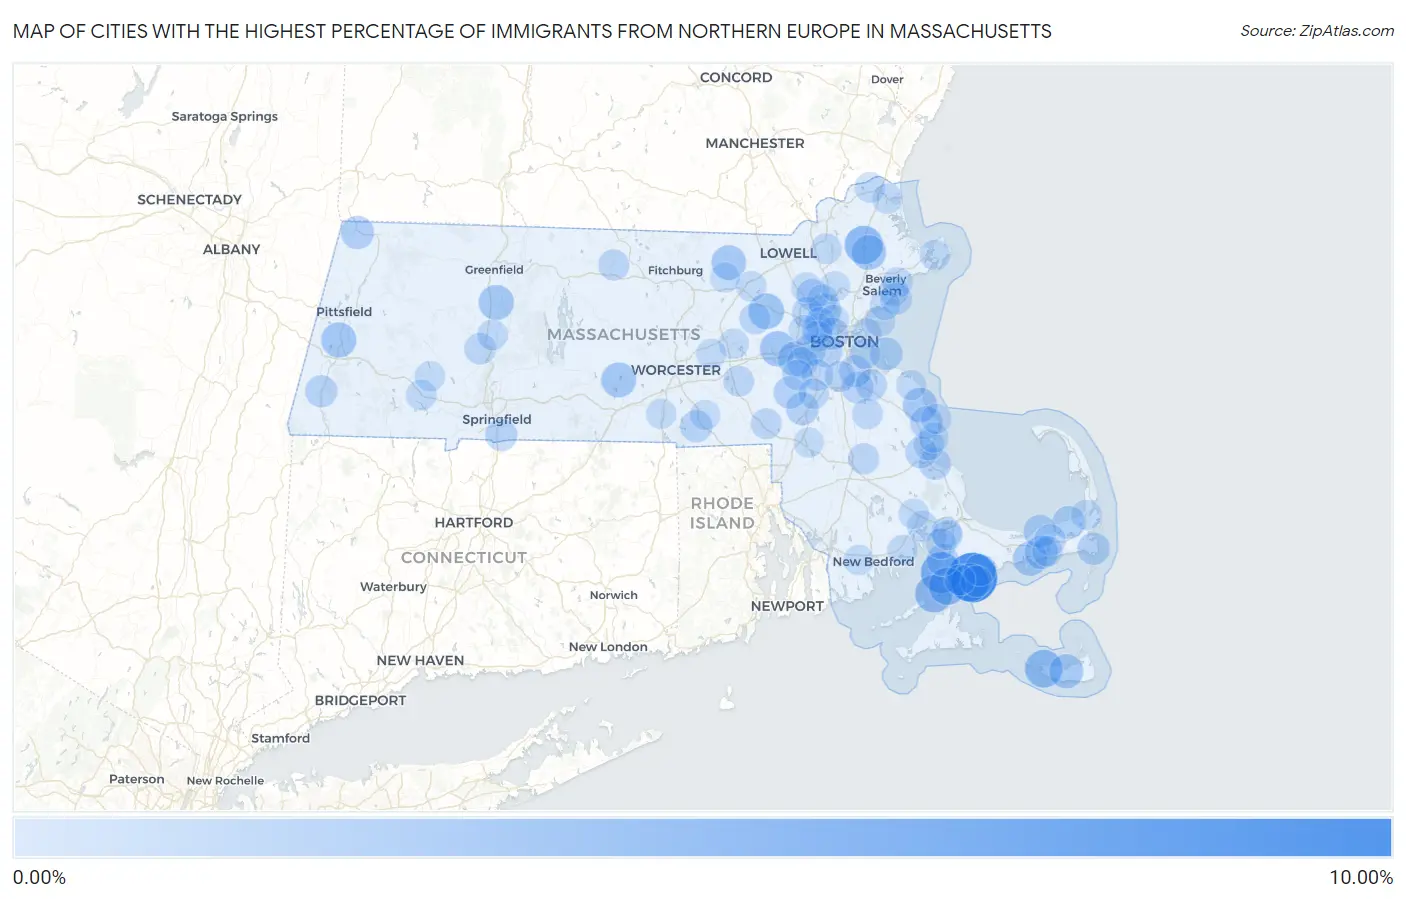
Map of Cities with the Highest Percentage of Immigrants from Northern Europe in Massachusetts
0.00%
10.00%
Cities with the Highest Percentage of Immigrants from Northern Europe in Massachusetts
| City | Northern Europe | vs State | vs National | |
| 1. | Seabrook | 9.92% | 0.62%(+9.30)#1 | 0.29%(+9.63)#32 |
| 2. | West Falmouth | 5.63% | 0.62%(+5.02)#2 | 0.29%(+5.35)#75 |
| 3. | Boxford | 4.42% | 0.62%(+3.81)#3 | 0.29%(+4.14)#125 |
| 4. | Seconsett Island | 4.38% | 0.62%(+3.76)#4 | 0.29%(+4.09)#128 |
| 5. | Madaket | 4.09% | 0.62%(+3.47)#5 | 0.29%(+3.80)#152 |
| 6. | Woods Hole | 4.03% | 0.62%(+3.42)#6 | 0.29%(+3.75)#157 |
| 7. | Falmouth | 3.94% | 0.62%(+3.32)#7 | 0.29%(+3.65)#163 |
| 8. | West Concord | 3.19% | 0.62%(+2.58)#8 | 0.29%(+2.91)#244 |
| 9. | Cochituate | 2.96% | 0.62%(+2.34)#9 | 0.29%(+2.67)#281 |
| 10. | Lenox | 2.90% | 0.62%(+2.29)#10 | 0.29%(+2.62)#290 |
| 11. | South Deerfield | 2.87% | 0.62%(+2.25)#11 | 0.29%(+2.58)#295 |
| 12. | East Brookfield | 2.75% | 0.62%(+2.14)#12 | 0.29%(+2.47)#328 |
| 13. | Topsfield | 2.72% | 0.62%(+2.10)#13 | 0.29%(+2.43)#340 |
| 14. | Groton | 2.65% | 0.62%(+2.03)#14 | 0.29%(+2.36)#352 |
| 15. | Marshfield Hills | 2.64% | 0.62%(+2.03)#15 | 0.29%(+2.36)#355 |
| 16. | Wellesley | 2.59% | 0.62%(+1.97)#16 | 0.29%(+2.30)#372 |
| 17. | West Yarmouth | 2.46% | 0.62%(+1.84)#17 | 0.29%(+2.17)#396 |
| 18. | Nantucket | 2.40% | 0.62%(+1.79)#18 | 0.29%(+2.12)#408 |
| 19. | South Yarmouth | 2.12% | 0.62%(+1.50)#19 | 0.29%(+1.83)#482 |
| 20. | Williamstown | 1.93% | 0.62%(+1.32)#20 | 0.29%(+1.65)#567 |
| 21. | Brewster | 1.90% | 0.62%(+1.28)#21 | 0.29%(+1.61)#583 |
| 22. | Dennis | 1.90% | 0.62%(+1.28)#22 | 0.29%(+1.61)#584 |
| 23. | Winchester | 1.82% | 0.62%(+1.20)#23 | 0.29%(+1.53)#616 |
| 24. | Hull | 1.78% | 0.62%(+1.16)#24 | 0.29%(+1.49)#639 |
| 25. | Walpole | 1.73% | 0.62%(+1.11)#25 | 0.29%(+1.44)#667 |
| 26. | Medfield | 1.69% | 0.62%(+1.08)#26 | 0.29%(+1.41)#686 |
| 27. | Chatham | 1.65% | 0.62%(+1.03)#27 | 0.29%(+1.36)#712 |
| 28. | Brookline | 1.63% | 0.62%(+1.02)#28 | 0.29%(+1.35)#726 |
| 29. | Marshfield | 1.62% | 0.62%(+1.01)#29 | 0.29%(+1.34)#732 |
| 30. | Cambridge | 1.55% | 0.62%(+0.931)#30 | 0.29%(+1.26)#784 |
| 31. | East Douglas | 1.52% | 0.62%(+0.907)#31 | 0.29%(+1.24)#806 |
| 32. | Plymouth | 1.52% | 0.62%(+0.901)#32 | 0.29%(+1.23)#811 |
| 33. | Longmeadow | 1.50% | 0.62%(+0.886)#33 | 0.29%(+1.22)#827 |
| 34. | Mashpee Neck | 1.50% | 0.62%(+0.881)#34 | 0.29%(+1.21)#828 |
| 35. | Great Barrington | 1.48% | 0.62%(+0.866)#35 | 0.29%(+1.20)#837 |
| 36. | North Falmouth | 1.42% | 0.62%(+0.808)#36 | 0.29%(+1.14)#889 |
| 37. | Burlington | 1.42% | 0.62%(+0.802)#37 | 0.29%(+1.13)#892 |
| 38. | Quincy | 1.41% | 0.62%(+0.796)#38 | 0.29%(+1.13)#897 |
| 39. | Braintree Town | 1.40% | 0.62%(+0.789)#39 | 0.29%(+1.12)#903 |
| 40. | Newton | 1.40% | 0.62%(+0.785)#40 | 0.29%(+1.12)#908 |
| 41. | Kingston | 1.31% | 0.62%(+0.698)#41 | 0.29%(+1.03)#998 |
| 42. | Marblehead | 1.24% | 0.62%(+0.623)#42 | 0.29%(+0.953)#1,082 |
| 43. | Northampton | 1.24% | 0.62%(+0.620)#43 | 0.29%(+0.950)#1,085 |
| 44. | Weymouth Town | 1.23% | 0.62%(+0.618)#44 | 0.29%(+0.948)#1,091 |
| 45. | South Dennis | 1.23% | 0.62%(+0.610)#45 | 0.29%(+0.940)#1,102 |
| 46. | Lexington | 1.15% | 0.62%(+0.533)#46 | 0.29%(+0.863)#1,210 |
| 47. | Dedham | 1.10% | 0.62%(+0.482)#47 | 0.29%(+0.812)#1,284 |
| 48. | New Seabury | 1.08% | 0.62%(+0.469)#48 | 0.29%(+0.799)#1,311 |
| 49. | Milton | 1.06% | 0.62%(+0.443)#49 | 0.29%(+0.773)#1,361 |
| 50. | Maynard | 1.04% | 0.62%(+0.425)#50 | 0.29%(+0.755)#1,393 |
| 51. | Needham | 1.03% | 0.62%(+0.417)#51 | 0.29%(+0.747)#1,404 |
| 52. | Bridgewater Town | 1.03% | 0.62%(+0.415)#52 | 0.29%(+0.745)#1,411 |
| 53. | Baldwinville | 1.01% | 0.62%(+0.391)#53 | 0.29%(+0.721)#1,459 |
| 54. | Woburn | 0.93% | 0.62%(+0.312)#54 | 0.29%(+0.642)#1,624 |
| 55. | Franklin Town | 0.92% | 0.62%(+0.303)#55 | 0.29%(+0.633)#1,643 |
| 56. | Hopkinton | 0.91% | 0.62%(+0.294)#56 | 0.29%(+0.624)#1,663 |
| 57. | Belmont | 0.89% | 0.62%(+0.277)#57 | 0.29%(+0.607)#1,702 |
| 58. | Winthrop Town | 0.88% | 0.62%(+0.262)#58 | 0.29%(+0.592)#1,734 |
| 59. | Gloucester | 0.87% | 0.62%(+0.253)#59 | 0.29%(+0.583)#1,760 |
| 60. | Wareham Center | 0.87% | 0.62%(+0.251)#60 | 0.29%(+0.581)#1,766 |
| 61. | Blandford | 0.86% | 0.62%(+0.244)#61 | 0.29%(+0.574)#1,792 |
| 62. | West Dennis | 0.84% | 0.62%(+0.226)#62 | 0.29%(+0.556)#1,847 |
| 63. | Bourne | 0.84% | 0.62%(+0.226)#63 | 0.29%(+0.556)#1,848 |
| 64. | Hatfield | 0.83% | 0.62%(+0.211)#64 | 0.29%(+0.541)#1,886 |
| 65. | East Falmouth | 0.82% | 0.62%(+0.208)#65 | 0.29%(+0.538)#1,896 |
| 66. | Abington | 0.82% | 0.62%(+0.208)#66 | 0.29%(+0.538)#1,897 |
| 67. | Arlington | 0.82% | 0.62%(+0.204)#67 | 0.29%(+0.534)#1,910 |
| 68. | Andover | 0.81% | 0.62%(+0.191)#68 | 0.29%(+0.521)#1,942 |
| 69. | Dover | 0.80% | 0.62%(+0.181)#69 | 0.29%(+0.511)#1,971 |
| 70. | Beverly | 0.79% | 0.62%(+0.174)#70 | 0.29%(+0.504)#1,992 |
| 71. | Amesbury Town | 0.78% | 0.62%(+0.160)#71 | 0.29%(+0.490)#2,036 |
| 72. | Norwood | 0.77% | 0.62%(+0.150)#72 | 0.29%(+0.480)#2,055 |
| 73. | South Duxbury | 0.76% | 0.62%(+0.147)#73 | 0.29%(+0.477)#2,065 |
| 74. | Pocasset | 0.76% | 0.62%(+0.146)#74 | 0.29%(+0.476)#2,071 |
| 75. | Boston | 0.76% | 0.62%(+0.142)#75 | 0.29%(+0.472)#2,083 |
| 76. | Orleans | 0.72% | 0.62%(+0.105)#76 | 0.29%(+0.435)#2,191 |
| 77. | Nahant | 0.72% | 0.62%(+0.104)#77 | 0.29%(+0.434)#2,200 |
| 78. | Mattapoisett Center | 0.72% | 0.62%(+0.103)#78 | 0.29%(+0.433)#2,202 |
| 79. | Watertown Town | 0.71% | 0.62%(+0.092)#79 | 0.29%(+0.422)#2,231 |
| 80. | Newburyport | 0.70% | 0.62%(+0.087)#80 | 0.29%(+0.417)#2,245 |
| 81. | Littleton Common | 0.70% | 0.62%(+0.081)#81 | 0.29%(+0.411)#2,265 |
| 82. | Marlborough | 0.70% | 0.62%(+0.080)#82 | 0.29%(+0.410)#2,270 |
| 83. | Huntington | 0.69% | 0.62%(+0.078)#83 | 0.29%(+0.408)#2,280 |
| 84. | West Wareham | 0.69% | 0.62%(+0.076)#84 | 0.29%(+0.406)#2,290 |
| 85. | Medford | 0.67% | 0.62%(+0.055)#85 | 0.29%(+0.385)#2,365 |
| 86. | Monument Beach | 0.66% | 0.62%(+0.046)#86 | 0.29%(+0.376)#2,400 |
| 87. | Smith Mills | 0.66% | 0.62%(+0.043)#87 | 0.29%(+0.373)#2,414 |
| 88. | Reading | 0.66% | 0.62%(+0.042)#88 | 0.29%(+0.372)#2,419 |
| 89. | Mansfield Center | 0.65% | 0.62%(+0.035)#89 | 0.29%(+0.365)#2,439 |
| 90. | Pinehurst | 0.64% | 0.62%(+0.023)#90 | 0.29%(+0.353)#2,483 |
| 91. | North Scituate | 0.63% | 0.62%(+0.019)#91 | 0.29%(+0.349)#2,493 |
| 92. | Oxford | 0.63% | 0.62%(+0.013)#92 | 0.29%(+0.343)#2,517 |
| 93. | Duxbury | 0.62% | 0.62%(+0.009)#93 | 0.29%(+0.339)#2,539 |
| 94. | Waltham | 0.61% | 0.62%(-0.008)#94 | 0.29%(+0.322)#2,612 |
| 95. | Ayer | 0.61% | 0.62%(-0.009)#95 | 0.29%(+0.321)#2,621 |
| 96. | Whitinsville | 0.60% | 0.62%(-0.010)#96 | 0.29%(+0.320)#2,628 |
| 97. | Ocean Bluff Brant Rock | 0.60% | 0.62%(-0.012)#97 | 0.29%(+0.318)#2,632 |
| 98. | Northborough | 0.60% | 0.62%(-0.016)#98 | 0.29%(+0.314)#2,645 |
| 99. | Salem | 0.60% | 0.62%(-0.018)#99 | 0.29%(+0.312)#2,657 |
| 100. | Swampscott | 0.59% | 0.62%(-0.027)#100 | 0.29%(+0.303)#2,701 |
Common Questions
What are the Top 10 Cities with the Highest Percentage of Immigrants from Northern Europe in Massachusetts?
Top 10 Cities with the Highest Percentage of Immigrants from Northern Europe in Massachusetts are:
#1
9.92%
#2
5.63%
#3
4.42%
#4
4.38%
#5
4.09%
#6
4.03%
#7
3.94%
#8
3.19%
#9
2.96%
#10
2.90%
What city has the Highest Percentage of Immigrants from Northern Europe in Massachusetts?
Seabrook has the Highest Percentage of Immigrants from Northern Europe in Massachusetts with 9.92%.
What is the Percentage of Immigrants from Northern Europe in the State of Massachusetts?
Percentage of Immigrants from Northern Europe in Massachusetts is 0.62%.
What is the Percentage of Immigrants from Northern Europe in the United States?
Percentage of Immigrants from Northern Europe in the United States is 0.29%.