Cities with the Highest Percentage of Guatemalan Population in Maryland
RELATED REPORTS & OPTIONS
Guatemalan
Maryland
Compare Cities
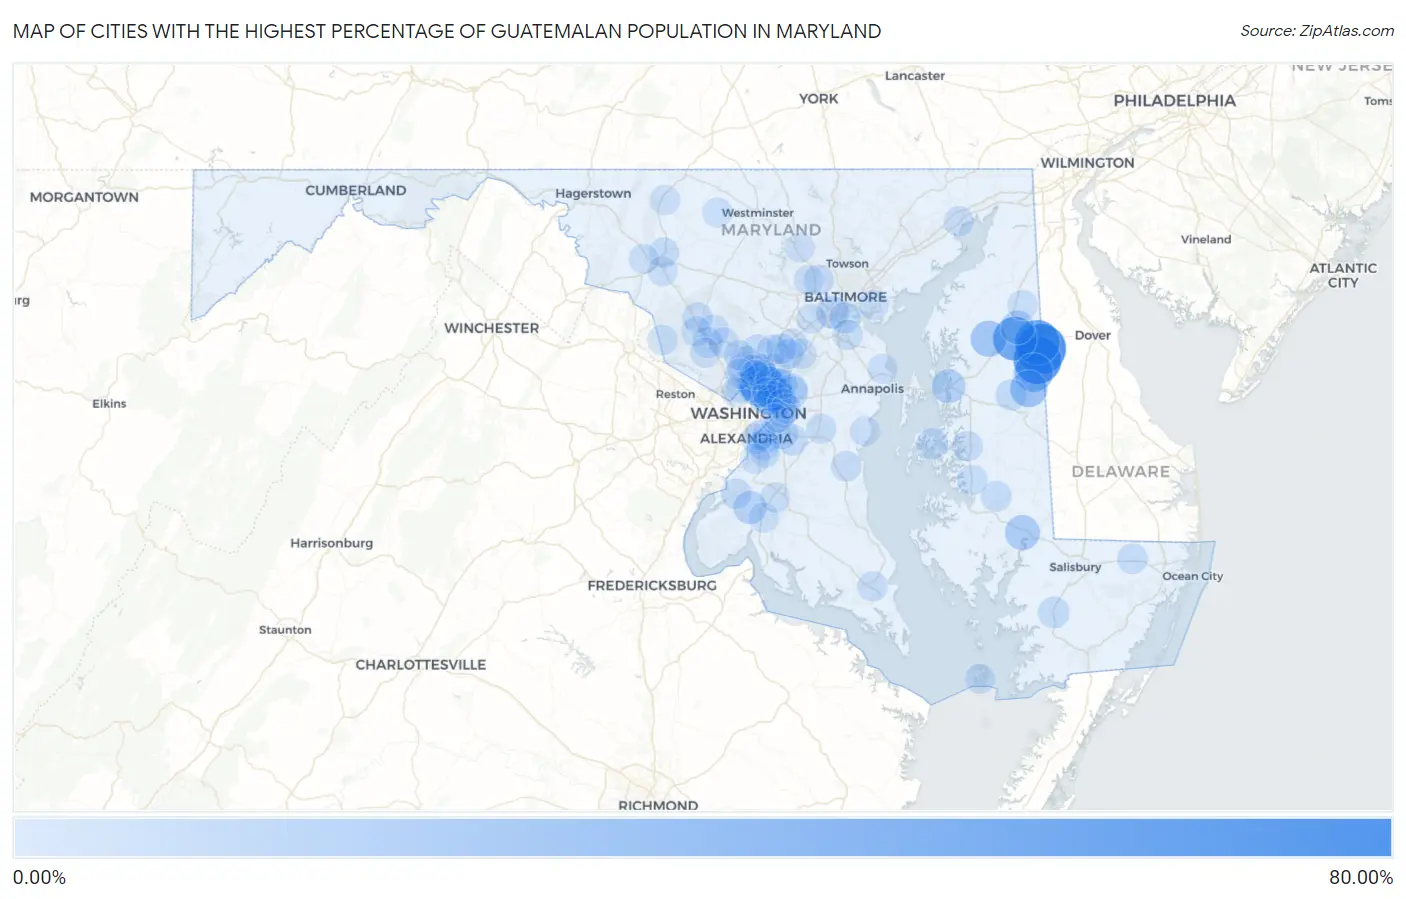
Map of Cities with the Highest Percentage of Guatemalan Population in Maryland
0.00%
80.00%
Cities with the Highest Percentage of Guatemalan Population in Maryland
| City | Guatemalan | vs State | vs National | |
| 1. | Marydel | 61.24% | 1.04%(+60.2)#1 | 0.50%(+60.7)#2 |
| 2. | Henderson | 55.70% | 1.04%(+54.7)#2 | 0.50%(+55.2)#5 |
| 3. | Templeville | 46.15% | 1.04%(+45.1)#3 | 0.50%(+45.6)#7 |
| 4. | Barclay | 43.43% | 1.04%(+42.4)#4 | 0.50%(+42.9)#8 |
| 5. | Langley Park | 43.14% | 1.04%(+42.1)#5 | 0.50%(+42.6)#9 |
| 6. | Goldsboro | 27.49% | 1.04%(+26.4)#6 | 0.50%(+27.0)#23 |
| 7. | Greensboro | 21.62% | 1.04%(+20.6)#7 | 0.50%(+21.1)#37 |
| 8. | Church Hill | 18.91% | 1.04%(+17.9)#8 | 0.50%(+18.4)#47 |
| 9. | Vienna | 15.27% | 1.04%(+14.2)#9 | 0.50%(+14.8)#67 |
| 10. | Burnt Mills | 12.72% | 1.04%(+11.7)#10 | 0.50%(+12.2)#90 |
| 11. | Riverdale Park | 12.45% | 1.04%(+11.4)#11 | 0.50%(+11.9)#93 |
| 12. | Queenstown | 11.90% | 1.04%(+10.9)#12 | 0.50%(+11.4)#98 |
| 13. | Sudlersville | 11.87% | 1.04%(+10.8)#13 | 0.50%(+11.4)#100 |
| 14. | Adelphi | 11.47% | 1.04%(+10.4)#14 | 0.50%(+11.0)#105 |
| 15. | Pomfret | 9.97% | 1.04%(+8.93)#15 | 0.50%(+9.47)#132 |
| 16. | Lansdowne | 8.59% | 1.04%(+7.55)#16 | 0.50%(+8.09)#159 |
| 17. | Landover Hills | 7.65% | 1.04%(+6.61)#17 | 0.50%(+7.14)#181 |
| 18. | Brentwood | 6.27% | 1.04%(+5.23)#18 | 0.50%(+5.76)#245 |
| 19. | Beltsville | 6.23% | 1.04%(+5.19)#19 | 0.50%(+5.73)#248 |
| 20. | Silver Spring | 6.16% | 1.04%(+5.12)#20 | 0.50%(+5.65)#253 |
| 21. | Lanham | 5.56% | 1.04%(+4.52)#21 | 0.50%(+5.05)#289 |
| 22. | East Riverdale | 5.28% | 1.04%(+4.24)#22 | 0.50%(+4.77)#305 |
| 23. | Mount Rainier | 5.20% | 1.04%(+4.17)#23 | 0.50%(+4.70)#310 |
| 24. | Princess Anne | 5.15% | 1.04%(+4.11)#24 | 0.50%(+4.64)#315 |
| 25. | Brooklyn Park | 4.57% | 1.04%(+3.53)#25 | 0.50%(+4.06)#362 |
| 26. | Chillum | 4.53% | 1.04%(+3.49)#26 | 0.50%(+4.02)#368 |
| 27. | Ridgely | 4.40% | 1.04%(+3.36)#27 | 0.50%(+3.90)#376 |
| 28. | Berwyn Heights | 4.32% | 1.04%(+3.28)#28 | 0.50%(+3.81)#386 |
| 29. | St Michaels | 4.20% | 1.04%(+3.16)#29 | 0.50%(+3.70)#403 |
| 30. | Takoma Park | 4.06% | 1.04%(+3.02)#30 | 0.50%(+3.55)#425 |
| 31. | Melwood | 3.84% | 1.04%(+2.80)#31 | 0.50%(+3.34)#445 |
| 32. | Cloverly | 3.67% | 1.04%(+2.64)#32 | 0.50%(+3.17)#463 |
| 33. | Morningside | 3.48% | 1.04%(+2.44)#33 | 0.50%(+2.97)#498 |
| 34. | Oxon Hill | 3.28% | 1.04%(+2.24)#34 | 0.50%(+2.78)#520 |
| 35. | College Park | 3.24% | 1.04%(+2.20)#35 | 0.50%(+2.74)#526 |
| 36. | Wheaton | 2.99% | 1.04%(+1.95)#36 | 0.50%(+2.49)#567 |
| 37. | Edmonston | 2.97% | 1.04%(+1.93)#37 | 0.50%(+2.47)#573 |
| 38. | Secretary | 2.96% | 1.04%(+1.92)#38 | 0.50%(+2.46)#576 |
| 39. | Temple Hills | 2.85% | 1.04%(+1.81)#39 | 0.50%(+2.35)#602 |
| 40. | Burtonsville | 2.80% | 1.04%(+1.76)#40 | 0.50%(+2.30)#622 |
| 41. | Flower Hill | 2.70% | 1.04%(+1.66)#41 | 0.50%(+2.20)#646 |
| 42. | Gaithersburg | 2.63% | 1.04%(+1.59)#42 | 0.50%(+2.13)#661 |
| 43. | Hillandale | 2.62% | 1.04%(+1.58)#43 | 0.50%(+2.11)#663 |
| 44. | Bryans Road | 2.53% | 1.04%(+1.49)#44 | 0.50%(+2.02)#696 |
| 45. | Forest Heights | 2.46% | 1.04%(+1.42)#45 | 0.50%(+1.96)#714 |
| 46. | Easton | 2.45% | 1.04%(+1.41)#46 | 0.50%(+1.95)#717 |
| 47. | Frederick | 2.41% | 1.04%(+1.37)#47 | 0.50%(+1.91)#725 |
| 48. | Willards | 2.41% | 1.04%(+1.37)#48 | 0.50%(+1.91)#726 |
| 49. | Glenmont | 2.38% | 1.04%(+1.34)#49 | 0.50%(+1.88)#734 |
| 50. | Owings | 2.36% | 1.04%(+1.32)#50 | 0.50%(+1.85)#740 |
| 51. | Montgomery Village | 2.35% | 1.04%(+1.31)#51 | 0.50%(+1.84)#743 |
| 52. | Maryland City | 2.32% | 1.04%(+1.28)#52 | 0.50%(+1.82)#748 |
| 53. | Martin S Additions | 2.32% | 1.04%(+1.28)#53 | 0.50%(+1.81)#751 |
| 54. | White Oak | 2.23% | 1.04%(+1.19)#54 | 0.50%(+1.73)#778 |
| 55. | Glassmanor | 2.23% | 1.04%(+1.19)#55 | 0.50%(+1.73)#780 |
| 56. | Redland | 2.22% | 1.04%(+1.18)#56 | 0.50%(+1.71)#784 |
| 57. | North Laurel | 2.21% | 1.04%(+1.17)#57 | 0.50%(+1.71)#785 |
| 58. | Clarksburg | 2.15% | 1.04%(+1.11)#58 | 0.50%(+1.64)#799 |
| 59. | Kemp Mill | 2.11% | 1.04%(+1.07)#59 | 0.50%(+1.61)#808 |
| 60. | Laurel | 2.10% | 1.04%(+1.06)#60 | 0.50%(+1.60)#814 |
| 61. | Glen Burnie | 2.08% | 1.04%(+1.04)#61 | 0.50%(+1.58)#818 |
| 62. | California | 2.03% | 1.04%(+0.992)#62 | 0.50%(+1.53)#832 |
| 63. | West Laurel | 2.03% | 1.04%(+0.992)#63 | 0.50%(+1.53)#833 |
| 64. | Aspen Hill | 1.95% | 1.04%(+0.914)#64 | 0.50%(+1.45)#864 |
| 65. | Poolesville | 1.86% | 1.04%(+0.825)#65 | 0.50%(+1.36)#890 |
| 66. | Capitol Heights | 1.74% | 1.04%(+0.696)#66 | 0.50%(+1.23)#953 |
| 67. | Peppermill Village | 1.65% | 1.04%(+0.612)#67 | 0.50%(+1.15)#995 |
| 68. | Cottage City | 1.61% | 1.04%(+0.575)#68 | 0.50%(+1.11)#1,009 |
| 69. | Millington | 1.61% | 1.04%(+0.566)#69 | 0.50%(+1.10)#1,014 |
| 70. | Woodlawn Cdp Prince George S County | 1.60% | 1.04%(+0.558)#70 | 0.50%(+1.09)#1,019 |
| 71. | Hyattsville | 1.58% | 1.04%(+0.539)#71 | 0.50%(+1.07)#1,025 |
| 72. | Kensington | 1.47% | 1.04%(+0.433)#72 | 0.50%(+0.968)#1,095 |
| 73. | Trappe | 1.47% | 1.04%(+0.433)#73 | 0.50%(+0.968)#1,097 |
| 74. | Friendly | 1.47% | 1.04%(+0.427)#74 | 0.50%(+0.962)#1,106 |
| 75. | Landover | 1.46% | 1.04%(+0.418)#75 | 0.50%(+0.953)#1,112 |
| 76. | Havre De Grace | 1.44% | 1.04%(+0.406)#76 | 0.50%(+0.941)#1,121 |
| 77. | Summerfield | 1.44% | 1.04%(+0.404)#77 | 0.50%(+0.939)#1,122 |
| 78. | Marlboro Meadows | 1.44% | 1.04%(+0.398)#78 | 0.50%(+0.933)#1,127 |
| 79. | Greenbelt | 1.42% | 1.04%(+0.377)#79 | 0.50%(+0.912)#1,138 |
| 80. | Germantown | 1.40% | 1.04%(+0.361)#80 | 0.50%(+0.896)#1,150 |
| 81. | Lochearn | 1.37% | 1.04%(+0.331)#81 | 0.50%(+0.866)#1,171 |
| 82. | Union Bridge | 1.17% | 1.04%(+0.132)#82 | 0.50%(+0.667)#1,331 |
| 83. | Ilchester | 1.14% | 1.04%(+0.100)#83 | 0.50%(+0.635)#1,366 |
| 84. | Coral Hills | 1.13% | 1.04%(+0.087)#84 | 0.50%(+0.622)#1,375 |
| 85. | Seabrook | 1.07% | 1.04%(+0.035)#85 | 0.50%(+0.570)#1,428 |
| 86. | Shady Side | 1.03% | 1.04%(-0.011)#86 | 0.50%(+0.524)#1,477 |
| 87. | Fort Washington | 1.01% | 1.04%(-0.025)#87 | 0.50%(+0.510)#1,495 |
| 88. | La Plata | 1.01% | 1.04%(-0.028)#88 | 0.50%(+0.507)#1,496 |
| 89. | Braddock Heights | 0.98% | 1.04%(-0.059)#89 | 0.50%(+0.476)#1,526 |
| 90. | Reisterstown | 0.98% | 1.04%(-0.062)#90 | 0.50%(+0.474)#1,529 |
| 91. | Thurmont | 0.97% | 1.04%(-0.073)#91 | 0.50%(+0.462)#1,541 |
| 92. | Waldorf | 0.95% | 1.04%(-0.092)#92 | 0.50%(+0.443)#1,565 |
| 93. | Four Corners | 0.93% | 1.04%(-0.112)#93 | 0.50%(+0.423)#1,588 |
| 94. | Ballenger Creek | 0.92% | 1.04%(-0.118)#94 | 0.50%(+0.417)#1,596 |
| 95. | Milford Mill | 0.90% | 1.04%(-0.135)#95 | 0.50%(+0.400)#1,613 |
| 96. | Dundalk | 0.88% | 1.04%(-0.157)#96 | 0.50%(+0.378)#1,638 |
| 97. | Cape St Claire | 0.88% | 1.04%(-0.160)#97 | 0.50%(+0.375)#1,644 |
| 98. | North Potomac | 0.87% | 1.04%(-0.173)#98 | 0.50%(+0.363)#1,662 |
| 99. | Friendship Heights Village | 0.86% | 1.04%(-0.182)#99 | 0.50%(+0.353)#1,680 |
| 100. | Smith Island | 0.84% | 1.04%(-0.199)#100 | 0.50%(+0.336)#1,707 |
Common Questions
What are the Top 10 Cities with the Highest Percentage of Guatemalan Population in Maryland?
Top 10 Cities with the Highest Percentage of Guatemalan Population in Maryland are:
#1
61.24%
#2
55.70%
#3
46.15%
#4
43.43%
#5
43.14%
#6
27.49%
#7
21.62%
#8
18.91%
#9
15.27%
#10
12.45%
What city has the Highest Percentage of Guatemalan Population in Maryland?
Marydel has the Highest Percentage of Guatemalan Population in Maryland with 61.24%.
What is the Percentage of Guatemalan Population in the State of Maryland?
Percentage of Guatemalan Population in Maryland is 1.04%.
What is the Percentage of Guatemalan Population in the United States?
Percentage of Guatemalan Population in the United States is 0.50%.