Cities with the Highest Percentage of Immigrants from Northern Europe in South Carolina
RELATED REPORTS & OPTIONS
Northern Europe
South Carolina
Compare Cities
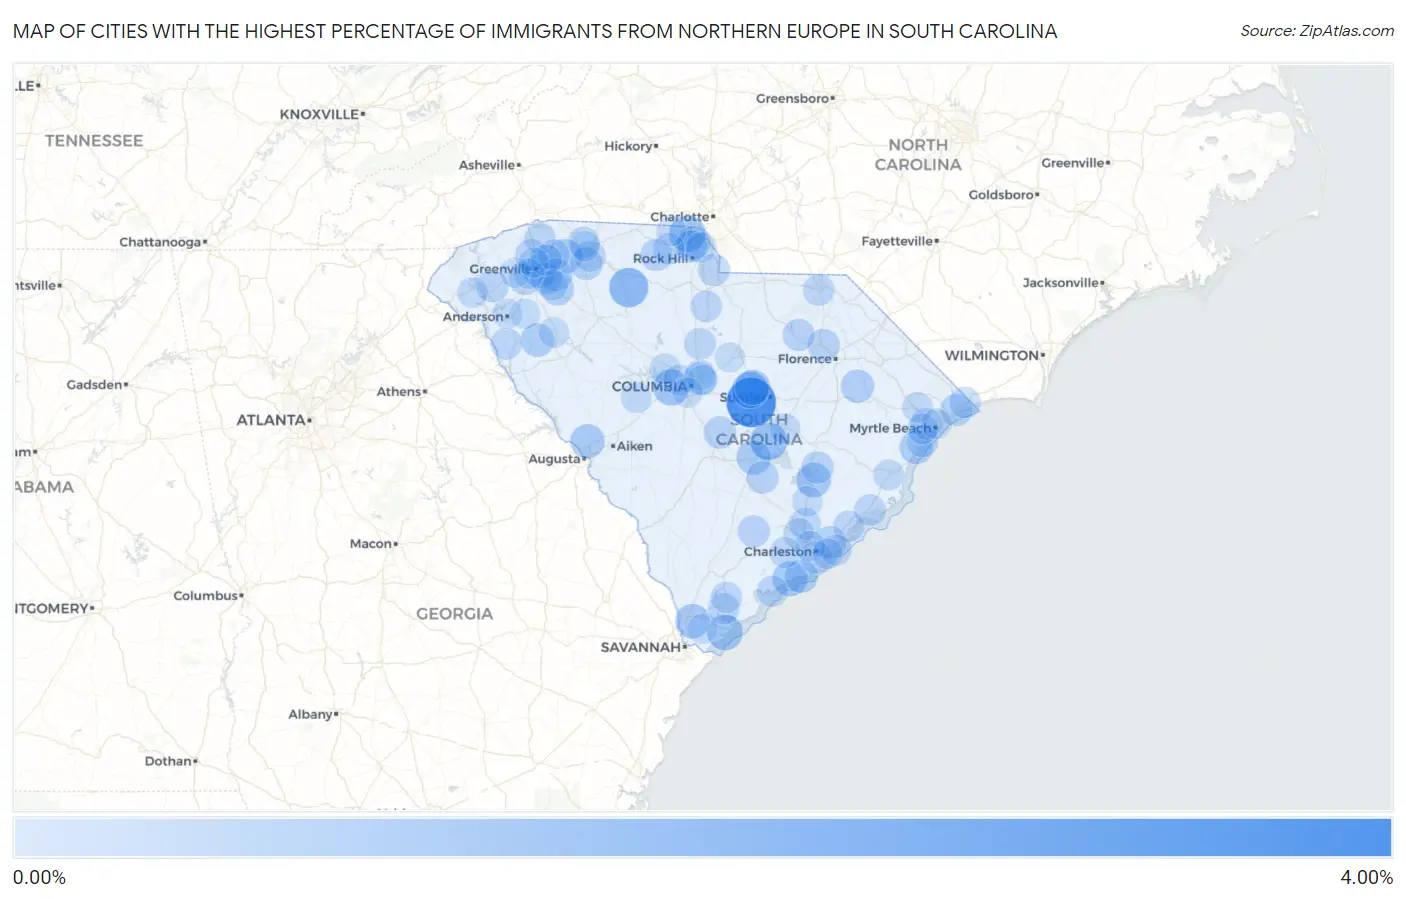
Map of Cities with the Highest Percentage of Immigrants from Northern Europe in South Carolina
0.00%
4.00%
Cities with the Highest Percentage of Immigrants from Northern Europe in South Carolina
| City | Northern Europe | vs State | vs National | |
| 1. | Wedgefield | 3.27% | 0.23%(+3.03)#1 | 0.29%(+2.98)#234 |
| 2. | The Cliffs Valley | 3.09% | 0.23%(+2.85)#2 | 0.29%(+2.80)#263 |
| 3. | Ben Avon | 1.94% | 0.23%(+1.71)#3 | 0.29%(+1.66)#565 |
| 4. | Monarch Mill | 1.59% | 0.23%(+1.35)#4 | 0.29%(+1.30)#763 |
| 5. | Harbor Island | 1.44% | 0.23%(+1.21)#5 | 0.29%(+1.16)#872 |
| 6. | Summerton | 1.26% | 0.23%(+1.03)#6 | 0.29%(+0.975)#1,062 |
| 7. | Daufuskie Island | 1.23% | 0.23%(+0.996)#7 | 0.29%(+0.945)#1,095 |
| 8. | Stateburg | 1.15% | 0.23%(+0.916)#8 | 0.29%(+0.865)#1,206 |
| 9. | Lake Wylie | 1.15% | 0.23%(+0.913)#9 | 0.29%(+0.862)#1,211 |
| 10. | Lexington | 1.09% | 0.23%(+0.852)#10 | 0.29%(+0.801)#1,305 |
| 11. | Hilton Head Island | 1.02% | 0.23%(+0.787)#11 | 0.29%(+0.736)#1,435 |
| 12. | Oakland | 0.94% | 0.23%(+0.705)#12 | 0.29%(+0.654)#1,608 |
| 13. | Seabrook Island | 0.92% | 0.23%(+0.687)#13 | 0.29%(+0.636)#1,636 |
| 14. | Capitol View | 0.92% | 0.23%(+0.683)#14 | 0.29%(+0.631)#1,645 |
| 15. | Duncan | 0.86% | 0.23%(+0.629)#15 | 0.29%(+0.578)#1,781 |
| 16. | Bonneau | 0.86% | 0.23%(+0.625)#16 | 0.29%(+0.574)#1,797 |
| 17. | Hardeeville | 0.84% | 0.23%(+0.611)#17 | 0.29%(+0.560)#1,834 |
| 18. | Santee | 0.84% | 0.23%(+0.607)#18 | 0.29%(+0.556)#1,849 |
| 19. | Murphys Estates | 0.81% | 0.23%(+0.578)#19 | 0.29%(+0.527)#1,929 |
| 20. | Due West | 0.70% | 0.23%(+0.463)#20 | 0.29%(+0.411)#2,266 |
| 21. | Litchfield Beach | 0.67% | 0.23%(+0.439)#21 | 0.29%(+0.388)#2,350 |
| 22. | Murrells Inlet | 0.66% | 0.23%(+0.426)#22 | 0.29%(+0.375)#2,405 |
| 23. | Kiawah Island | 0.66% | 0.23%(+0.423)#23 | 0.29%(+0.372)#2,417 |
| 24. | Greenville | 0.66% | 0.23%(+0.422)#24 | 0.29%(+0.371)#2,421 |
| 25. | Fountain Inn | 0.66% | 0.23%(+0.422)#25 | 0.29%(+0.370)#2,423 |
| 26. | Pamplico | 0.65% | 0.23%(+0.418)#26 | 0.29%(+0.367)#2,432 |
| 27. | Tega Cay | 0.65% | 0.23%(+0.414)#27 | 0.29%(+0.362)#2,452 |
| 28. | Arcadia Lakes | 0.57% | 0.23%(+0.340)#28 | 0.29%(+0.289)#2,777 |
| 29. | Five Forks | 0.57% | 0.23%(+0.336)#29 | 0.29%(+0.285)#2,798 |
| 30. | Mount Pleasant | 0.57% | 0.23%(+0.334)#30 | 0.29%(+0.283)#2,805 |
| 31. | Roebuck | 0.55% | 0.23%(+0.313)#31 | 0.29%(+0.262)#2,913 |
| 32. | St Matthews | 0.52% | 0.23%(+0.284)#32 | 0.29%(+0.232)#3,063 |
| 33. | Holly Hill | 0.51% | 0.23%(+0.272)#33 | 0.29%(+0.220)#3,110 |
| 34. | Powdersville | 0.51% | 0.23%(+0.272)#34 | 0.29%(+0.220)#3,111 |
| 35. | St Stephen | 0.51% | 0.23%(+0.271)#35 | 0.29%(+0.220)#3,114 |
| 36. | Darlington | 0.50% | 0.23%(+0.268)#36 | 0.29%(+0.217)#3,128 |
| 37. | Keowee Key | 0.49% | 0.23%(+0.256)#37 | 0.29%(+0.205)#3,196 |
| 38. | Sharon | 0.49% | 0.23%(+0.253)#38 | 0.29%(+0.201)#3,218 |
| 39. | North Myrtle Beach | 0.48% | 0.23%(+0.249)#39 | 0.29%(+0.197)#3,238 |
| 40. | Hartsville | 0.47% | 0.23%(+0.236)#40 | 0.29%(+0.184)#3,313 |
| 41. | Van Wyck | 0.46% | 0.23%(+0.224)#41 | 0.29%(+0.173)#3,378 |
| 42. | India Hook | 0.46% | 0.23%(+0.222)#42 | 0.29%(+0.171)#3,389 |
| 43. | Central | 0.46% | 0.23%(+0.221)#43 | 0.29%(+0.170)#3,395 |
| 44. | Travelers Rest | 0.45% | 0.23%(+0.220)#44 | 0.29%(+0.169)#3,411 |
| 45. | Baxter | 0.45% | 0.23%(+0.218)#45 | 0.29%(+0.167)#3,420 |
| 46. | James Island | 0.44% | 0.23%(+0.211)#46 | 0.29%(+0.159)#3,476 |
| 47. | Cottageville | 0.44% | 0.23%(+0.203)#47 | 0.29%(+0.152)#3,519 |
| 48. | Garden City | 0.41% | 0.23%(+0.179)#48 | 0.29%(+0.128)#3,687 |
| 49. | York | 0.40% | 0.23%(+0.164)#49 | 0.29%(+0.113)#3,820 |
| 50. | Ridgeway | 0.40% | 0.23%(+0.164)#50 | 0.29%(+0.113)#3,821 |
| 51. | Mcclellanville | 0.39% | 0.23%(+0.156)#51 | 0.29%(+0.104)#3,892 |
| 52. | Iva | 0.39% | 0.23%(+0.154)#52 | 0.29%(+0.103)#3,900 |
| 53. | Mauldin | 0.39% | 0.23%(+0.154)#53 | 0.29%(+0.102)#3,904 |
| 54. | Boiling Springs | 0.38% | 0.23%(+0.150)#54 | 0.29%(+0.099)#3,937 |
| 55. | Goose Creek | 0.38% | 0.23%(+0.143)#55 | 0.29%(+0.092)#3,991 |
| 56. | Tigerville | 0.38% | 0.23%(+0.143)#56 | 0.29%(+0.092)#3,996 |
| 57. | Greer | 0.37% | 0.23%(+0.136)#57 | 0.29%(+0.085)#4,052 |
| 58. | Arthurtown | 0.37% | 0.23%(+0.132)#58 | 0.29%(+0.080)#4,089 |
| 59. | Forestbrook | 0.36% | 0.23%(+0.130)#59 | 0.29%(+0.079)#4,102 |
| 60. | Port Royal | 0.36% | 0.23%(+0.130)#60 | 0.29%(+0.078)#4,104 |
| 61. | Great Falls | 0.36% | 0.23%(+0.125)#61 | 0.29%(+0.074)#4,135 |
| 62. | Cheraw | 0.36% | 0.23%(+0.122)#62 | 0.29%(+0.071)#4,171 |
| 63. | Spartanburg | 0.35% | 0.23%(+0.118)#63 | 0.29%(+0.067)#4,202 |
| 64. | Little River | 0.35% | 0.23%(+0.112)#64 | 0.29%(+0.061)#4,254 |
| 65. | Beaufort | 0.35% | 0.23%(+0.112)#65 | 0.29%(+0.061)#4,258 |
| 66. | Edisto Beach | 0.34% | 0.23%(+0.105)#66 | 0.29%(+0.054)#4,309 |
| 67. | North Charleston | 0.33% | 0.23%(+0.099)#67 | 0.29%(+0.047)#4,386 |
| 68. | Taylors | 0.33% | 0.23%(+0.096)#68 | 0.29%(+0.045)#4,399 |
| 69. | Awendaw | 0.32% | 0.23%(+0.089)#69 | 0.29%(+0.038)#4,468 |
| 70. | Isle Of Palms | 0.32% | 0.23%(+0.088)#70 | 0.29%(+0.037)#4,478 |
| 71. | Ravenel | 0.31% | 0.23%(+0.077)#71 | 0.29%(+0.026)#4,576 |
| 72. | Lake Murray Of Richland | 0.29% | 0.23%(+0.055)#72 | 0.29%(+0.004)#4,814 |
| 73. | Georgetown | 0.27% | 0.23%(+0.038)#73 | 0.29%(-0.014)#4,980 |
| 74. | Charleston | 0.27% | 0.23%(+0.036)#74 | 0.29%(-0.015)#5,001 |
| 75. | Seven Oaks | 0.27% | 0.23%(+0.031)#75 | 0.29%(-0.020)#5,058 |
| 76. | White Knoll | 0.26% | 0.23%(+0.030)#76 | 0.29%(-0.021)#5,070 |
| 77. | Batesburg Leesville | 0.26% | 0.23%(+0.026)#77 | 0.29%(-0.026)#5,115 |
| 78. | Sullivan S Island | 0.26% | 0.23%(+0.025)#78 | 0.29%(-0.026)#5,120 |
| 79. | Manning | 0.26% | 0.23%(+0.025)#79 | 0.29%(-0.026)#5,121 |
| 80. | Simpsonville | 0.25% | 0.23%(+0.019)#80 | 0.29%(-0.033)#5,200 |
| 81. | Conway | 0.25% | 0.23%(+0.017)#81 | 0.29%(-0.035)#5,224 |
| 82. | Socastee | 0.25% | 0.23%(+0.015)#82 | 0.29%(-0.036)#5,241 |
| 83. | Myrtle Beach | 0.24% | 0.23%(+0.007)#83 | 0.29%(-0.044)#5,327 |
| 84. | Moncks Corner | 0.24% | 0.23%(+0.004)#84 | 0.29%(-0.048)#5,378 |
| 85. | Seneca | 0.23% | 0.23%(-0.008)#85 | 0.29%(-0.059)#5,517 |
| 86. | Welcome | 0.22% | 0.23%(-0.010)#86 | 0.29%(-0.062)#5,556 |
| 87. | Fort Mill | 0.22% | 0.23%(-0.019)#87 | 0.29%(-0.070)#5,675 |
| 88. | Dentsville | 0.21% | 0.23%(-0.027)#88 | 0.29%(-0.078)#5,786 |
| 89. | Ware Shoals | 0.21% | 0.23%(-0.027)#89 | 0.29%(-0.079)#5,790 |
| 90. | Columbia | 0.19% | 0.23%(-0.049)#90 | 0.29%(-0.100)#6,107 |
| 91. | Belton | 0.18% | 0.23%(-0.050)#91 | 0.29%(-0.102)#6,133 |
| 92. | Easley | 0.18% | 0.23%(-0.053)#92 | 0.29%(-0.104)#6,162 |
| 93. | Carolina Forest | 0.18% | 0.23%(-0.053)#93 | 0.29%(-0.104)#6,166 |
| 94. | Cayce | 0.17% | 0.23%(-0.060)#94 | 0.29%(-0.111)#6,261 |
| 95. | Valley Falls | 0.17% | 0.23%(-0.065)#95 | 0.29%(-0.116)#6,344 |
| 96. | Bluffton | 0.16% | 0.23%(-0.071)#96 | 0.29%(-0.122)#6,421 |
| 97. | Clover | 0.16% | 0.23%(-0.072)#97 | 0.29%(-0.124)#6,442 |
| 98. | Sans Souci | 0.16% | 0.23%(-0.072)#98 | 0.29%(-0.124)#6,444 |
| 99. | Lugoff | 0.16% | 0.23%(-0.075)#99 | 0.29%(-0.126)#6,484 |
| 100. | Anderson | 0.16% | 0.23%(-0.077)#100 | 0.29%(-0.129)#6,514 |
Common Questions
What are the Top 10 Cities with the Highest Percentage of Immigrants from Northern Europe in South Carolina?
Top 10 Cities with the Highest Percentage of Immigrants from Northern Europe in South Carolina are:
#1
3.27%
#2
1.59%
#3
1.26%
#4
1.15%
#5
1.15%
#6
1.09%
#7
1.02%
#8
0.94%
#9
0.92%
#10
0.86%
What city has the Highest Percentage of Immigrants from Northern Europe in South Carolina?
Wedgefield has the Highest Percentage of Immigrants from Northern Europe in South Carolina with 3.27%.
What is the Percentage of Immigrants from Northern Europe in the State of South Carolina?
Percentage of Immigrants from Northern Europe in South Carolina is 0.23%.
What is the Percentage of Immigrants from Northern Europe in the United States?
Percentage of Immigrants from Northern Europe in the United States is 0.29%.