Cities with the Highest Percentage of Immigrants from Canada in Maryland
RELATED REPORTS & OPTIONS
Canada
Maryland
Compare Cities
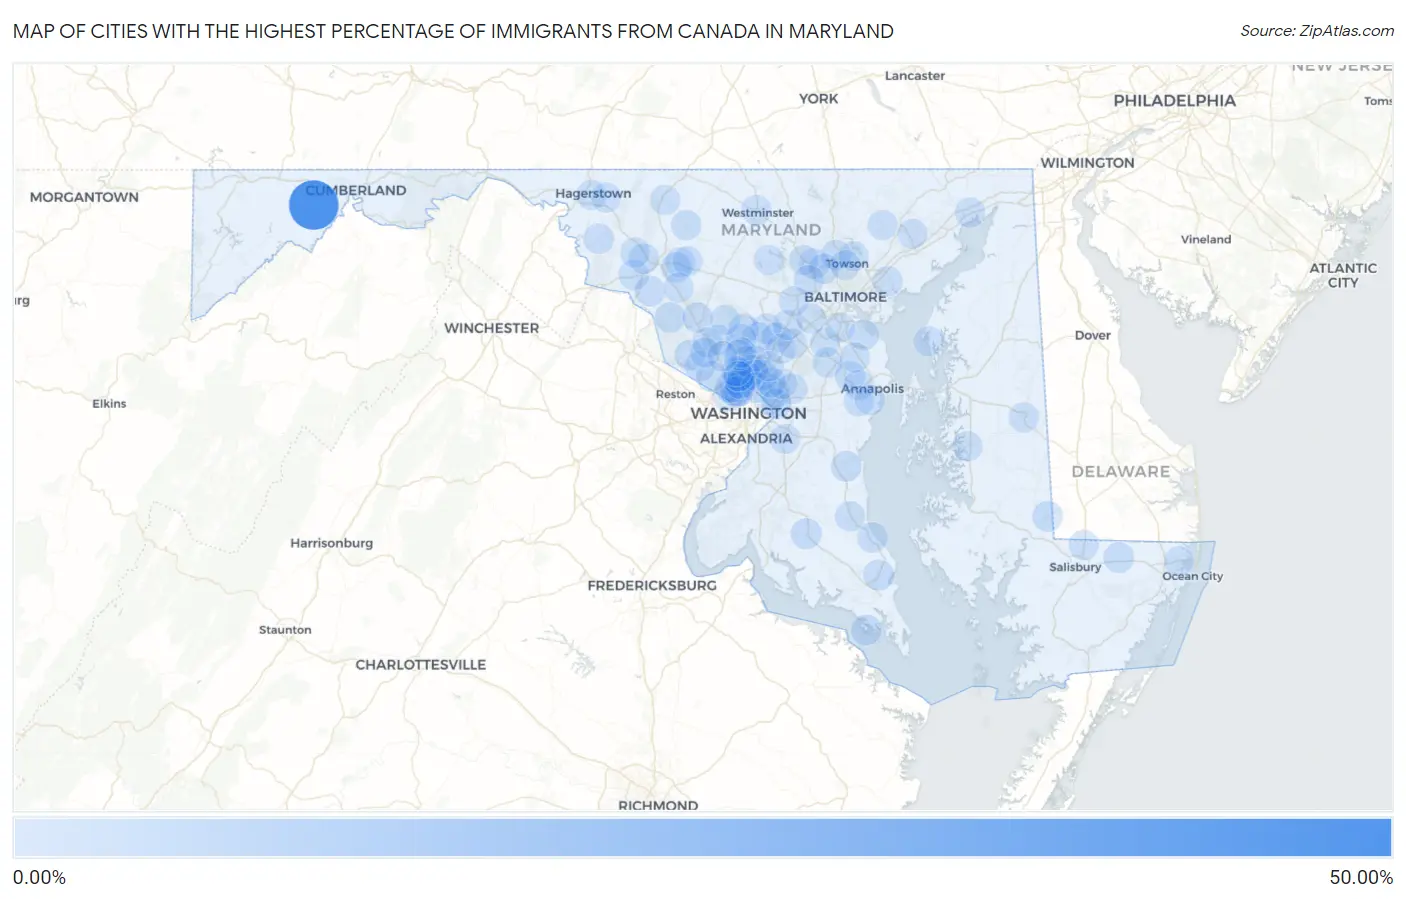
Map of Cities with the Highest Percentage of Immigrants from Canada in Maryland
0.00%
50.00%
Cities with the Highest Percentage of Immigrants from Canada in Maryland
| City | Canada | vs State | vs National | |
| 1. | Ocean | 47.06% | 0.14%(+46.9)#-1 | 0.25%(+46.8)#0 |
| 2. | Kensington | 3.84% | 0.14%(+3.70)#50 | 0.25%(+3.59)#1,505 |
| 3. | Charlotte Hall | 1.84% | 0.14%(+1.70)#51 | 0.25%(+1.60)#1,506 |
| 4. | Colesville | 1.59% | 0.14%(+1.45)#52 | 0.25%(+1.34)#1,507 |
| 5. | Solomons | 1.47% | 0.14%(+1.33)#53 | 0.25%(+1.22)#1,508 |
| 6. | North Chevy Chase | 1.47% | 0.14%(+1.33)#54 | 0.25%(+1.22)#1,509 |
| 7. | Piney Point | 1.45% | 0.14%(+1.31)#55 | 0.25%(+1.20)#1,510 |
| 8. | Sharptown | 1.33% | 0.14%(+1.19)#56 | 0.25%(+1.08)#1,511 |
| 9. | Pittsville | 1.27% | 0.14%(+1.13)#57 | 0.25%(+1.02)#1,512 |
| 10. | Owings | 1.18% | 0.14%(+1.04)#58 | 0.25%(+0.930)#1,513 |
| 11. | Washington Grove | 1.16% | 0.14%(+1.02)#59 | 0.25%(+0.911)#1,514 |
| 12. | Keedysville | 1.11% | 0.14%(+0.970)#60 | 0.25%(+0.861)#1,515 |
| 13. | Garrison | 1.10% | 0.14%(+0.956)#61 | 0.25%(+0.848)#1,516 |
| 14. | Ashton Sandy Spring | 1.09% | 0.14%(+0.954)#62 | 0.25%(+0.845)#1,517 |
| 15. | Barnesville | 1.08% | 0.14%(+0.936)#63 | 0.25%(+0.827)#1,518 |
| 16. | Chevy Chase Section Five | 1.01% | 0.14%(+0.865)#64 | 0.25%(+0.757)#1,519 |
| 17. | St Leonard | 0.99% | 0.14%(+0.852)#65 | 0.25%(+0.744)#1,520 |
| 18. | Highland | 0.97% | 0.14%(+0.831)#66 | 0.25%(+0.723)#1,521 |
| 19. | Brookmont | 0.94% | 0.14%(+0.798)#67 | 0.25%(+0.690)#1,522 |
| 20. | Travilah | 0.90% | 0.14%(+0.764)#68 | 0.25%(+0.655)#1,533 |
| 21. | South Kensington | 0.88% | 0.14%(+0.744)#69 | 0.25%(+0.636)#1,534 |
| 22. | Friendship Heights Village | 0.81% | 0.14%(+0.672)#70 | 0.25%(+0.563)#1,535 |
| 23. | Crownsville | 0.81% | 0.14%(+0.667)#71 | 0.25%(+0.559)#1,536 |
| 24. | Bartonsville | 0.80% | 0.14%(+0.661)#72 | 0.25%(+0.552)#1,537 |
| 25. | Darnestown | 0.78% | 0.14%(+0.640)#73 | 0.25%(+0.531)#1,538 |
| 26. | Somerset | 0.78% | 0.14%(+0.639)#74 | 0.25%(+0.530)#1,539 |
| 27. | Hillandale | 0.76% | 0.14%(+0.620)#75 | 0.25%(+0.511)#1,540 |
| 28. | Adamstown | 0.71% | 0.14%(+0.570)#76 | 0.25%(+0.462)#1,541 |
| 29. | Glenmont | 0.71% | 0.14%(+0.570)#77 | 0.25%(+0.461)#1,542 |
| 30. | Jefferson | 0.69% | 0.14%(+0.553)#78 | 0.25%(+0.445)#1,543 |
| 31. | Chevy Chase Village | 0.69% | 0.14%(+0.550)#79 | 0.25%(+0.441)#2,066 |
| 32. | Woodsboro | 0.65% | 0.14%(+0.506)#80 | 0.25%(+0.397)#2,067 |
| 33. | Mays Chapel | 0.62% | 0.14%(+0.482)#81 | 0.25%(+0.374)#2,068 |
| 34. | Brookeville | 0.61% | 0.14%(+0.470)#82 | 0.25%(+0.362)#2,069 |
| 35. | Kemp Mill | 0.60% | 0.14%(+0.456)#83 | 0.25%(+0.348)#2,070 |
| 36. | Riviera Beach | 0.57% | 0.14%(+0.430)#84 | 0.25%(+0.321)#2,071 |
| 37. | Braddock Heights | 0.56% | 0.14%(+0.420)#85 | 0.25%(+0.312)#2,072 |
| 38. | Forest Glen | 0.54% | 0.14%(+0.400)#86 | 0.25%(+0.291)#2,073 |
| 39. | Four Corners | 0.53% | 0.14%(+0.388)#87 | 0.25%(+0.280)#2,074 |
| 40. | Bethesda | 0.52% | 0.14%(+0.376)#88 | 0.25%(+0.268)#2,075 |
| 41. | Chevy Chase | 0.51% | 0.14%(+0.371)#89 | 0.25%(+0.263)#2,076 |
| 42. | Olney | 0.48% | 0.14%(+0.339)#90 | 0.25%(+0.230)#2,077 |
| 43. | Parole | 0.46% | 0.14%(+0.325)#91 | 0.25%(+0.216)#2,078 |
| 44. | Pikesville | 0.44% | 0.14%(+0.297)#92 | 0.25%(+0.189)#2,249 |
| 45. | Aspen Hill | 0.42% | 0.14%(+0.284)#93 | 0.25%(+0.176)#2,250 |
| 46. | Clarksburg | 0.40% | 0.14%(+0.259)#94 | 0.25%(+0.151)#2,251 |
| 47. | Fulton | 0.37% | 0.14%(+0.228)#95 | 0.25%(+0.120)#2,252 |
| 48. | Leisure World | 0.37% | 0.14%(+0.228)#96 | 0.25%(+0.119)#2,253 |
| 49. | Cottage City | 0.36% | 0.14%(+0.219)#97 | 0.25%(+0.111)#2,254 |
| 50. | Chevy Chase View | 0.36% | 0.14%(+0.217)#98 | 0.25%(+0.108)#2,255 |
| 51. | Andrews Afb | 0.35% | 0.14%(+0.215)#99 | 0.25%(+0.107)#2,256 |
| 52. | Edgewater | 0.34% | 0.14%(+0.196)#100 | 0.25%(+0.088)#2,591 |
| 53. | Spring Ridge | 0.33% | 0.14%(+0.194)#101 | 0.25%(+0.086)#2,592 |
| 54. | West Laurel | 0.32% | 0.14%(+0.184)#102 | 0.25%(+0.075)#2,593 |
| 55. | Prince Frederick | 0.32% | 0.14%(+0.182)#103 | 0.25%(+0.073)#2,594 |
| 56. | Hagerstown | 0.32% | 0.14%(+0.181)#104 | 0.25%(+0.072)#2,595 |
| 57. | Linganore | 0.31% | 0.14%(+0.172)#105 | 0.25%(+0.064)#2,596 |
| 58. | Annapolis Neck | 0.31% | 0.14%(+0.167)#106 | 0.25%(+0.059)#2,597 |
| 59. | Easton | 0.30% | 0.14%(+0.164)#107 | 0.25%(+0.056)#2,598 |
| 60. | Westminster | 0.30% | 0.14%(+0.164)#108 | 0.25%(+0.055)#2,635 |
| 61. | Severna Park | 0.29% | 0.14%(+0.150)#109 | 0.25%(+0.041)#2,636 |
| 62. | North Laurel | 0.29% | 0.14%(+0.147)#110 | 0.25%(+0.039)#2,637 |
| 63. | Middle River | 0.28% | 0.14%(+0.143)#111 | 0.25%(+0.034)#2,638 |
| 64. | Delmar | 0.28% | 0.14%(+0.143)#112 | 0.25%(+0.034)#2,639 |
| 65. | Middletown | 0.28% | 0.14%(+0.142)#113 | 0.25%(+0.033)#2,640 |
| 66. | Columbia | 0.28% | 0.14%(+0.139)#114 | 0.25%(+0.030)#2,641 |
| 67. | Perryville | 0.27% | 0.14%(+0.133)#115 | 0.25%(+0.025)#2,642 |
| 68. | Laytonsville | 0.27% | 0.14%(+0.132)#116 | 0.25%(+0.024)#2,643 |
| 69. | Eldersburg | 0.27% | 0.14%(+0.130)#117 | 0.25%(+0.022)#3,345 |
| 70. | Urbana | 0.27% | 0.14%(+0.130)#118 | 0.25%(+0.021)#3,346 |
| 71. | Denton | 0.27% | 0.14%(+0.129)#119 | 0.25%(+0.021)#3,347 |
| 72. | Takoma Park | 0.26% | 0.14%(+0.123)#120 | 0.25%(+0.014)#3,348 |
| 73. | Riverdale Park | 0.26% | 0.14%(+0.121)#121 | 0.25%(+0.013)#3,349 |
| 74. | Gaithersburg | 0.26% | 0.14%(+0.118)#122 | 0.25%(+0.010)#3,350 |
| 75. | Odenton | 0.26% | 0.14%(+0.116)#123 | 0.25%(+0.007)#3,351 |
| 76. | Garrett Park | 0.25% | 0.14%(+0.105)#124 | 0.25%(-0.003)#3,352 |
| 77. | Seabrook | 0.24% | 0.14%(+0.103)#125 | 0.25%(-0.006)#3,353 |
| 78. | Potomac | 0.24% | 0.14%(+0.101)#126 | 0.25%(-0.007)#3,354 |
| 79. | Abingdon | 0.23% | 0.14%(+0.095)#127 | 0.25%(-0.013)#3,355 |
| 80. | Cheverly | 0.23% | 0.14%(+0.089)#128 | 0.25%(-0.020)#3,356 |
| 81. | Ilchester | 0.22% | 0.14%(+0.084)#129 | 0.25%(-0.025)#3,357 |
| 82. | Flower Hill | 0.22% | 0.14%(+0.079)#130 | 0.25%(-0.029)#3,358 |
| 83. | North Potomac | 0.22% | 0.14%(+0.079)#131 | 0.25%(-0.030)#3,359 |
| 84. | Robinwood | 0.21% | 0.14%(+0.073)#132 | 0.25%(-0.036)#3,360 |
| 85. | Towson | 0.21% | 0.14%(+0.072)#133 | 0.25%(-0.036)#3,361 |
| 86. | Ocean Pines | 0.21% | 0.14%(+0.072)#134 | 0.25%(-0.037)#3,362 |
| 87. | Rock Hall | 0.21% | 0.14%(+0.066)#135 | 0.25%(-0.042)#3,363 |
| 88. | Severn | 0.21% | 0.14%(+0.066)#136 | 0.25%(-0.043)#3,364 |
| 89. | Greenbelt | 0.20% | 0.14%(+0.063)#137 | 0.25%(-0.045)#3,365 |
| 90. | Owings Mills | 0.20% | 0.14%(+0.063)#138 | 0.25%(-0.045)#3,366 |
| 91. | Rockville | 0.20% | 0.14%(+0.060)#139 | 0.25%(-0.049)#3,367 |
| 92. | Milford Mill | 0.19% | 0.14%(+0.048)#140 | 0.25%(-0.061)#3,368 |
| 93. | College Park | 0.18% | 0.14%(+0.041)#141 | 0.25%(-0.068)#3,369 |
| 94. | Fallston | 0.17% | 0.14%(+0.031)#142 | 0.25%(-0.077)#3,370 |
| 95. | Ferndale | 0.17% | 0.14%(+0.028)#143 | 0.25%(-0.080)#3,371 |
| 96. | Ellicott City | 0.17% | 0.14%(+0.028)#144 | 0.25%(-0.081)#3,372 |
| 97. | Thurmont | 0.16% | 0.14%(+0.019)#145 | 0.25%(-0.090)#3,373 |
| 98. | Calverton | 0.16% | 0.14%(+0.019)#146 | 0.25%(-0.090)#3,374 |
| 99. | Hampton | 0.16% | 0.14%(+0.018)#147 | 0.25%(-0.091)#3,375 |
| 100. | Bel Air South | 0.15% | 0.14%(+0.013)#148 | 0.25%(-0.096)#3,376 |
Common Questions
What are the Top 10 Cities with the Highest Percentage of Immigrants from Canada in Maryland?
Top 10 Cities with the Highest Percentage of Immigrants from Canada in Maryland are:
#1
47.06%
#2
3.84%
#3
1.84%
#4
1.59%
#5
1.47%
#6
1.47%
#7
1.45%
#8
1.33%
#9
1.27%
#10
1.18%
What city has the Highest Percentage of Immigrants from Canada in Maryland?
Ocean has the Highest Percentage of Immigrants from Canada in Maryland with 47.06%.
What is the Percentage of Immigrants from Canada in the State of Maryland?
Percentage of Immigrants from Canada in Maryland is 0.14%.
What is the Percentage of Immigrants from Canada in the United States?
Percentage of Immigrants from Canada in the United States is 0.25%.