Cities with the Highest Percentage of Immigrants from Colombia in Maryland
RELATED REPORTS & OPTIONS
Colombia
Maryland
Compare Cities
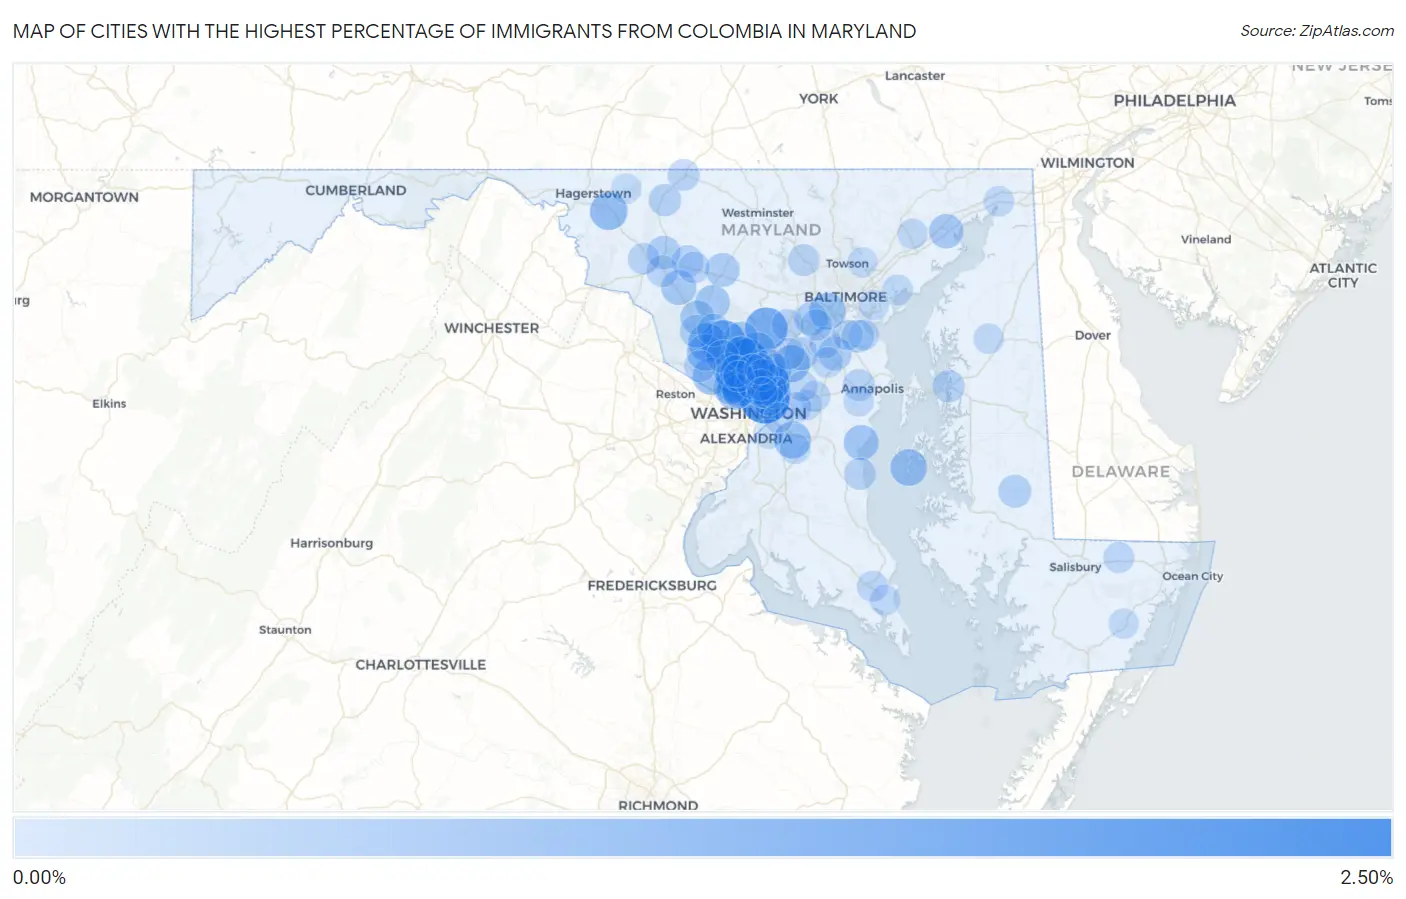
Map of Cities with the Highest Percentage of Immigrants from Colombia in Maryland
0.00%
2.50%
Cities with the Highest Percentage of Immigrants from Colombia in Maryland
| City | Colombia | vs State | vs National | |
| 1. | Mount Rainier | 2.31% | 0.21%(+2.10)#13 | 0.26%(+2.05)#232 |
| 2. | Adelphi | 1.89% | 0.21%(+1.69)#18 | 0.26%(+1.63)#318 |
| 3. | Glenmont | 1.79% | 0.21%(+1.58)#19 | 0.26%(+1.53)#319 |
| 4. | Chevy Chase View | 1.78% | 0.21%(+1.57)#20 | 0.26%(+1.52)#320 |
| 5. | Redland | 1.73% | 0.21%(+1.52)#49 | 0.26%(+1.47)#823 |
| 6. | Highland | 1.51% | 0.21%(+1.30)#50 | 0.26%(+1.25)#824 |
| 7. | Kensington | 1.20% | 0.21%(+0.995)#51 | 0.26%(+0.945)#825 |
| 8. | Chevy Chase | 1.09% | 0.21%(+0.884)#52 | 0.26%(+0.833)#826 |
| 9. | Four Corners | 1.04% | 0.21%(+0.834)#53 | 0.26%(+0.783)#827 |
| 10. | Gaithersburg | 1.04% | 0.21%(+0.832)#54 | 0.26%(+0.782)#828 |
| 11. | Wheaton | 1.04% | 0.21%(+0.829)#55 | 0.26%(+0.778)#829 |
| 12. | Beaver Creek | 0.95% | 0.21%(+0.739)#56 | 0.26%(+0.688)#830 |
| 13. | Potomac | 0.90% | 0.21%(+0.694)#104 | 0.26%(+0.643)#2,125 |
| 14. | Melwood | 0.90% | 0.21%(+0.692)#105 | 0.26%(+0.642)#2,126 |
| 15. | South Laurel | 0.88% | 0.21%(+0.674)#106 | 0.26%(+0.623)#2,127 |
| 16. | Chevy Chase Section Three | 0.88% | 0.21%(+0.668)#107 | 0.26%(+0.617)#2,128 |
| 17. | Somerset | 0.88% | 0.21%(+0.666)#108 | 0.26%(+0.616)#2,129 |
| 18. | Arbutus | 0.85% | 0.21%(+0.640)#109 | 0.26%(+0.589)#2,130 |
| 19. | College Park | 0.85% | 0.21%(+0.639)#110 | 0.26%(+0.588)#2,131 |
| 20. | Tilghman Island | 0.85% | 0.21%(+0.638)#111 | 0.26%(+0.587)#2,132 |
| 21. | North Potomac | 0.83% | 0.21%(+0.617)#128 | 0.26%(+0.566)#2,933 |
| 22. | North Kensington | 0.78% | 0.21%(+0.570)#129 | 0.26%(+0.519)#2,934 |
| 23. | Aspen Hill | 0.77% | 0.21%(+0.565)#130 | 0.26%(+0.514)#2,935 |
| 24. | Layhill | 0.74% | 0.21%(+0.528)#131 | 0.26%(+0.477)#2,936 |
| 25. | Cloverly | 0.73% | 0.21%(+0.521)#132 | 0.26%(+0.470)#2,937 |
| 26. | Deale | 0.68% | 0.21%(+0.471)#133 | 0.26%(+0.420)#2,938 |
| 27. | Urbana | 0.66% | 0.21%(+0.449)#134 | 0.26%(+0.398)#2,939 |
| 28. | Takoma Park | 0.65% | 0.21%(+0.441)#135 | 0.26%(+0.390)#2,940 |
| 29. | Damascus | 0.64% | 0.21%(+0.426)#136 | 0.26%(+0.375)#2,941 |
| 30. | Flower Hill | 0.63% | 0.21%(+0.419)#137 | 0.26%(+0.369)#2,942 |
| 31. | Wildewood | 0.61% | 0.21%(+0.396)#138 | 0.26%(+0.345)#2,943 |
| 32. | Aberdeen | 0.60% | 0.21%(+0.394)#139 | 0.26%(+0.343)#2,944 |
| 33. | North Bethesda | 0.57% | 0.21%(+0.365)#140 | 0.26%(+0.315)#2,945 |
| 34. | Olney | 0.57% | 0.21%(+0.359)#141 | 0.26%(+0.309)#3,005 |
| 35. | Clarksburg | 0.56% | 0.21%(+0.355)#142 | 0.26%(+0.305)#3,006 |
| 36. | Mount Airy | 0.56% | 0.21%(+0.349)#143 | 0.26%(+0.299)#3,007 |
| 37. | Bethesda | 0.52% | 0.21%(+0.315)#144 | 0.26%(+0.265)#3,090 |
| 38. | Gambrills | 0.51% | 0.21%(+0.305)#145 | 0.26%(+0.254)#3,091 |
| 39. | Ilchester | 0.51% | 0.21%(+0.303)#146 | 0.26%(+0.253)#3,092 |
| 40. | Frederick | 0.51% | 0.21%(+0.300)#147 | 0.26%(+0.249)#3,093 |
| 41. | Calverton | 0.50% | 0.21%(+0.293)#148 | 0.26%(+0.242)#3,094 |
| 42. | Chevy Chase Village | 0.48% | 0.21%(+0.268)#149 | 0.26%(+0.217)#3,095 |
| 43. | Silver Spring | 0.47% | 0.21%(+0.265)#150 | 0.26%(+0.214)#3,096 |
| 44. | Maryland City | 0.46% | 0.21%(+0.254)#151 | 0.26%(+0.203)#3,097 |
| 45. | Germantown | 0.44% | 0.21%(+0.231)#152 | 0.26%(+0.180)#3,098 |
| 46. | Hurlock | 0.44% | 0.21%(+0.229)#153 | 0.26%(+0.178)#3,099 |
| 47. | Beltsville | 0.44% | 0.21%(+0.227)#154 | 0.26%(+0.176)#3,100 |
| 48. | Pasadena | 0.44% | 0.21%(+0.226)#155 | 0.26%(+0.175)#3,101 |
| 49. | Montgomery Village | 0.42% | 0.21%(+0.211)#156 | 0.26%(+0.160)#3,102 |
| 50. | Rockville | 0.41% | 0.21%(+0.199)#157 | 0.26%(+0.148)#3,103 |
| 51. | Hyattsville | 0.40% | 0.21%(+0.189)#158 | 0.26%(+0.138)#3,104 |
| 52. | Thurmont | 0.38% | 0.21%(+0.171)#159 | 0.26%(+0.120)#3,105 |
| 53. | Leisure World | 0.38% | 0.21%(+0.170)#160 | 0.26%(+0.119)#3,106 |
| 54. | Queenstown | 0.37% | 0.21%(+0.159)#161 | 0.26%(+0.108)#3,107 |
| 55. | Garrett Park | 0.37% | 0.21%(+0.158)#162 | 0.26%(+0.108)#3,108 |
| 56. | Kemp Mill | 0.35% | 0.21%(+0.145)#163 | 0.26%(+0.095)#3,109 |
| 57. | Parole | 0.35% | 0.21%(+0.136)#164 | 0.26%(+0.085)#3,110 |
| 58. | Linganore | 0.35% | 0.21%(+0.136)#165 | 0.26%(+0.085)#3,111 |
| 59. | Columbia | 0.35% | 0.21%(+0.136)#166 | 0.26%(+0.085)#3,112 |
| 60. | Chesapeake Beach | 0.33% | 0.21%(+0.121)#167 | 0.26%(+0.070)#3,113 |
| 61. | Riverdale Park | 0.33% | 0.21%(+0.120)#168 | 0.26%(+0.070)#3,114 |
| 62. | New Market | 0.33% | 0.21%(+0.117)#169 | 0.26%(+0.066)#3,115 |
| 63. | Owings Mills | 0.32% | 0.21%(+0.114)#170 | 0.26%(+0.063)#3,116 |
| 64. | Severn | 0.32% | 0.21%(+0.113)#171 | 0.26%(+0.062)#3,117 |
| 65. | Hillandale | 0.32% | 0.21%(+0.111)#172 | 0.26%(+0.060)#3,118 |
| 66. | Emmitsburg | 0.32% | 0.21%(+0.110)#173 | 0.26%(+0.059)#3,119 |
| 67. | Ballenger Creek | 0.32% | 0.21%(+0.107)#174 | 0.26%(+0.057)#3,120 |
| 68. | Braddock Heights | 0.32% | 0.21%(+0.106)#175 | 0.26%(+0.055)#3,121 |
| 69. | Travilah | 0.30% | 0.21%(+0.095)#176 | 0.26%(+0.044)#3,122 |
| 70. | Laurel | 0.30% | 0.21%(+0.088)#177 | 0.26%(+0.038)#3,123 |
| 71. | Elkridge | 0.27% | 0.21%(+0.064)#178 | 0.26%(+0.013)#3,124 |
| 72. | Cottage City | 0.27% | 0.21%(+0.060)#179 | 0.26%(+0.009)#3,125 |
| 73. | Langley Park | 0.26% | 0.21%(+0.048)#180 | 0.26%(-0.003)#3,126 |
| 74. | Green Valley | 0.25% | 0.21%(+0.045)#181 | 0.26%(-0.006)#3,127 |
| 75. | California | 0.25% | 0.21%(+0.040)#182 | 0.26%(-0.011)#3,128 |
| 76. | Honeygo | 0.24% | 0.21%(+0.031)#183 | 0.26%(-0.019)#3,129 |
| 77. | South Kensington | 0.24% | 0.21%(+0.030)#184 | 0.26%(-0.021)#3,130 |
| 78. | White Oak | 0.24% | 0.21%(+0.030)#185 | 0.26%(-0.021)#3,131 |
| 79. | Riviera Beach | 0.23% | 0.21%(+0.022)#186 | 0.26%(-0.029)#3,132 |
| 80. | Pittsville | 0.23% | 0.21%(+0.017)#187 | 0.26%(-0.033)#3,133 |
| 81. | Bowie | 0.22% | 0.21%(+0.012)#188 | 0.26%(-0.039)#3,134 |
| 82. | Bowleys Quarters | 0.21% | 0.21%(-0.002)#189 | 0.26%(-0.052)#3,135 |
| 83. | Woodmore | 0.21% | 0.21%(-0.004)#190 | 0.26%(-0.054)#3,136 |
| 84. | Lake Arbor | 0.20% | 0.21%(-0.008)#191 | 0.26%(-0.059)#3,137 |
| 85. | Lexington Park | 0.20% | 0.21%(-0.010)#192 | 0.26%(-0.061)#3,138 |
| 86. | Chillum | 0.20% | 0.21%(-0.012)#193 | 0.26%(-0.062)#3,139 |
| 87. | North East | 0.20% | 0.21%(-0.012)#194 | 0.26%(-0.063)#3,140 |
| 88. | Glen Burnie | 0.19% | 0.21%(-0.019)#195 | 0.26%(-0.070)#3,141 |
| 89. | Glenn Dale | 0.19% | 0.21%(-0.019)#196 | 0.26%(-0.070)#3,142 |
| 90. | Bel Air South | 0.19% | 0.21%(-0.022)#197 | 0.26%(-0.073)#3,143 |
| 91. | Odenton | 0.19% | 0.21%(-0.023)#198 | 0.26%(-0.073)#3,144 |
| 92. | Church Hill | 0.18% | 0.21%(-0.025)#199 | 0.26%(-0.075)#3,145 |
| 93. | Rosaryville | 0.18% | 0.21%(-0.026)#200 | 0.26%(-0.077)#3,146 |
| 94. | Edgewater | 0.18% | 0.21%(-0.030)#201 | 0.26%(-0.081)#3,147 |
| 95. | Snow Hill | 0.17% | 0.21%(-0.040)#202 | 0.26%(-0.090)#3,148 |
| 96. | Dundalk | 0.17% | 0.21%(-0.042)#203 | 0.26%(-0.093)#3,149 |
| 97. | Carney | 0.17% | 0.21%(-0.042)#204 | 0.26%(-0.093)#3,150 |
| 98. | Smithsburg | 0.17% | 0.21%(-0.044)#205 | 0.26%(-0.095)#3,151 |
| 99. | Marlow Heights | 0.16% | 0.21%(-0.049)#206 | 0.26%(-0.100)#3,152 |
| 100. | Capitol Heights | 0.15% | 0.21%(-0.061)#207 | 0.26%(-0.111)#3,153 |
Common Questions
What are the Top 10 Cities with the Highest Percentage of Immigrants from Colombia in Maryland?
Top 10 Cities with the Highest Percentage of Immigrants from Colombia in Maryland are:
#1
2.31%
#2
1.89%
#3
1.79%
#4
1.78%
#5
1.73%
#6
1.51%
#7
1.20%
#8
1.09%
#9
1.04%
#10
1.04%
What city has the Highest Percentage of Immigrants from Colombia in Maryland?
Mount Rainier has the Highest Percentage of Immigrants from Colombia in Maryland with 2.31%.
What is the Percentage of Immigrants from Colombia in the State of Maryland?
Percentage of Immigrants from Colombia in Maryland is 0.21%.
What is the Percentage of Immigrants from Colombia in the United States?
Percentage of Immigrants from Colombia in the United States is 0.26%.