Cities with the Most Immigrants from Iran in Maryland
RELATED REPORTS & OPTIONS
Iran
Maryland
Compare Cities
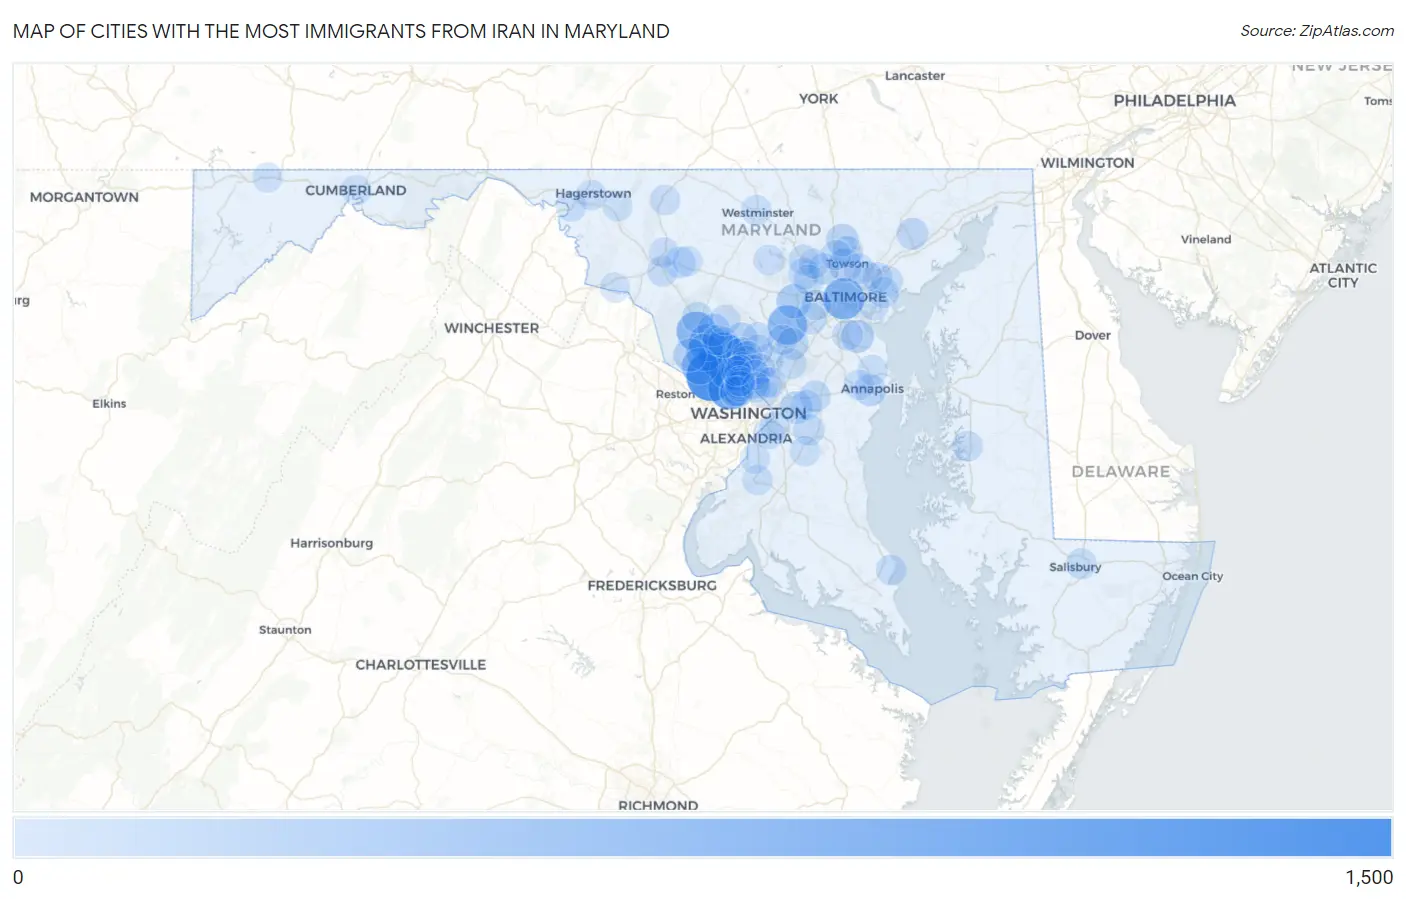
Map of Cities with the Most Immigrants from Iran in Maryland
0
1,500
Cities with the Most Immigrants from Iran in Maryland
| City | Iran | vs State | vs National | |
| 1. | Potomac | 1,175 | 12,074(9.73%)#1 | 391,354(0.30%)#31 |
| 2. | Rockville | 1,028 | 12,074(8.51%)#2 | 391,354(0.26%)#40 |
| 3. | Bethesda | 831 | 12,074(6.88%)#3 | 391,354(0.21%)#52 |
| 4. | Baltimore | 671 | 12,074(5.56%)#4 | 391,354(0.17%)#67 |
| 5. | North Bethesda | 608 | 12,074(5.04%)#5 | 391,354(0.16%)#75 |
| 6. | Columbia | 557 | 12,074(4.61%)#6 | 391,354(0.14%)#83 |
| 7. | Germantown | 547 | 12,074(4.53%)#7 | 391,354(0.14%)#86 |
| 8. | Gaithersburg | 434 | 12,074(3.59%)#8 | 391,354(0.11%)#121 |
| 9. | North Potomac | 415 | 12,074(3.44%)#9 | 391,354(0.11%)#126 |
| 10. | Travilah | 382 | 12,074(3.16%)#10 | 391,354(0.10%)#137 |
| 11. | Woodlawn Cdp Baltimore County | 300 | 12,074(2.48%)#11 | 391,354(0.08%)#182 |
| 12. | Ellicott City | 259 | 12,074(2.15%)#12 | 391,354(0.07%)#219 |
| 13. | Darnestown | 186 | 12,074(1.54%)#13 | 391,354(0.05%)#301 |
| 14. | Towson | 178 | 12,074(1.47%)#14 | 391,354(0.05%)#310 |
| 15. | Pasadena | 171 | 12,074(1.42%)#15 | 391,354(0.04%)#322 |
| 16. | Silver Spring | 152 | 12,074(1.26%)#16 | 391,354(0.04%)#365 |
| 17. | Olney | 152 | 12,074(1.26%)#17 | 391,354(0.04%)#366 |
| 18. | Lake Arbor | 134 | 12,074(1.11%)#18 | 391,354(0.03%)#414 |
| 19. | Montgomery Village | 131 | 12,074(1.08%)#19 | 391,354(0.03%)#418 |
| 20. | Cockeysville | 131 | 12,074(1.08%)#20 | 391,354(0.03%)#419 |
| 21. | Friendship Heights Village | 125 | 12,074(1.04%)#21 | 391,354(0.03%)#432 |
| 22. | Aspen Hill | 124 | 12,074(1.03%)#22 | 391,354(0.03%)#434 |
| 23. | Flower Hill | 119 | 12,074(0.99%)#23 | 391,354(0.03%)#456 |
| 24. | Annapolis | 118 | 12,074(0.98%)#24 | 391,354(0.03%)#458 |
| 25. | North Laurel | 110 | 12,074(0.91%)#25 | 391,354(0.03%)#489 |
| 26. | Bel Air South | 97 | 12,074(0.80%)#26 | 391,354(0.02%)#539 |
| 27. | Pikesville | 79 | 12,074(0.65%)#27 | 391,354(0.02%)#636 |
| 28. | Spring Ridge | 79 | 12,074(0.65%)#28 | 391,354(0.02%)#640 |
| 29. | Bowie | 72 | 12,074(0.60%)#29 | 391,354(0.02%)#691 |
| 30. | Clarksburg | 67 | 12,074(0.55%)#30 | 391,354(0.02%)#723 |
| 31. | Ilchester | 67 | 12,074(0.55%)#31 | 391,354(0.02%)#724 |
| 32. | Middle River | 64 | 12,074(0.53%)#32 | 391,354(0.02%)#751 |
| 33. | Marlboro Village | 64 | 12,074(0.53%)#33 | 391,354(0.02%)#755 |
| 34. | Timonium | 61 | 12,074(0.51%)#34 | 391,354(0.02%)#777 |
| 35. | Redland | 60 | 12,074(0.50%)#35 | 391,354(0.02%)#784 |
| 36. | Randallstown | 58 | 12,074(0.48%)#36 | 391,354(0.01%)#797 |
| 37. | Essex | 53 | 12,074(0.44%)#37 | 391,354(0.01%)#844 |
| 38. | Fairland | 53 | 12,074(0.44%)#38 | 391,354(0.01%)#847 |
| 39. | Owings Mills | 48 | 12,074(0.40%)#39 | 391,354(0.01%)#902 |
| 40. | Ballenger Creek | 43 | 12,074(0.36%)#40 | 391,354(0.01%)#965 |
| 41. | Glen Burnie | 41 | 12,074(0.34%)#41 | 391,354(0.01%)#985 |
| 42. | Salisbury | 40 | 12,074(0.33%)#42 | 391,354(0.01%)#1,001 |
| 43. | Honeygo | 40 | 12,074(0.33%)#43 | 391,354(0.01%)#1,007 |
| 44. | Cloverly | 38 | 12,074(0.31%)#44 | 391,354(0.01%)#1,043 |
| 45. | Ashton Sandy Spring | 37 | 12,074(0.31%)#45 | 391,354(0.01%)#1,061 |
| 46. | Parkville | 36 | 12,074(0.30%)#46 | 391,354(0.01%)#1,067 |
| 47. | Glenmont | 36 | 12,074(0.30%)#47 | 391,354(0.01%)#1,073 |
| 48. | Milford Mill | 33 | 12,074(0.27%)#48 | 391,354(0.01%)#1,129 |
| 49. | Marlow Heights | 33 | 12,074(0.27%)#49 | 391,354(0.01%)#1,136 |
| 50. | Williamsport | 32 | 12,074(0.27%)#50 | 391,354(0.01%)#1,154 |
| 51. | Easton | 31 | 12,074(0.26%)#51 | 391,354(0.01%)#1,178 |
| 52. | Chesapeake Ranch Estates | 31 | 12,074(0.26%)#52 | 391,354(0.01%)#1,187 |
| 53. | Wheaton | 30 | 12,074(0.25%)#53 | 391,354(0.01%)#1,197 |
| 54. | Leisure World | 30 | 12,074(0.25%)#54 | 391,354(0.01%)#1,208 |
| 55. | White Oak | 28 | 12,074(0.23%)#55 | 391,354(0.01%)#1,247 |
| 56. | Kemp Mill | 28 | 12,074(0.23%)#56 | 391,354(0.01%)#1,251 |
| 57. | Layhill | 28 | 12,074(0.23%)#57 | 391,354(0.01%)#1,259 |
| 58. | Mays Chapel | 27 | 12,074(0.22%)#58 | 391,354(0.01%)#1,283 |
| 59. | Woodmore | 27 | 12,074(0.22%)#59 | 391,354(0.01%)#1,293 |
| 60. | Arnold | 26 | 12,074(0.22%)#60 | 391,354(0.01%)#1,304 |
| 61. | South Kensington | 26 | 12,074(0.22%)#61 | 391,354(0.01%)#1,316 |
| 62. | Eldersburg | 25 | 12,074(0.21%)#62 | 391,354(0.01%)#1,331 |
| 63. | South Laurel | 25 | 12,074(0.21%)#63 | 391,354(0.01%)#1,332 |
| 64. | Adelphi | 23 | 12,074(0.19%)#64 | 391,354(0.01%)#1,372 |
| 65. | College Park | 22 | 12,074(0.18%)#65 | 391,354(0.01%)#1,393 |
| 66. | Dundalk | 21 | 12,074(0.17%)#66 | 391,354(0.01%)#1,417 |
| 67. | Chevy Chase | 20 | 12,074(0.17%)#67 | 391,354(0.01%)#1,455 |
| 68. | Thurmont | 20 | 12,074(0.17%)#68 | 391,354(0.01%)#1,458 |
| 69. | Parole | 18 | 12,074(0.15%)#69 | 391,354(0.00%)#1,523 |
| 70. | Rossville | 18 | 12,074(0.15%)#70 | 391,354(0.00%)#1,525 |
| 71. | Hagerstown | 17 | 12,074(0.14%)#71 | 391,354(0.00%)#1,554 |
| 72. | North Kensington | 16 | 12,074(0.13%)#72 | 391,354(0.00%)#1,606 |
| 73. | Washington Grove | 16 | 12,074(0.13%)#73 | 391,354(0.00%)#1,618 |
| 74. | Green Valley | 15 | 12,074(0.12%)#74 | 391,354(0.00%)#1,635 |
| 75. | Frederick | 13 | 12,074(0.11%)#75 | 391,354(0.00%)#1,703 |
| 76. | Scaggsville | 13 | 12,074(0.11%)#76 | 391,354(0.00%)#1,725 |
| 77. | Chevy Chase Village | 12 | 12,074(0.10%)#77 | 391,354(0.00%)#1,783 |
| 78. | Chevy Chase Section Five | 12 | 12,074(0.10%)#78 | 391,354(0.00%)#1,785 |
| 79. | Laytonsville | 12 | 12,074(0.10%)#79 | 391,354(0.00%)#1,786 |
| 80. | Westminster | 11 | 12,074(0.09%)#80 | 391,354(0.00%)#1,815 |
| 81. | Catonsville | 10 | 12,074(0.08%)#81 | 391,354(0.00%)#1,851 |
| 82. | Accokeek | 10 | 12,074(0.08%)#82 | 391,354(0.00%)#1,878 |
| 83. | Garrison | 10 | 12,074(0.08%)#83 | 391,354(0.00%)#1,885 |
| 84. | Four Corners | 10 | 12,074(0.08%)#84 | 391,354(0.00%)#1,889 |
| 85. | Suitland | 9 | 12,074(0.07%)#85 | 391,354(0.00%)#1,931 |
| 86. | Linganore | 9 | 12,074(0.07%)#86 | 391,354(0.00%)#1,951 |
| 87. | Marlton | 9 | 12,074(0.07%)#87 | 391,354(0.00%)#1,955 |
| 88. | Mount Aetna | 9 | 12,074(0.07%)#88 | 391,354(0.00%)#1,983 |
| 89. | Brunswick | 6 | 12,074(0.05%)#89 | 391,354(0.00%)#2,139 |
| 90. | Fort Washington | 5 | 12,074(0.04%)#90 | 391,354(0.00%)#2,179 |
| 91. | Cumberland | 5 | 12,074(0.04%)#91 | 391,354(0.00%)#2,182 |
| 92. | Somerset | 5 | 12,074(0.04%)#92 | 391,354(0.00%)#2,216 |
| 93. | Overlea | 4 | 12,074(0.03%)#93 | 391,354(0.00%)#2,228 |
| 94. | Chillum | 3 | 12,074(0.02%)#94 | 391,354(0.00%)#2,264 |
| 95. | Takoma Park | 3 | 12,074(0.02%)#95 | 391,354(0.00%)#2,268 |
| 96. | Grantsville | 2 | 12,074(0.02%)#96 | 391,354(0.00%)#2,321 |
| 97. | Garrett Park | 2 | 12,074(0.02%)#97 | 391,354(0.00%)#2,322 |
| 98. | North Chevy Chase | 2 | 12,074(0.02%)#98 | 391,354(0.00%)#2,325 |
Common Questions
What are the Top 10 Cities with the Most Immigrants from Iran in Maryland?
Top 10 Cities with the Most Immigrants from Iran in Maryland are:
#1
1,175
#2
1,028
#3
831
#4
671
#5
608
#6
557
#7
547
#8
434
#9
415
#10
382
What city has the Most Immigrants from Iran in Maryland?
Potomac has the Most Immigrants from Iran in Maryland with 1,175.
What is the Total Immigrants from Iran in the State of Maryland?
Total Immigrants from Iran in Maryland is 12,074.
What is the Total Immigrants from Iran in the United States?
Total Immigrants from Iran in the United States is 391,354.