Cities with the Highest Percentage of Population Employed in Health Diagnosing & Treating in Maryland
RELATED REPORTS & OPTIONS
Health Diagnosing & Treating
Maryland
Compare Cities
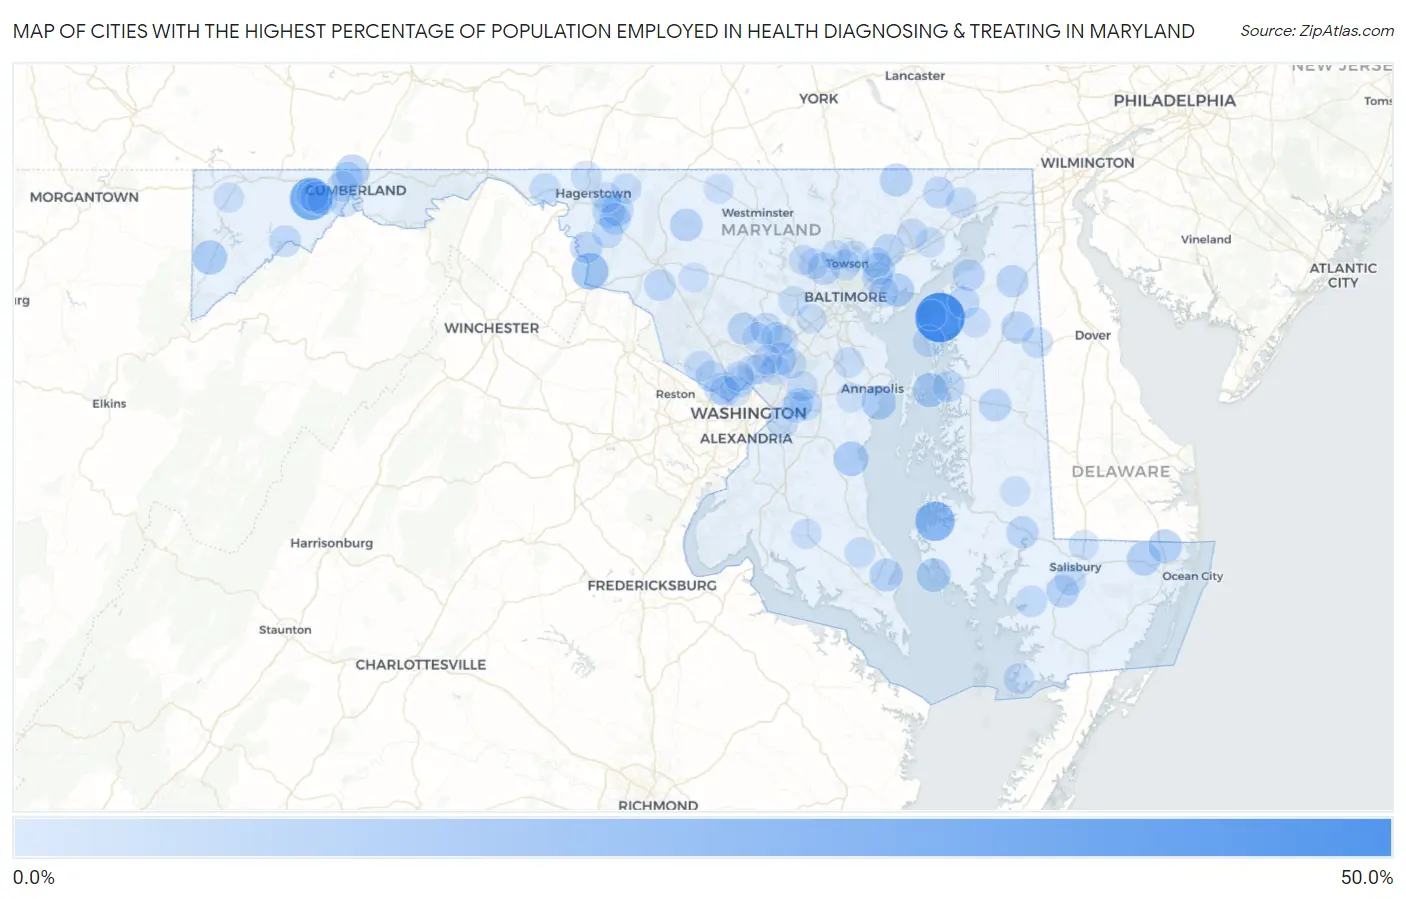
Map of Cities with the Highest Percentage of Population Employed in Health Diagnosing & Treating in Maryland
0.0%
50.0%
Cities with the Highest Percentage of Population Employed in Health Diagnosing & Treating in Maryland
| City | % Employed | vs State | vs National | |
| 1. | Georgetown | 46.4% | 6.2%(+40.2)#1 | 6.2%(+40.2)#95 |
| 2. | Crumpton | 38.5% | 6.2%(+32.3)#2 | 6.2%(+32.3)#156 |
| 3. | Carlos | 32.4% | 6.2%(+26.2)#3 | 6.2%(+26.2)#256 |
| 4. | Madison | 26.3% | 6.2%(+20.1)#4 | 6.2%(+20.1)#395 |
| 5. | Dargan | 20.8% | 6.2%(+14.6)#5 | 6.2%(+14.5)#684 |
| 6. | Friendship | 16.4% | 6.2%(+10.2)#6 | 6.2%(+10.1)#1,201 |
| 7. | Kent Narrows | 16.3% | 6.2%(+10.1)#7 | 6.2%(+10.0)#1,225 |
| 8. | Oakland | 16.2% | 6.2%(+9.95)#8 | 6.2%(+9.91)#1,250 |
| 9. | Highland Beach | 16.1% | 6.2%(+9.92)#9 | 6.2%(+9.88)#1,260 |
| 10. | Fishing Creek | 14.9% | 6.2%(+8.69)#10 | 6.2%(+8.65)#1,529 |
| 11. | Whaleyville | 14.8% | 6.2%(+8.57)#11 | 6.2%(+8.53)#1,561 |
| 12. | Bishopville | 14.7% | 6.2%(+8.53)#12 | 6.2%(+8.49)#1,567 |
| 13. | Ellerslie | 14.4% | 6.2%(+8.19)#13 | 6.2%(+8.15)#1,681 |
| 14. | Bowleys Quarters | 14.2% | 6.2%(+8.00)#14 | 6.2%(+7.97)#1,742 |
| 15. | Drum Point | 13.8% | 6.2%(+7.59)#15 | 6.2%(+7.56)#1,865 |
| 16. | Pylesville | 13.5% | 6.2%(+7.26)#16 | 6.2%(+7.22)#1,991 |
| 17. | Konterra | 13.1% | 6.2%(+6.88)#17 | 6.2%(+6.84)#2,144 |
| 18. | Eden | 13.0% | 6.2%(+6.82)#18 | 6.2%(+6.79)#2,173 |
| 19. | Woodsboro | 13.0% | 6.2%(+6.81)#19 | 6.2%(+6.77)#2,183 |
| 20. | Queen Anne | 12.7% | 6.2%(+6.54)#20 | 6.2%(+6.50)#2,309 |
| 21. | Midlothian | 12.7% | 6.2%(+6.52)#21 | 6.2%(+6.48)#2,319 |
| 22. | Pikesville | 12.7% | 6.2%(+6.49)#22 | 6.2%(+6.45)#2,335 |
| 23. | Sudlersville | 12.5% | 6.2%(+6.29)#23 | 6.2%(+6.26)#2,420 |
| 24. | Beaver Creek | 12.4% | 6.2%(+6.23)#24 | 6.2%(+6.20)#2,463 |
| 25. | Shaft | 12.3% | 6.2%(+6.13)#25 | 6.2%(+6.09)#2,511 |
| 26. | Vienna | 12.3% | 6.2%(+6.11)#26 | 6.2%(+6.07)#2,522 |
| 27. | Galena | 12.2% | 6.2%(+5.98)#27 | 6.2%(+5.95)#2,585 |
| 28. | Brookeville | 12.1% | 6.2%(+5.91)#28 | 6.2%(+5.88)#2,618 |
| 29. | Kingsville | 11.9% | 6.2%(+5.74)#29 | 6.2%(+5.70)#2,703 |
| 30. | Betterton | 11.7% | 6.2%(+5.46)#30 | 6.2%(+5.42)#2,855 |
| 31. | White Marsh | 11.6% | 6.2%(+5.41)#31 | 6.2%(+5.37)#2,896 |
| 32. | Bagtown | 11.6% | 6.2%(+5.40)#32 | 6.2%(+5.37)#2,899 |
| 33. | Sharpsburg | 11.6% | 6.2%(+5.39)#33 | 6.2%(+5.35)#2,911 |
| 34. | Buckeystown | 11.4% | 6.2%(+5.22)#34 | 6.2%(+5.18)#3,043 |
| 35. | Queenstown | 11.3% | 6.2%(+5.13)#35 | 6.2%(+5.10)#3,097 |
| 36. | Worton | 11.3% | 6.2%(+5.13)#36 | 6.2%(+5.10)#3,098 |
| 37. | Highland | 11.3% | 6.2%(+5.12)#37 | 6.2%(+5.09)#3,106 |
| 38. | Bloomington | 11.3% | 6.2%(+5.08)#38 | 6.2%(+5.05)#3,127 |
| 39. | Rock Hall | 11.2% | 6.2%(+4.99)#39 | 6.2%(+4.95)#3,190 |
| 40. | Mount Lena | 11.2% | 6.2%(+4.97)#40 | 6.2%(+4.93)#3,205 |
| 41. | Cabin John | 11.0% | 6.2%(+4.77)#41 | 6.2%(+4.73)#3,345 |
| 42. | Darlington | 11.0% | 6.2%(+4.76)#42 | 6.2%(+4.72)#3,350 |
| 43. | District Heights | 11.0% | 6.2%(+4.74)#43 | 6.2%(+4.71)#3,357 |
| 44. | Potomac Park | 10.9% | 6.2%(+4.73)#44 | 6.2%(+4.69)#3,372 |
| 45. | Honeygo | 10.9% | 6.2%(+4.66)#45 | 6.2%(+4.62)#3,411 |
| 46. | Rossville | 10.8% | 6.2%(+4.64)#46 | 6.2%(+4.60)#3,433 |
| 47. | Mount Vernon | 10.8% | 6.2%(+4.58)#47 | 6.2%(+4.54)#3,482 |
| 48. | Hampton | 10.8% | 6.2%(+4.55)#48 | 6.2%(+4.51)#3,511 |
| 49. | Corriganville | 10.6% | 6.2%(+4.40)#49 | 6.2%(+4.36)#3,631 |
| 50. | Boonsboro | 10.5% | 6.2%(+4.27)#50 | 6.2%(+4.23)#3,758 |
| 51. | Fulton | 10.2% | 6.2%(+3.99)#51 | 6.2%(+3.95)#4,022 |
| 52. | Fruitland | 10.1% | 6.2%(+3.89)#52 | 6.2%(+3.85)#4,112 |
| 53. | Woodmore | 10.1% | 6.2%(+3.87)#53 | 6.2%(+3.83)#4,125 |
| 54. | Potomac | 10.0% | 6.2%(+3.82)#54 | 6.2%(+3.78)#4,174 |
| 55. | North Chevy Chase | 10.0% | 6.2%(+3.76)#55 | 6.2%(+3.72)#4,252 |
| 56. | Clear Spring | 10.0% | 6.2%(+3.75)#56 | 6.2%(+3.71)#4,263 |
| 57. | Somerset | 9.9% | 6.2%(+3.69)#57 | 6.2%(+3.66)#4,311 |
| 58. | La Vale | 9.9% | 6.2%(+3.67)#58 | 6.2%(+3.63)#4,343 |
| 59. | Towson | 9.7% | 6.2%(+3.54)#59 | 6.2%(+3.50)#4,496 |
| 60. | Templeville | 9.7% | 6.2%(+3.51)#60 | 6.2%(+3.48)#4,519 |
| 61. | White Oak | 9.6% | 6.2%(+3.43)#61 | 6.2%(+3.39)#4,608 |
| 62. | Garrison | 9.6% | 6.2%(+3.40)#62 | 6.2%(+3.36)#4,649 |
| 63. | Maugansville | 9.6% | 6.2%(+3.38)#63 | 6.2%(+3.34)#4,671 |
| 64. | Broomes Island | 9.6% | 6.2%(+3.37)#64 | 6.2%(+3.33)#4,679 |
| 65. | Robinwood | 9.6% | 6.2%(+3.36)#65 | 6.2%(+3.32)#4,687 |
| 66. | Arden On The Severn | 9.6% | 6.2%(+3.34)#66 | 6.2%(+3.31)#4,702 |
| 67. | Port Deposit | 9.5% | 6.2%(+3.32)#67 | 6.2%(+3.28)#4,730 |
| 68. | Lake Arbor | 9.5% | 6.2%(+3.25)#68 | 6.2%(+3.21)#4,820 |
| 69. | Brown Station | 9.4% | 6.2%(+3.17)#69 | 6.2%(+3.13)#4,914 |
| 70. | Travilah | 9.3% | 6.2%(+3.14)#70 | 6.2%(+3.10)#4,968 |
| 71. | Crisfield | 9.3% | 6.2%(+3.09)#71 | 6.2%(+3.05)#5,037 |
| 72. | Perry Hall | 9.2% | 6.2%(+3.00)#72 | 6.2%(+2.96)#5,118 |
| 73. | Scaggsville | 9.2% | 6.2%(+2.98)#73 | 6.2%(+2.95)#5,137 |
| 74. | Glenn Dale | 9.1% | 6.2%(+2.93)#74 | 6.2%(+2.89)#5,220 |
| 75. | Bel Air South | 9.1% | 6.2%(+2.91)#75 | 6.2%(+2.87)#5,241 |
| 76. | Vale Summit | 9.0% | 6.2%(+2.78)#76 | 6.2%(+2.74)#5,450 |
| 77. | Smithsburg | 9.0% | 6.2%(+2.75)#77 | 6.2%(+2.71)#5,481 |
| 78. | Tolchester | 8.9% | 6.2%(+2.71)#78 | 6.2%(+2.68)#5,538 |
| 79. | Ashton Sandy Spring | 8.8% | 6.2%(+2.60)#79 | 6.2%(+2.56)#5,693 |
| 80. | Mitchellville | 8.8% | 6.2%(+2.57)#80 | 6.2%(+2.53)#5,728 |
| 81. | Glen Echo | 8.8% | 6.2%(+2.55)#81 | 6.2%(+2.51)#5,760 |
| 82. | Charlotte Hall | 8.8% | 6.2%(+2.55)#82 | 6.2%(+2.51)#5,769 |
| 83. | Owings Mills | 8.7% | 6.2%(+2.54)#83 | 6.2%(+2.50)#5,781 |
| 84. | Accident | 8.7% | 6.2%(+2.53)#84 | 6.2%(+2.49)#5,796 |
| 85. | Kingstown | 8.7% | 6.2%(+2.49)#85 | 6.2%(+2.45)#5,848 |
| 86. | Kemp Mill | 8.6% | 6.2%(+2.41)#86 | 6.2%(+2.37)#5,975 |
| 87. | Chevy Chase View | 8.6% | 6.2%(+2.36)#87 | 6.2%(+2.33)#6,053 |
| 88. | Beltsville | 8.6% | 6.2%(+2.35)#88 | 6.2%(+2.31)#6,076 |
| 89. | Mays Chapel | 8.5% | 6.2%(+2.32)#89 | 6.2%(+2.29)#6,113 |
| 90. | Ellicott City | 8.5% | 6.2%(+2.31)#90 | 6.2%(+2.28)#6,133 |
| 91. | South Laurel | 8.5% | 6.2%(+2.31)#91 | 6.2%(+2.27)#6,144 |
| 92. | Essex | 8.3% | 6.2%(+2.14)#92 | 6.2%(+2.10)#6,395 |
| 93. | Hurlock | 8.3% | 6.2%(+2.13)#93 | 6.2%(+2.09)#6,403 |
| 94. | Riverside | 8.3% | 6.2%(+2.06)#94 | 6.2%(+2.03)#6,522 |
| 95. | Delmar | 8.3% | 6.2%(+2.06)#95 | 6.2%(+2.02)#6,526 |
| 96. | Fairland | 8.3% | 6.2%(+2.05)#96 | 6.2%(+2.01)#6,559 |
| 97. | Ilchester | 8.2% | 6.2%(+1.95)#97 | 6.2%(+1.92)#6,713 |
| 98. | Riva | 8.2% | 6.2%(+1.95)#98 | 6.2%(+1.91)#6,724 |
| 99. | Taneytown | 8.1% | 6.2%(+1.91)#99 | 6.2%(+1.87)#6,785 |
| 100. | Monrovia | 8.1% | 6.2%(+1.87)#100 | 6.2%(+1.83)#6,852 |
Common Questions
What are the Top 10 Cities with the Highest Percentage of Population Employed in Health Diagnosing & Treating in Maryland?
Top 10 Cities with the Highest Percentage of Population Employed in Health Diagnosing & Treating in Maryland are:
#1
46.4%
#2
32.4%
#3
26.3%
#4
20.8%
#5
16.4%
#6
16.3%
#7
16.2%
#8
16.1%
#9
14.9%
#10
14.8%
What city has the Highest Percentage of Population Employed in Health Diagnosing & Treating in Maryland?
Georgetown has the Highest Percentage of Population Employed in Health Diagnosing & Treating in Maryland with 46.4%.
What is the Percentage of Population Employed in Health Diagnosing & Treating in the State of Maryland?
Percentage of Population Employed in Health Diagnosing & Treating in Maryland is 6.2%.
What is the Percentage of Population Employed in Health Diagnosing & Treating in the United States?
Percentage of Population Employed in Health Diagnosing & Treating in the United States is 6.2%.